| Param | Original file | Final file |
|---|---|---|
| Filename | modeM0/AS1C07_004T01_9000005052_35222cztM0_level2.evt | modeM0/AS1C07_004T01_9000005052_35222cztM0_level2_quad_clean.evt |
| Size (bytes) | 812,833,920 | 63,256,320 |
| Size | 775.2 MB | 60.3 MB |
| Events in quadrant A | 2,632,994 | 437,811 |
| Events in quadrant B | 9,027,750 | 285,691 |
| Events in quadrant C | 3,298,445 | 420,877 |
| Events in quadrant D | 9,283,724 | 380,725 |
| Mode M0 | |||
|---|---|---|---|
| Quadrant | BADHDUFLAG | Total packets | Discarded packets |
| A | 0 | 11472 | 3 |
| B | 0 | 30639 | 2 |
| C | 0 | 13391 | 2 |
| D | 0 | 31404 | 2 |
| Mode SS | |||
|---|---|---|---|
| Quadrant | BADHDUFLAG | Total packets | Discarded packets |
| A | 0 | 114 | 0 |
| B | 0 | 114 | 0 |
| C | 0 | 114 | 0 |
| D | 0 | 114 | 0 |
| Mode M9 | |||
|---|---|---|---|
| Quadrant | BADHDUFLAG | Total packets | Discarded packets |
| A | 0 | 16 | 0 |
| B | 0 | 16 | 0 |
| C | 0 | 16 | 0 |
| D | 0 | 16 | 0 |
| Quadrant | Total seconds | Saturated seconds | Saturation percentage |
|---|---|---|---|
| A | 5553 | 7 | 0.126058% |
| B | 5553 | 2638 | 47.505853% |
| C | 5553 | 154 | 2.773276% |
| D | 5554 | 1165 | 20.975873% |
Noise dominated data is calculated using 1-second bins in cleaned event files. If a bin has >2000 counts, and if more than 50% of those come from <1% of pixels, then it is considered to be noise-dominated and hence unusable.
| Quadrant | # 1 sec bins | Bins with >0 counts | Bins with >2000 counts | High rate bins dominated by noise | Noise dominated (total time) | Noise dominated (detector-on time) | Marked lightcurve |
|---|---|---|---|---|---|---|---|
| A | 7196 | 5554 | 0 | 0 | 0.00% | 0.00% | 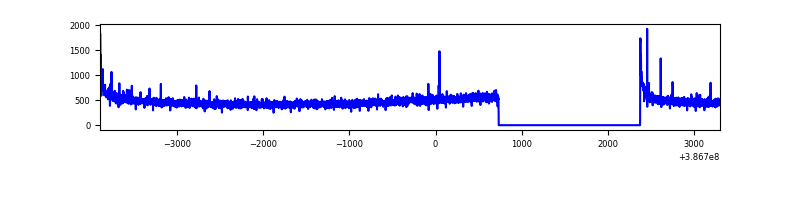 |
| B | 7195 | 5553 | 2029 | 2029 | 28.20% | 36.54% | 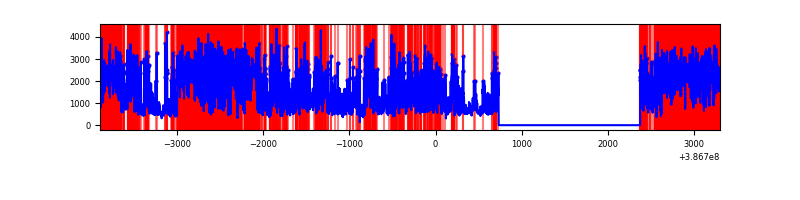 |
| C | 7196 | 5554 | 127 | 127 | 1.76% | 2.29% | 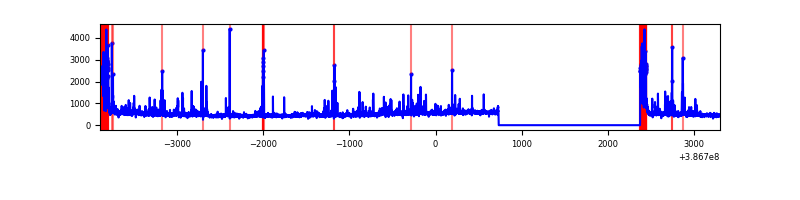 |
| D | 7197 | 5555 | 1650 | 1650 | 22.93% | 29.70% | 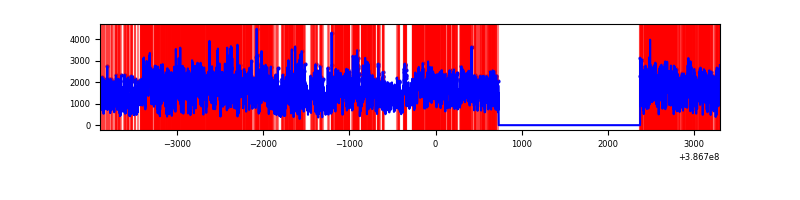 |
Top three noisy pixels from each quadrant. If the there are fewer than three noisy pixels in the level2.evt file, extra rows are filled as -1
| Pixel properties | Quadrant properties | ||||||
|---|---|---|---|---|---|---|---|
| Quadrant | DetID | PixID | Counts | Sigma | Mean | Median | Sigma |
| A | 10 | 83 | 105121 | 801.99 | 643 | 631 | 130.3 |
| A | 9 | 143 | 16080 | 118.58 | 643 | 631 | 130.3 |
| A | 13 | 6 | 12838 | 93.69 | 643 | 631 | 130.3 |
| B | 5 | 236 | 4996884 | 51790.93 | 504 | 492 | 96.5 |
| B | 5 | 172 | 1947924 | 20186.43 | 504 | 492 | 96.5 |
| B | 4 | 232 | 80961 | 834.11 | 504 | 492 | 96.5 |
| C | 0 | 10 | 351281 | 2460.4 | 609 | 612 | 142.5 |
| C | 15 | 214 | 228932 | 1601.96 | 609 | 612 | 142.5 |
| C | 0 | 207 | 177435 | 1240.64 | 609 | 612 | 142.5 |
| D | 8 | 195 | 5841409 | 39193.14 | 597 | 581 | 149.0 |
| D | 1 | 47 | 425612 | 2852.04 | 597 | 581 | 149.0 |
| D | 13 | 249 | 229067 | 1533.19 | 597 | 581 | 149.0 |
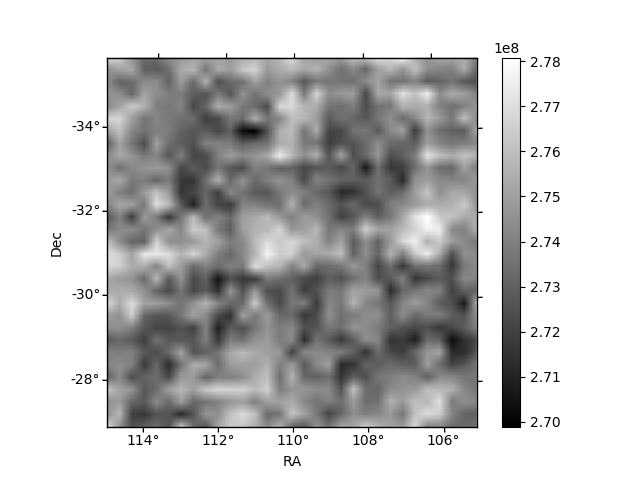
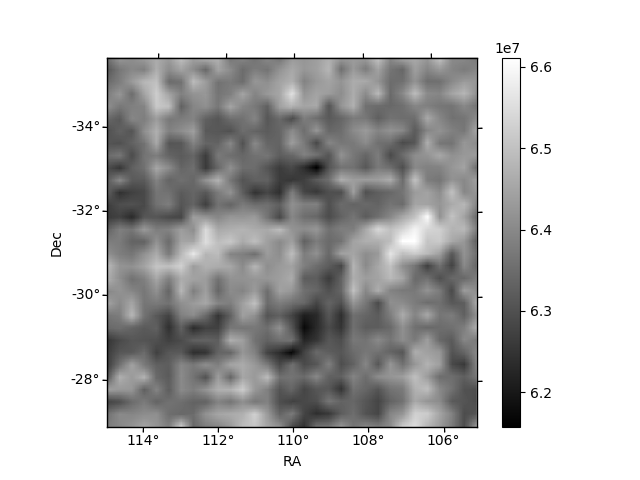
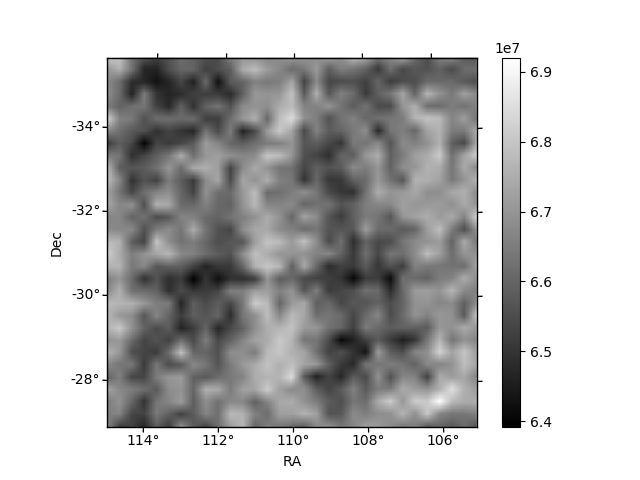
Histogram calculated using DETX and DETY for each event in the final _common_clean file
| Quadrant A | 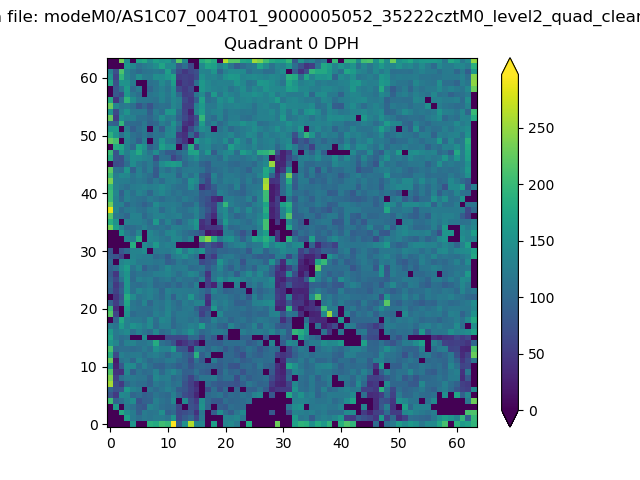 |
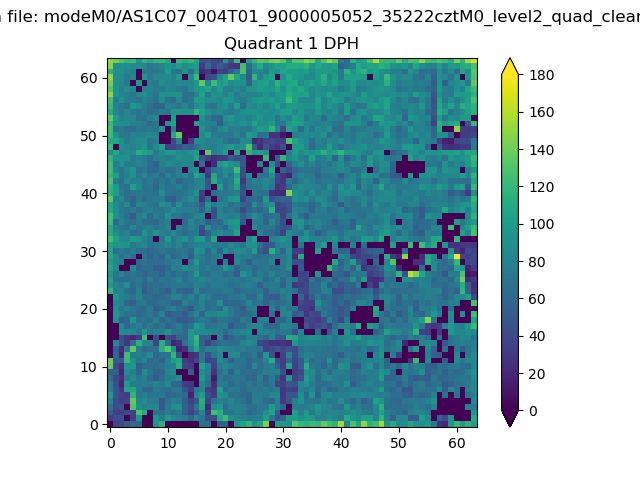 |
Quadrant B |
|---|---|---|---|
| Quadrant D | 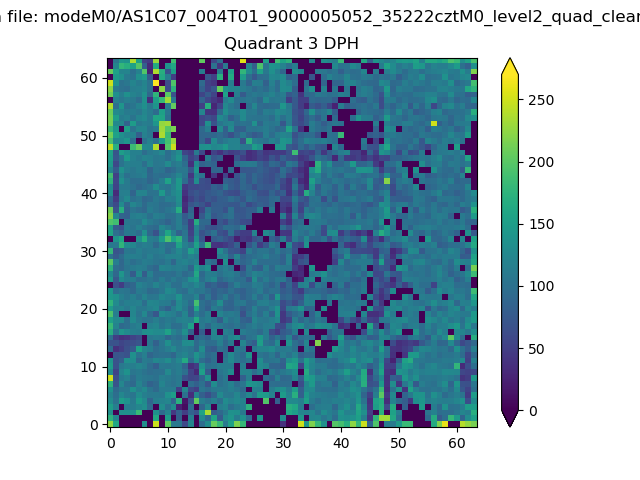 |
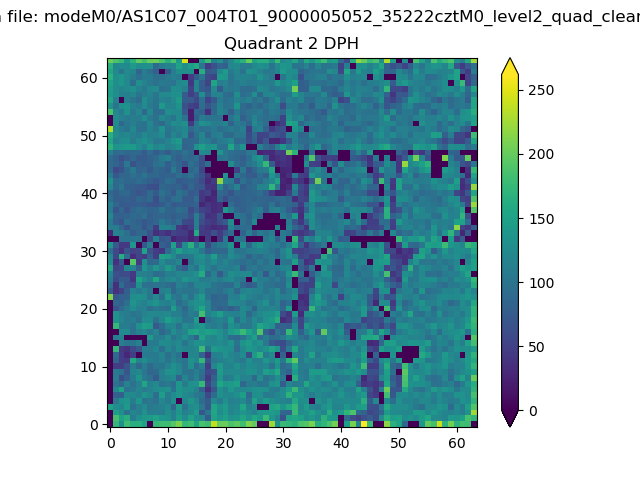 |
Quadrant C |
| Plot type | Count rate plots | Images |
|---|---|---|
| Comparison with Poisson distribution Blue bars denote a histogram of data divided into 1 sec bins. Red curve is a Poisson curve with rate = median count rate of data. |
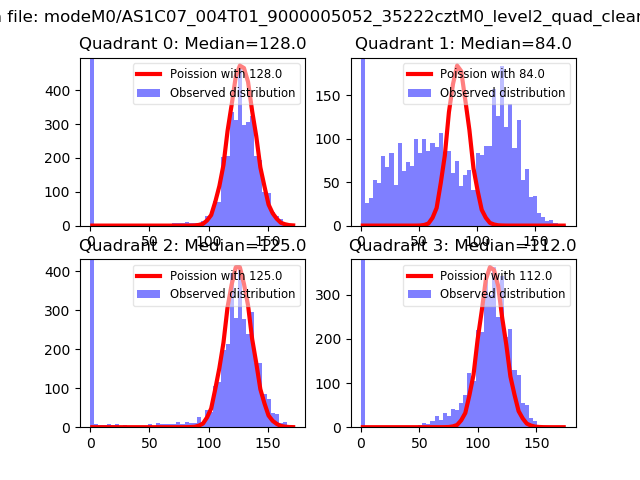 |
 |
| Quadrant-wise count rates Data is divided into 100 sec bins |
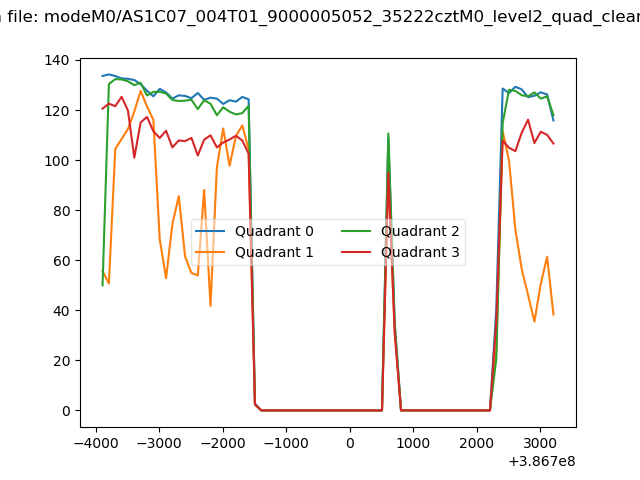 |
|
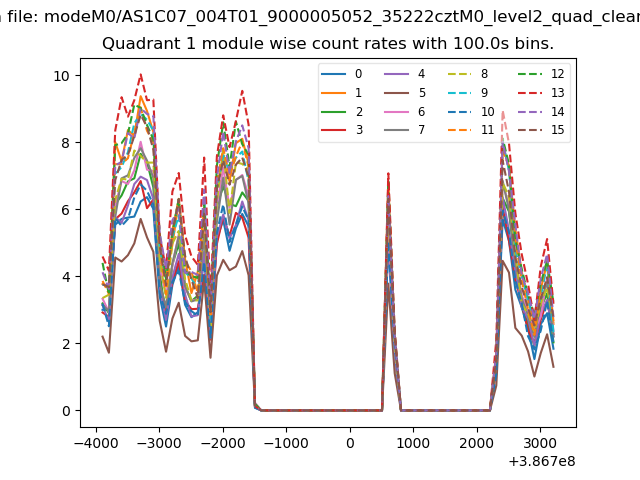
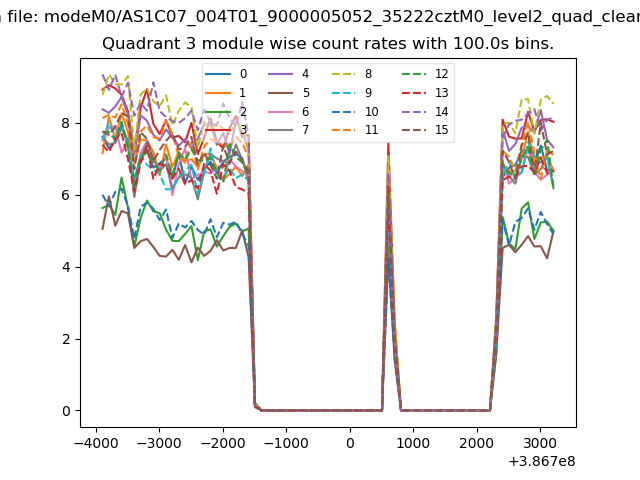
| Module-wise count rates for Quadrant A Data is divided into 100 sec bins |
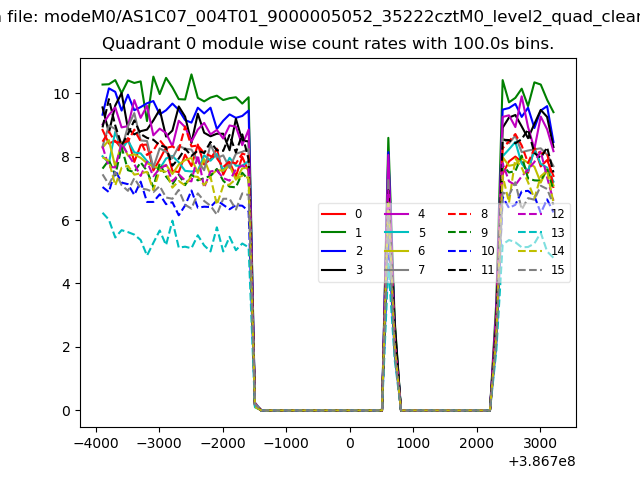 |
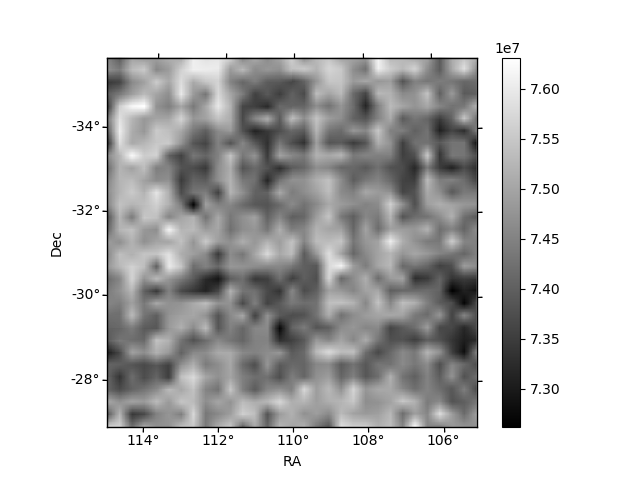 |
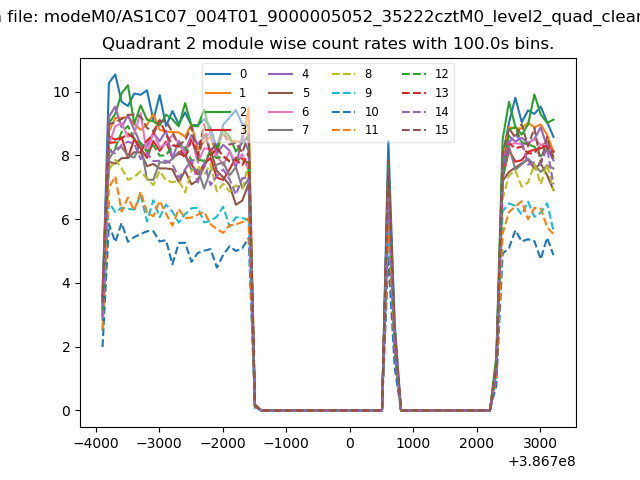
| Module-wise count rates for Quadrant B Data is divided into 100 sec bins |
 |
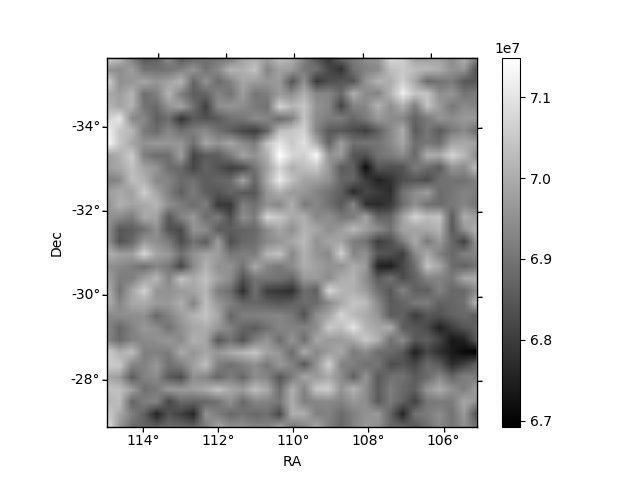 |
| Module-wise count rates for Quadrant C Data is divided into 100 sec bins |
 |
 |
| Module-wise count rates for Quadrant D Data is divided into 100 sec bins |
 |
 |
| Parameter | Plot |
|---|---|
| CZT HV Monitor | 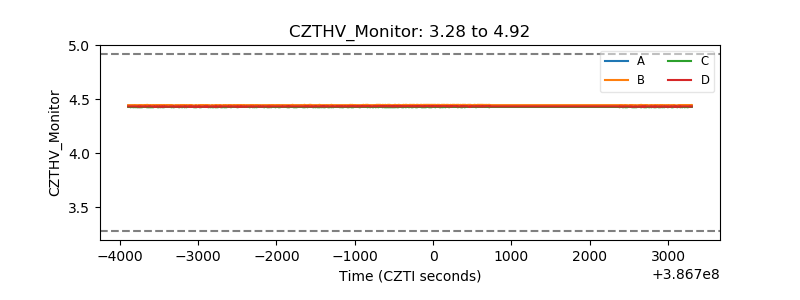 |
| D_VDD | 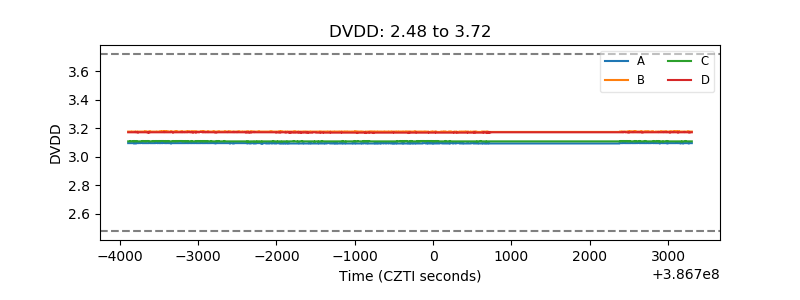 |
| Temperature 1 | 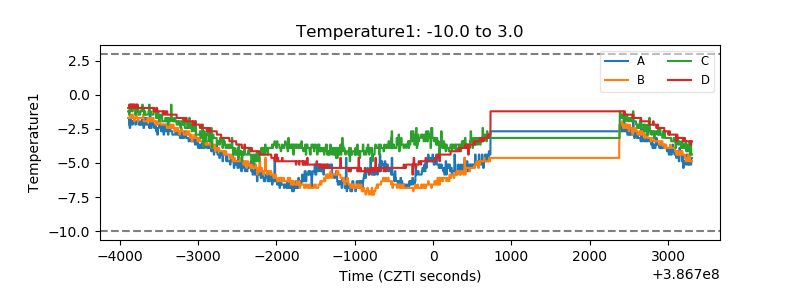 |
| Veto HV Monitor | 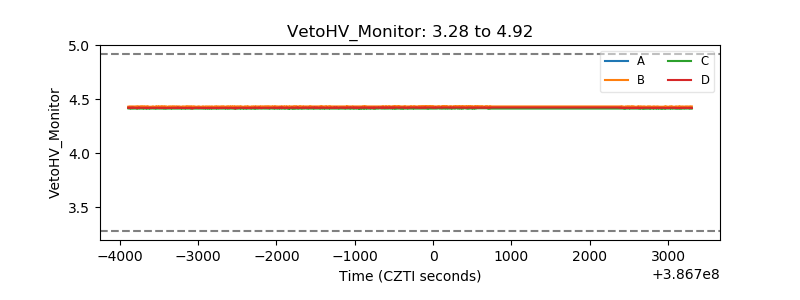 |
| Veto LLD | 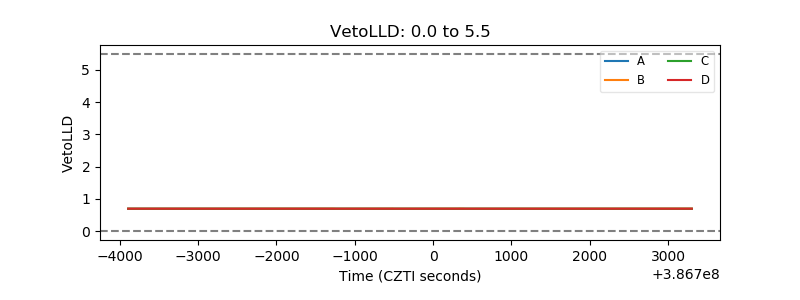 |
| Alpha Counter | 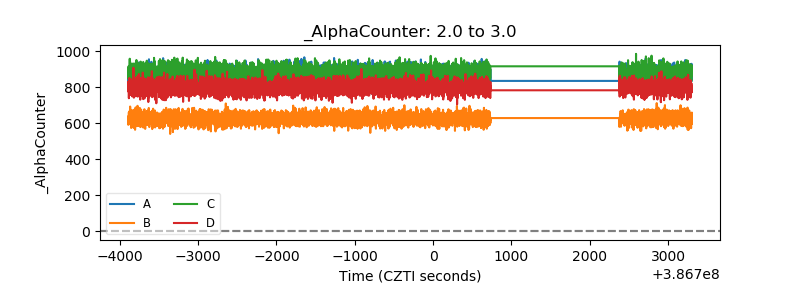 |
| _CPM_Rate | 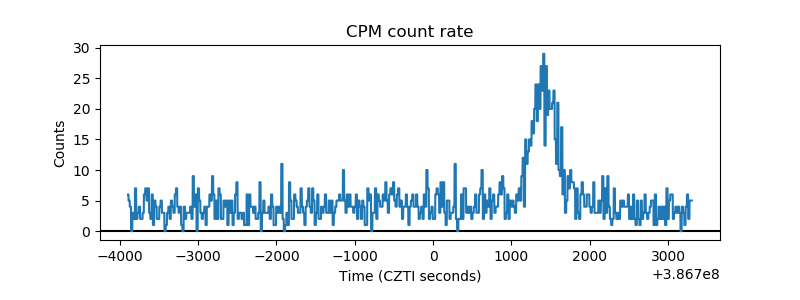 |
| CZT Counter | 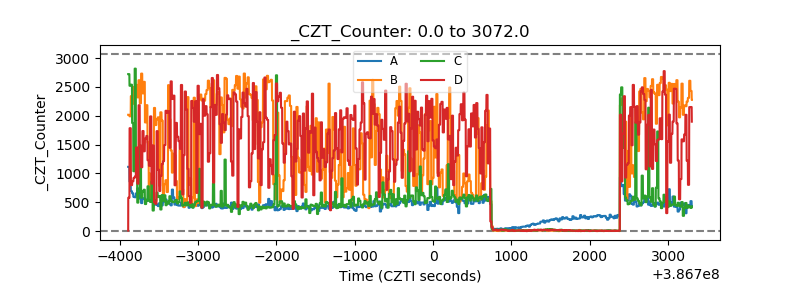 |
| +2.5 Volts monitor | 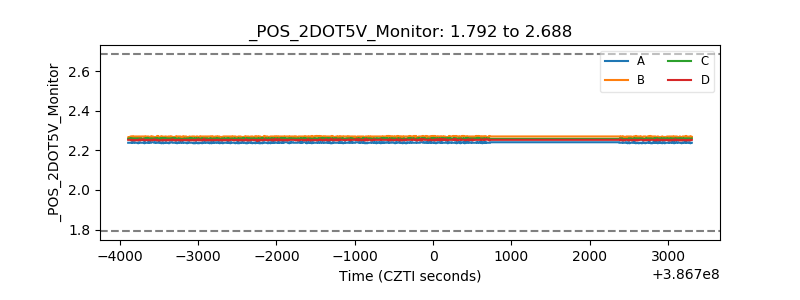 |
| +5 Volts monitor | 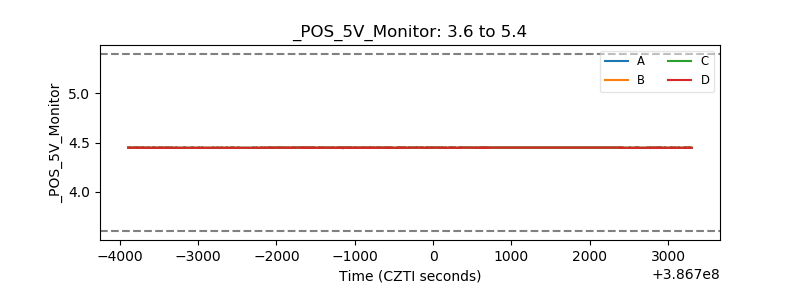 |
| _ROLL_ROT | 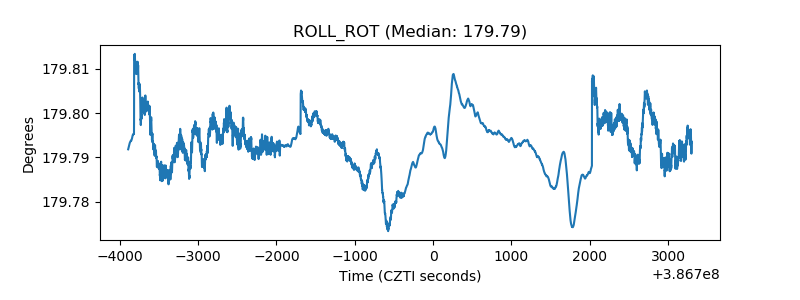 |
| _Roll_DEC | 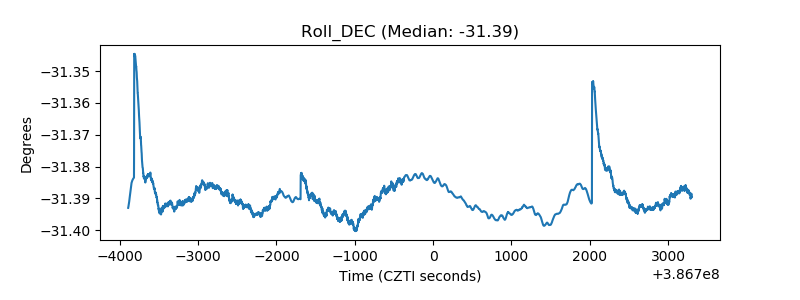 |
| _Roll_RA | 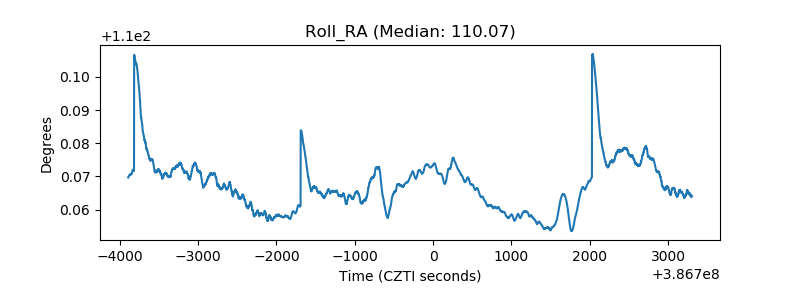 |
| Veto Counter | 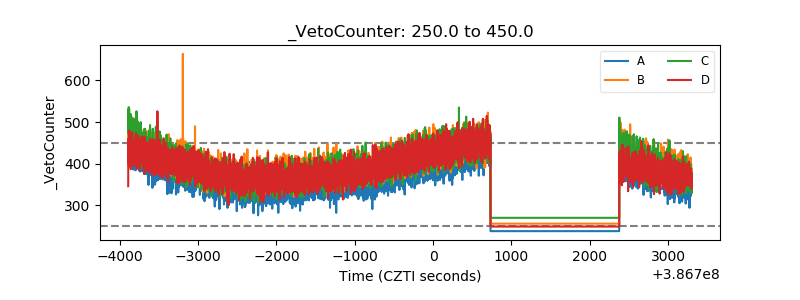 |