| Param | Original file | Final file |
|---|---|---|
| Filename | modeM0/AS1C07_004T01_9000005052_35221cztM0_level2.evt | modeM0/AS1C07_004T01_9000005052_35221cztM0_level2_quad_clean.evt |
| Size (bytes) | 789,264,000 | 72,216,000 |
| Size | 752.7 MB | 68.9 MB |
| Events in quadrant A | 2,583,710 | 515,572 |
| Events in quadrant B | 8,744,905 | 369,043 |
| Events in quadrant C | 3,060,453 | 496,851 |
| Events in quadrant D | 9,156,362 | 431,754 |
| Mode M0 | |||
|---|---|---|---|
| Quadrant | BADHDUFLAG | Total packets | Discarded packets |
| A | 0 | 11065 | 3 |
| B | 0 | 29645 | 2 |
| C | 0 | 12313 | 2 |
| D | 0 | 30876 | 2 |
| Mode SS | |||
|---|---|---|---|
| Quadrant | BADHDUFLAG | Total packets | Discarded packets |
| A | 0 | 108 | 0 |
| B | 0 | 108 | 0 |
| C | 0 | 108 | 0 |
| D | 0 | 108 | 0 |
| Mode M9 | |||
|---|---|---|---|
| Quadrant | BADHDUFLAG | Total packets | Discarded packets |
| A | 0 | 19 | 0 |
| B | 0 | 19 | 0 |
| C | 0 | 19 | 0 |
| D | 0 | 20 | 0 |
| Quadrant | Total seconds | Saturated seconds | Saturation percentage |
|---|---|---|---|
| A | 5313 | 7 | 0.131752% |
| B | 5313 | 2549 | 47.976661% |
| C | 5313 | 142 | 2.672690% |
| D | 5313 | 1276 | 24.016563% |
Noise dominated data is calculated using 1-second bins in cleaned event files. If a bin has >2000 counts, and if more than 50% of those come from <1% of pixels, then it is considered to be noise-dominated and hence unusable.
| Quadrant | # 1 sec bins | Bins with >0 counts | Bins with >2000 counts | High rate bins dominated by noise | Noise dominated (total time) | Noise dominated (detector-on time) | Marked lightcurve |
|---|---|---|---|---|---|---|---|
| A | 7286 | 5314 | 0 | 0 | 0.00% | 0.00% | 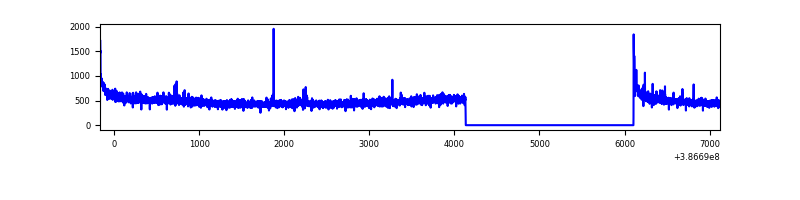 |
| B | 7286 | 5314 | 1924 | 1924 | 26.41% | 36.21% | 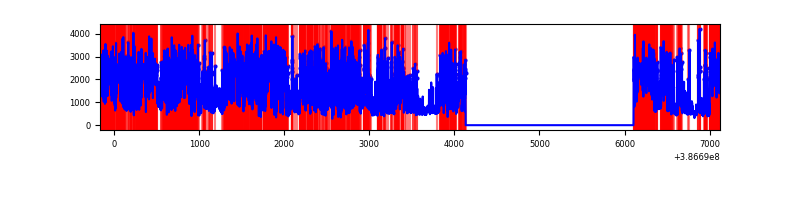 |
| C | 7286 | 5314 | 114 | 114 | 1.56% | 2.15% | 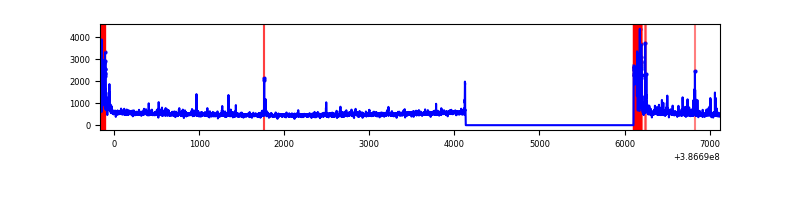 |
| D | 7286 | 5314 | 1810 | 1810 | 24.84% | 34.06% | 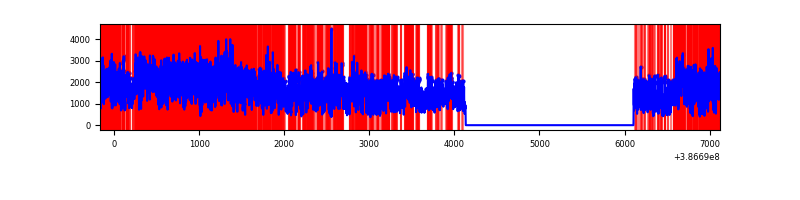 |
Top three noisy pixels from each quadrant. If the there are fewer than three noisy pixels in the level2.evt file, extra rows are filled as -1
| Pixel properties | Quadrant properties | ||||||
|---|---|---|---|---|---|---|---|
| Quadrant | DetID | PixID | Counts | Sigma | Mean | Median | Sigma |
| A | 10 | 83 | 104409 | 820.83 | 626 | 615 | 126.4 |
| A | 13 | 6 | 20064 | 153.81 | 626 | 615 | 126.4 |
| A | 9 | 143 | 16582 | 126.27 | 626 | 615 | 126.4 |
| B | 5 | 236 | 5240858 | 56094.23 | 492 | 480 | 93.4 |
| B | 5 | 172 | 1341064 | 14349.92 | 492 | 480 | 93.4 |
| B | 4 | 232 | 162396 | 1733.19 | 492 | 480 | 93.4 |
| C | 0 | 10 | 383017 | 2808.72 | 589 | 596 | 136.2 |
| C | 15 | 214 | 218488 | 1600.32 | 589 | 596 | 136.2 |
| C | 0 | 207 | 53412 | 387.91 | 589 | 596 | 136.2 |
| D | 8 | 195 | 6068459 | 43048.58 | 575 | 559 | 141.0 |
| D | 1 | 47 | 259786 | 1839.08 | 575 | 559 | 141.0 |
| D | 10 | 118 | 211417 | 1495.92 | 575 | 559 | 141.0 |
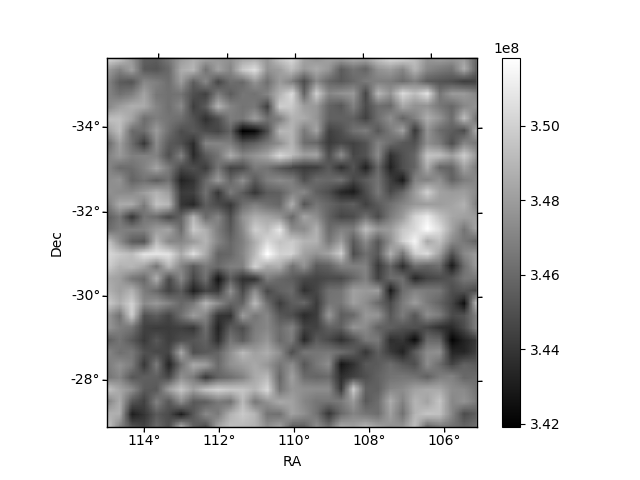
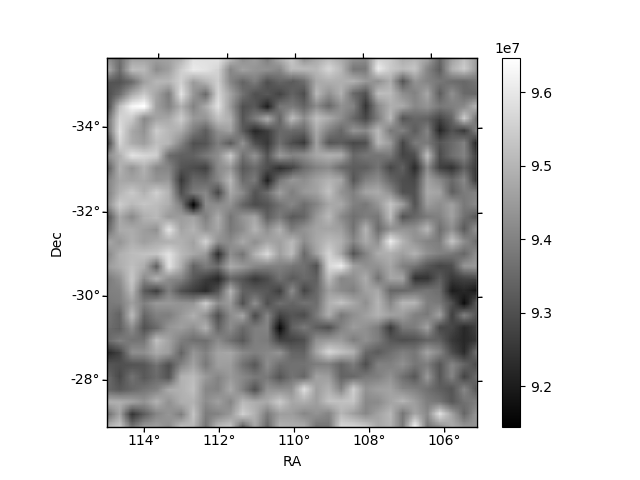
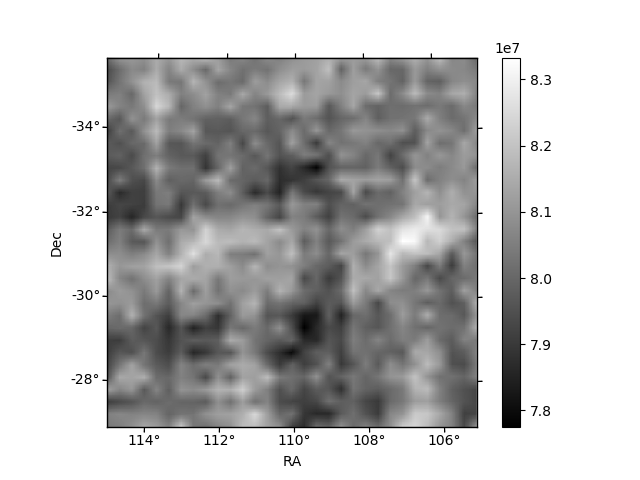
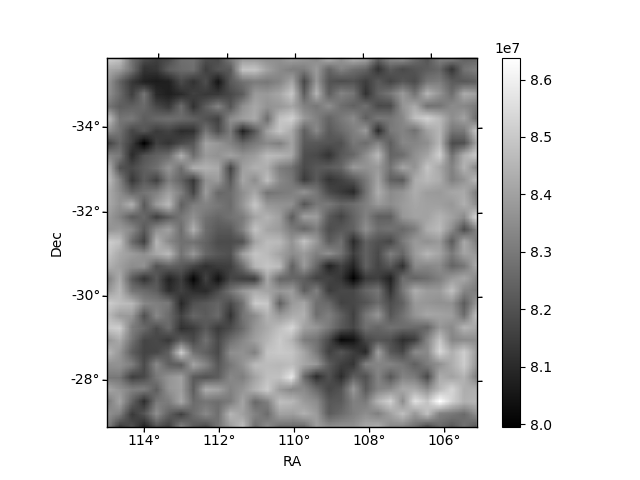
Histogram calculated using DETX and DETY for each event in the final _common_clean file
| Quadrant A | 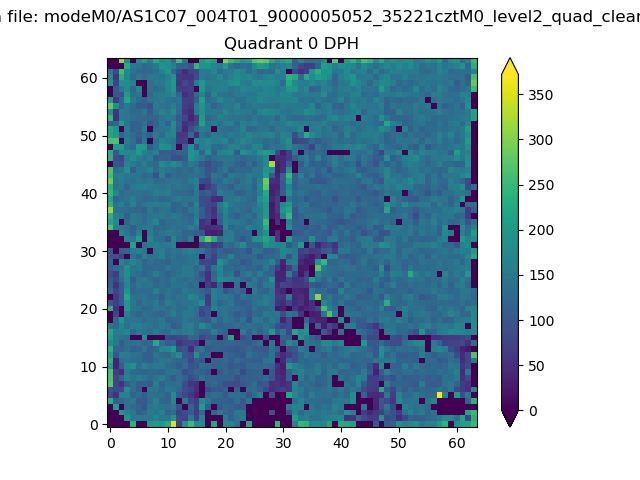 |
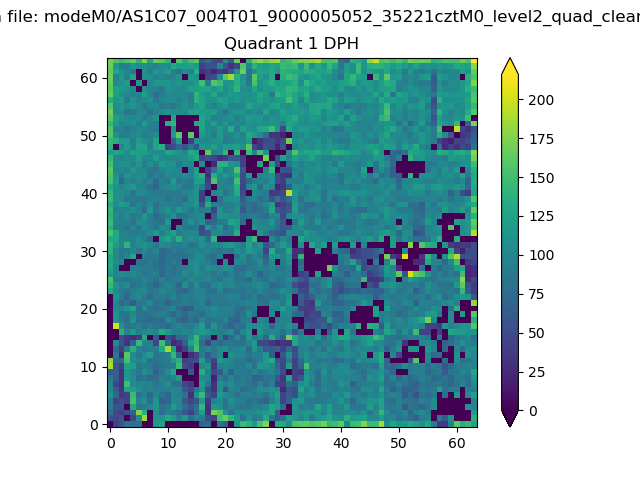 |
Quadrant B |
|---|---|---|---|
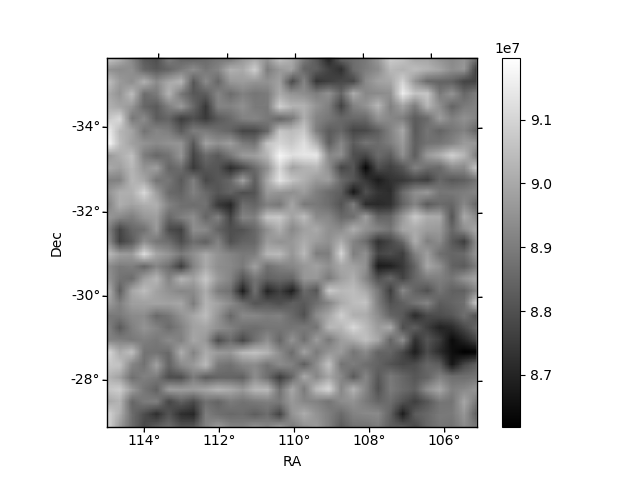
| Quadrant D | 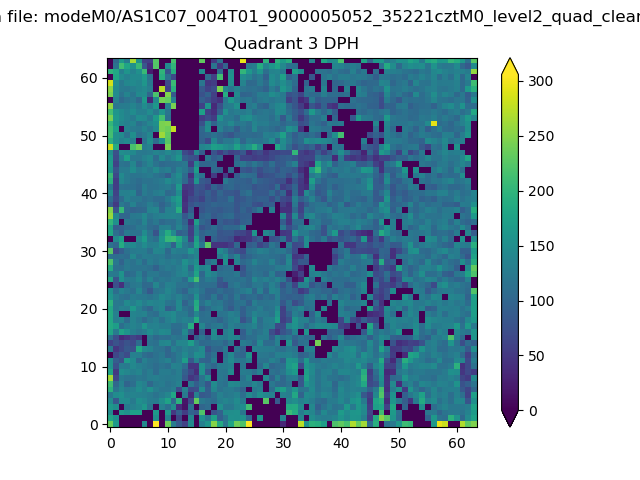 |
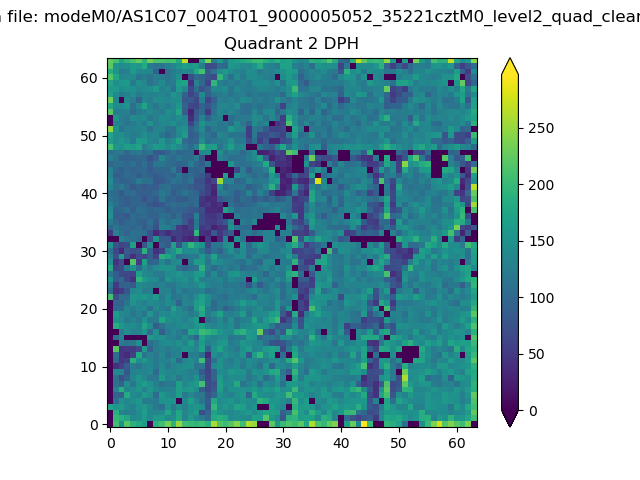 |
Quadrant C |
| Plot type | Count rate plots | Images |
|---|---|---|
| Comparison with Poisson distribution Blue bars denote a histogram of data divided into 1 sec bins. Red curve is a Poisson curve with rate = median count rate of data. |
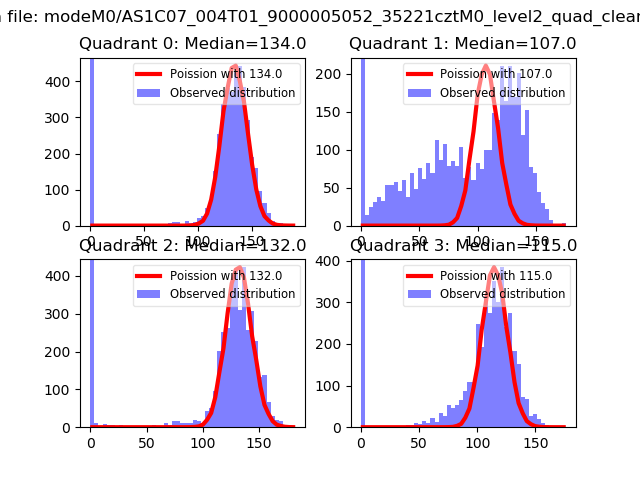 |
 |
| Quadrant-wise count rates Data is divided into 100 sec bins |
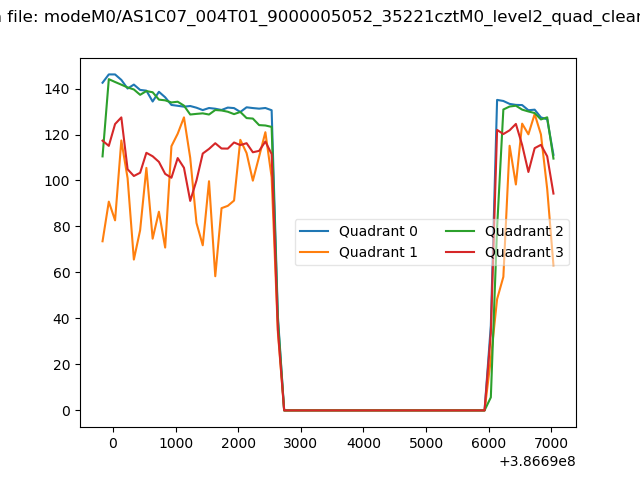 |
|
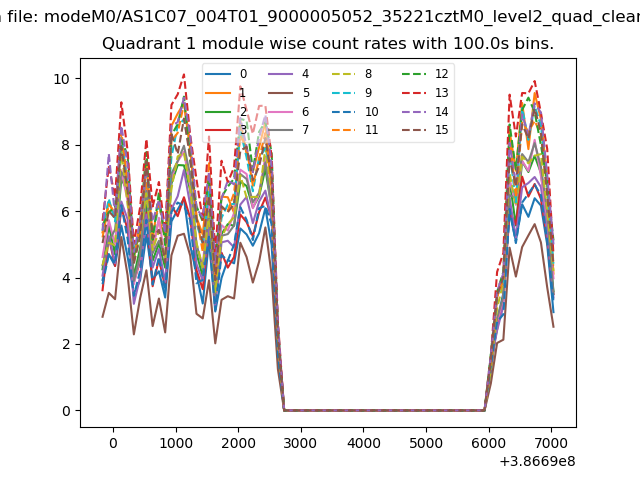
| Module-wise count rates for Quadrant A Data is divided into 100 sec bins |
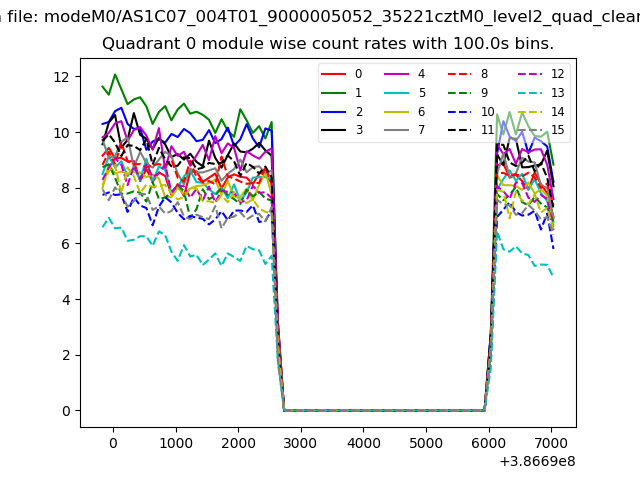 |
 |
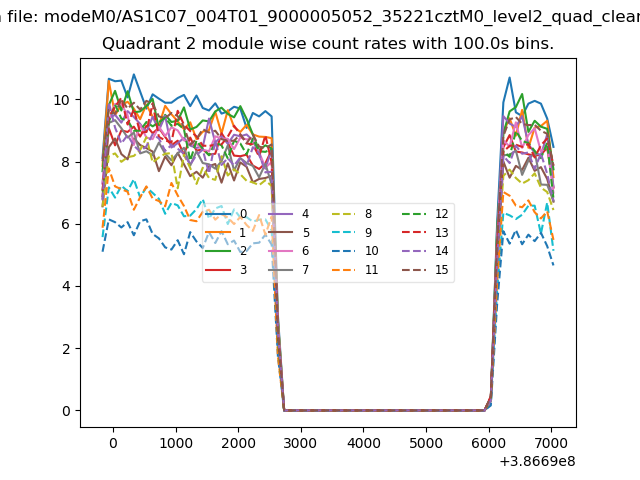
| Module-wise count rates for Quadrant B Data is divided into 100 sec bins |
 |
 |
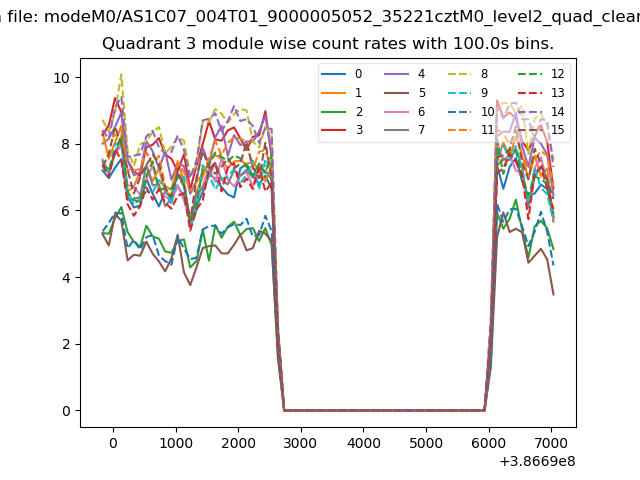
| Module-wise count rates for Quadrant C Data is divided into 100 sec bins |
 |
 |
| Module-wise count rates for Quadrant D Data is divided into 100 sec bins |
 |
 |
| Parameter | Plot |
|---|---|
| CZT HV Monitor | 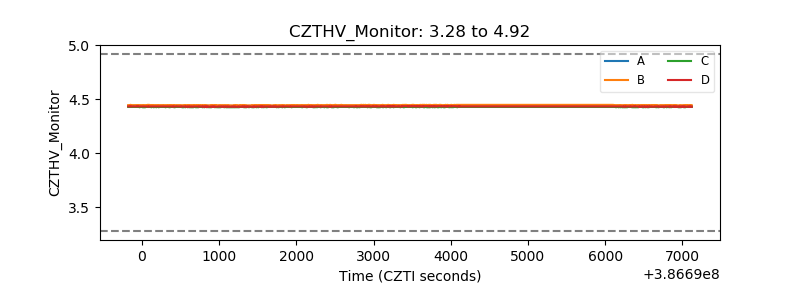 |
| D_VDD | 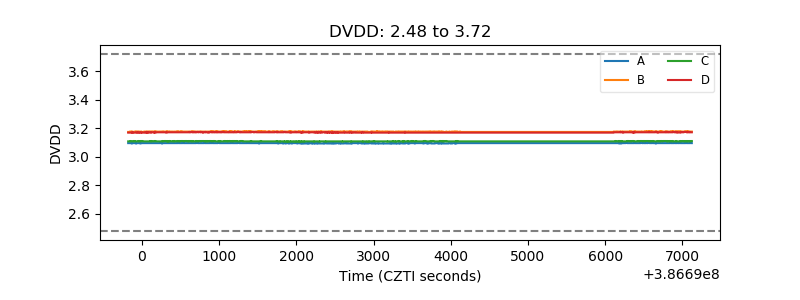 |
| Temperature 1 | 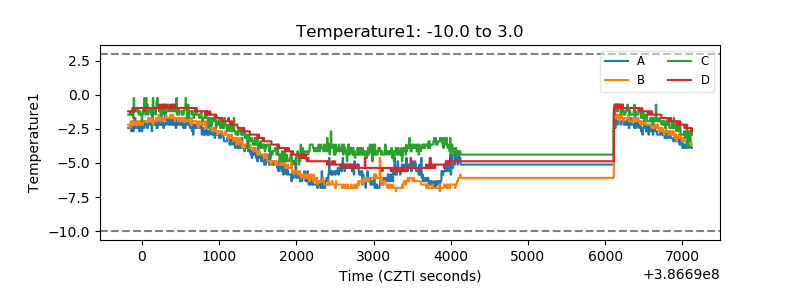 |
| Veto HV Monitor | 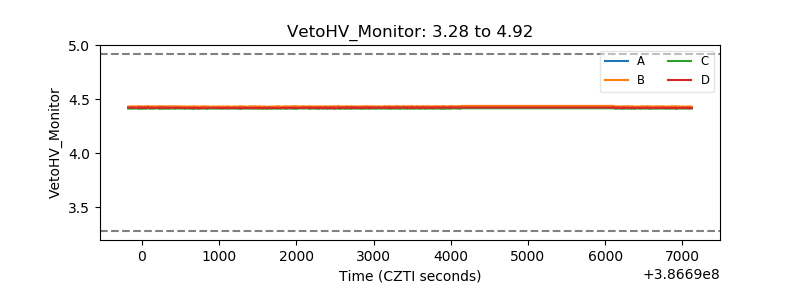 |
| Veto LLD | 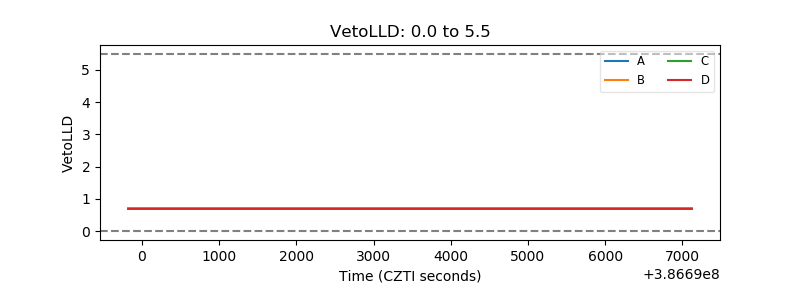 |
| Alpha Counter | 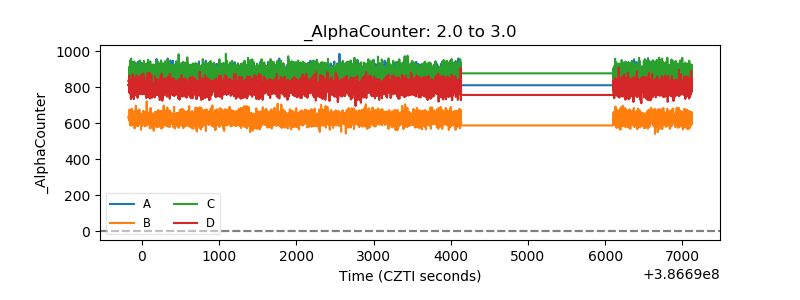 |
| _CPM_Rate | 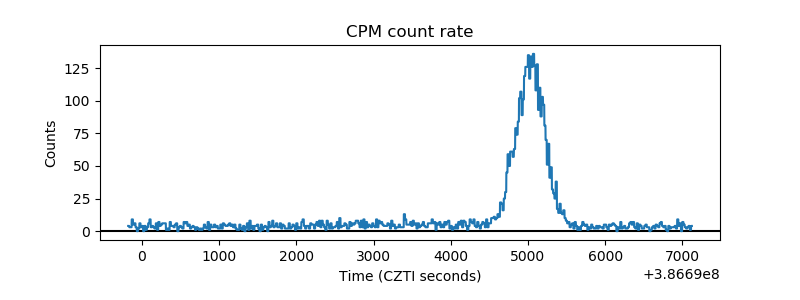 |
| CZT Counter | 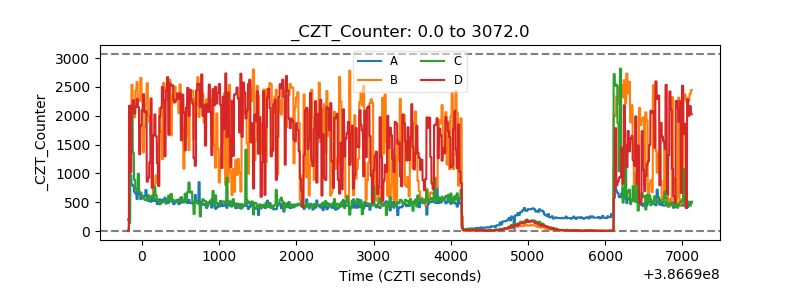 |
| +2.5 Volts monitor | 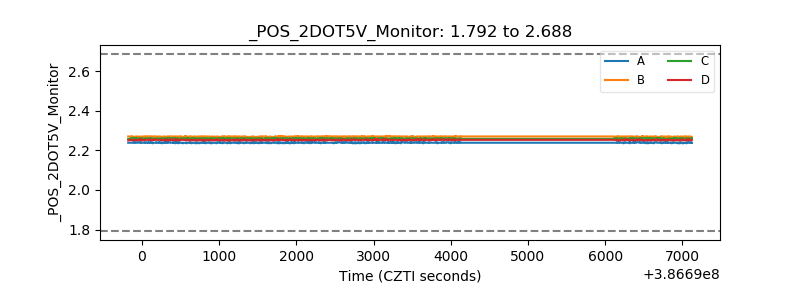 |
| +5 Volts monitor |  |
| _ROLL_ROT | 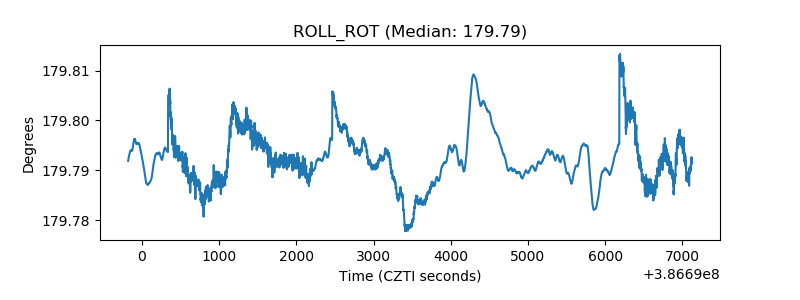 |
| _Roll_DEC | 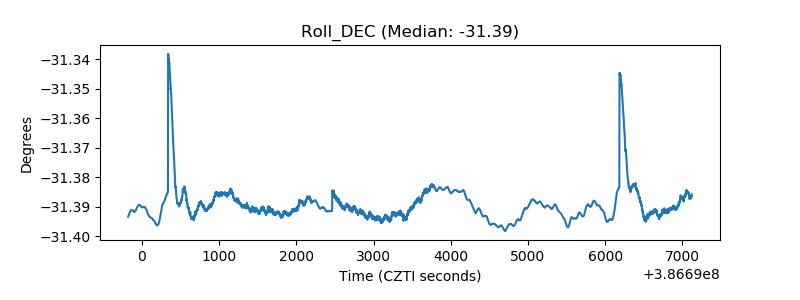 |
| _Roll_RA | 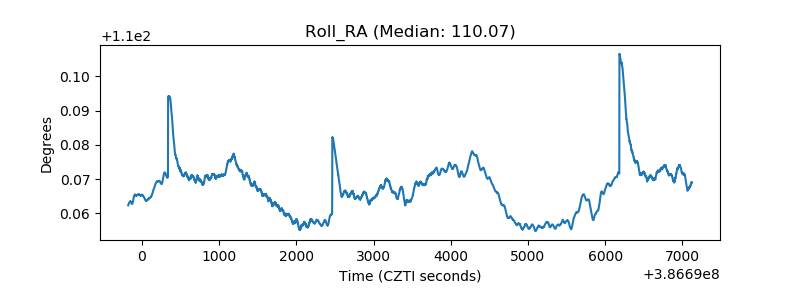 |
| Veto Counter | 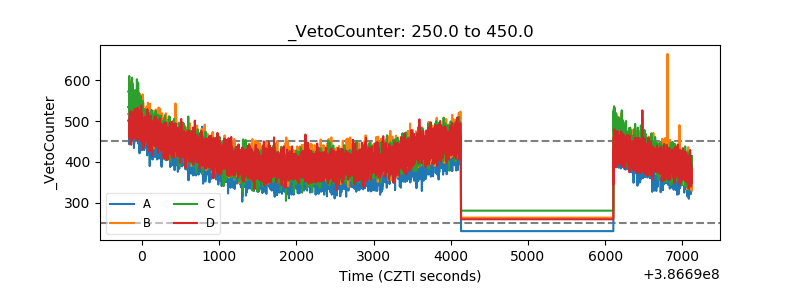 |