| Param | Original file | Final file |
|---|---|---|
| Filename | modeM0/AS1C07_004T01_9000005052_35217cztM0_level2.evt | modeM0/AS1C07_004T01_9000005052_35217cztM0_level2_quad_clean.evt |
| Size (bytes) | 665,366,400 | 83,102,400 |
| Size | 634.5 MB | 79.3 MB |
| Events in quadrant A | 2,979,279 | 567,194 |
| Events in quadrant B | 7,571,153 | 485,421 |
| Events in quadrant C | 3,331,581 | 574,126 |
| Events in quadrant D | 5,921,534 | 528,391 |
| Mode M0 | |||
|---|---|---|---|
| Quadrant | BADHDUFLAG | Total packets | Discarded packets |
| A | 0 | 11988 | 3 |
| B | 0 | 26109 | 2 |
| C | 0 | 13242 | 2 |
| D | 0 | 21238 | 2 |
| Mode SS | |||
|---|---|---|---|
| Quadrant | BADHDUFLAG | Total packets | Discarded packets |
| A | 0 | 104 | 0 |
| B | 0 | 104 | 0 |
| C | 0 | 104 | 0 |
| D | 0 | 104 | 0 |
| Mode M9 | |||
|---|---|---|---|
| Quadrant | BADHDUFLAG | Total packets | Discarded packets |
| A | 0 | 33 | 0 |
| B | 0 | 33 | 0 |
| C | 0 | 33 | 0 |
| D | 0 | 34 | 0 |
| Quadrant | Total seconds | Saturated seconds | Saturation percentage |
|---|---|---|---|
| A | 5151 | 74 | 1.436614% |
| B | 5151 | 1997 | 38.769171% |
| C | 5151 | 151 | 2.931470% |
| D | 5151 | 274 | 5.319355% |
Noise dominated data is calculated using 1-second bins in cleaned event files. If a bin has >2000 counts, and if more than 50% of those come from <1% of pixels, then it is considered to be noise-dominated and hence unusable.
| Quadrant | # 1 sec bins | Bins with >0 counts | Bins with >2000 counts | High rate bins dominated by noise | Noise dominated (total time) | Noise dominated (detector-on time) | Marked lightcurve |
|---|---|---|---|---|---|---|---|
| A | 7123 | 5152 | 49 | 49 | 0.69% | 0.95% | 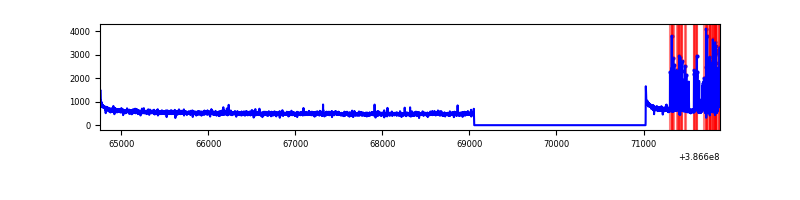 |
| B | 7123 | 5152 | 1296 | 1296 | 18.19% | 25.16% | 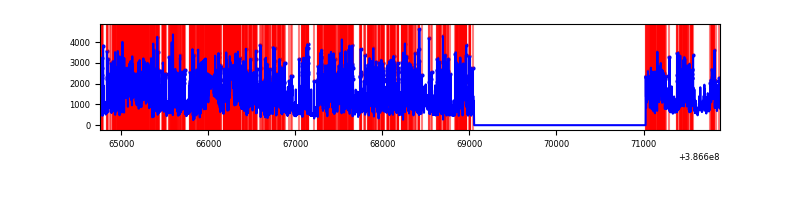 |
| C | 7123 | 5152 | 105 | 105 | 1.47% | 2.04% | 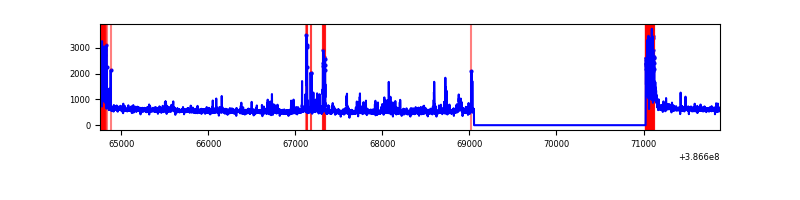 |
| D | 7123 | 5152 | 200 | 200 | 2.81% | 3.88% | 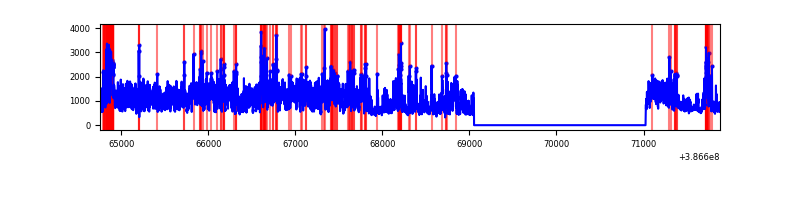 |
Top three noisy pixels from each quadrant. If the there are fewer than three noisy pixels in the level2.evt file, extra rows are filled as -1
| Pixel properties | Quadrant properties | ||||||
|---|---|---|---|---|---|---|---|
| Quadrant | DetID | PixID | Counts | Sigma | Mean | Median | Sigma |
| A | 15 | 174 | 241909 | 1806.13 | 674 | 664 | 133.6 |
| A | 10 | 83 | 98494 | 732.43 | 674 | 664 | 133.6 |
| A | 13 | 6 | 17432 | 125.54 | 674 | 664 | 133.6 |
| B | 5 | 236 | 5030204 | 47500.26 | 558 | 545 | 105.9 |
| B | 5 | 172 | 175269 | 1650.1 | 558 | 545 | 105.9 |
| B | 4 | 232 | 125533 | 1180.39 | 558 | 545 | 105.9 |
| C | 0 | 10 | 314597 | 2117.33 | 648 | 655 | 148.3 |
| C | 15 | 214 | 218267 | 1467.65 | 648 | 655 | 148.3 |
| C | 0 | 207 | 143730 | 964.94 | 648 | 655 | 148.3 |
| D | 8 | 195 | 2794928 | 18088.04 | 645 | 630 | 154.5 |
| D | 2 | 250 | 249907 | 1613.62 | 645 | 630 | 154.5 |
| D | 10 | 118 | 87362 | 561.43 | 645 | 630 | 154.5 |
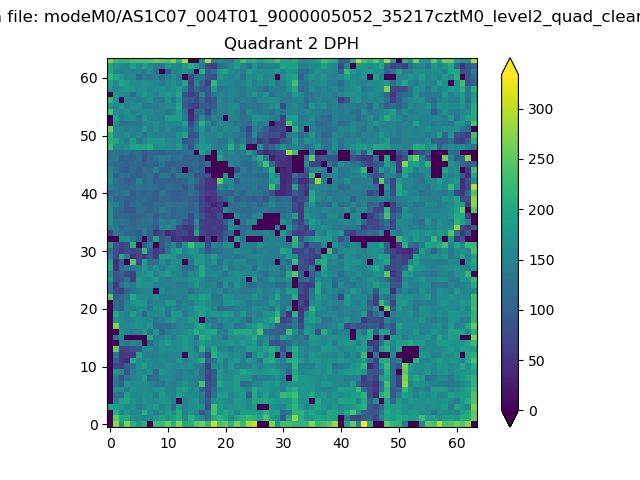
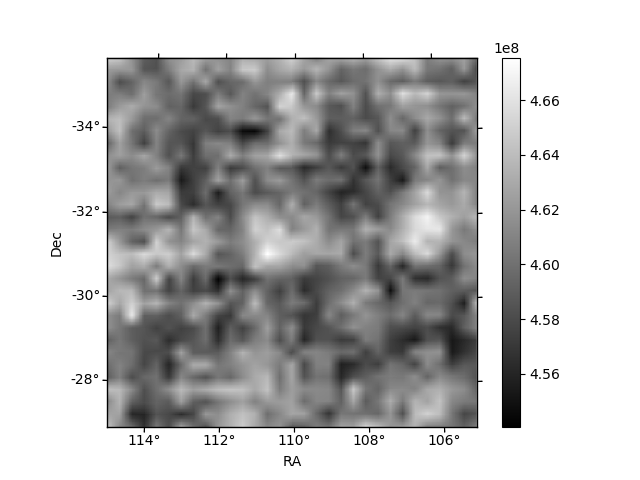
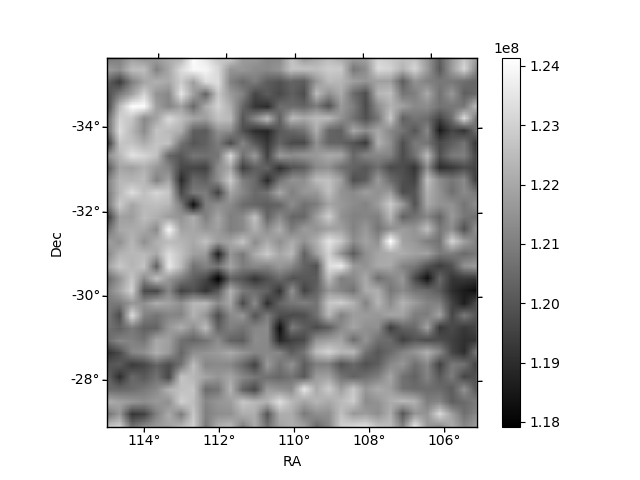
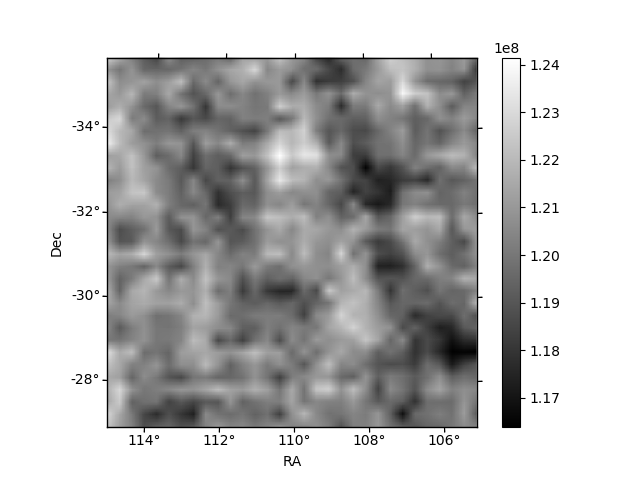
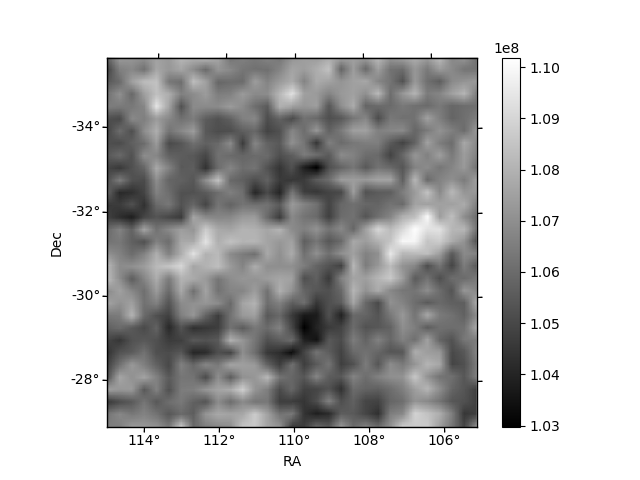
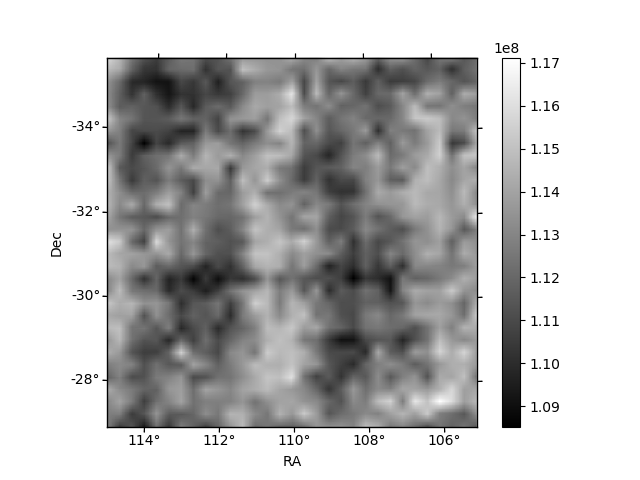
Histogram calculated using DETX and DETY for each event in the final _common_clean file
| Quadrant A | 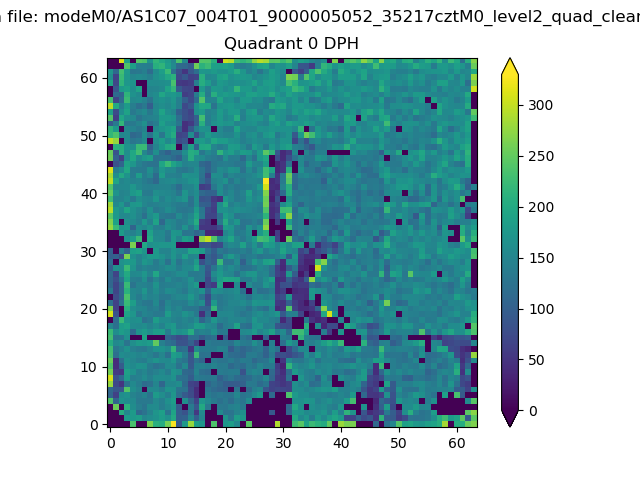 |
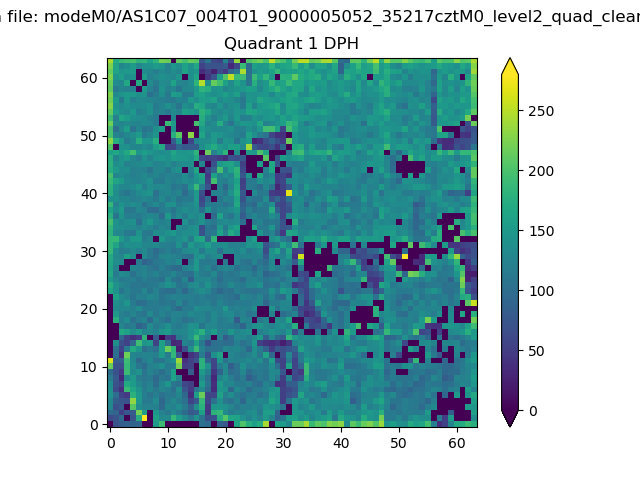 |
Quadrant B |
|---|---|---|---|
| Quadrant D | 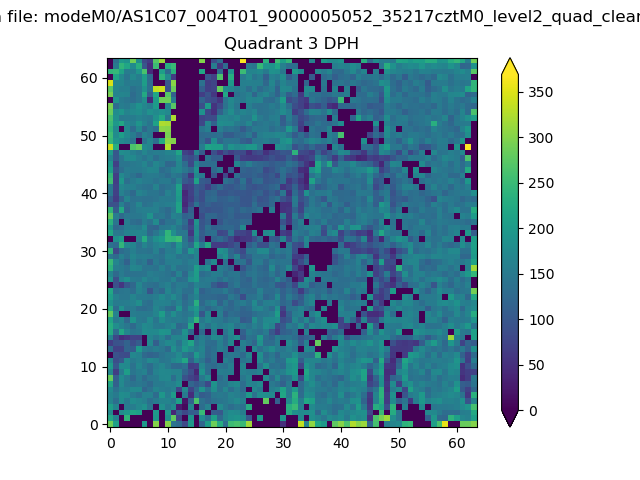 |
 |
Quadrant C |
| Plot type | Count rate plots | Images |
|---|---|---|
| Comparison with Poisson distribution Blue bars denote a histogram of data divided into 1 sec bins. Red curve is a Poisson curve with rate = median count rate of data. |
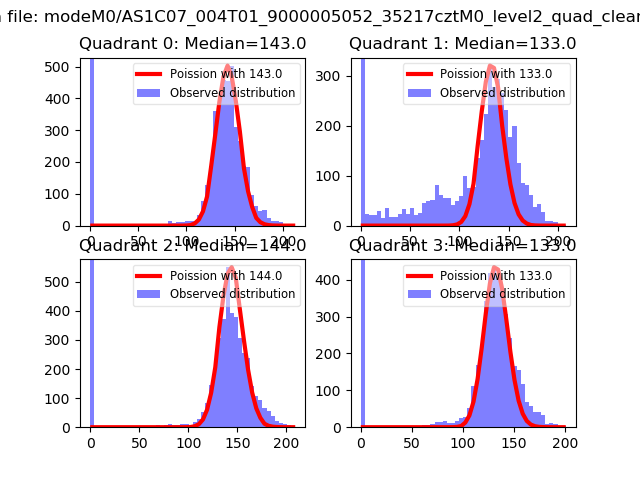 |
 |
| Quadrant-wise count rates Data is divided into 100 sec bins |
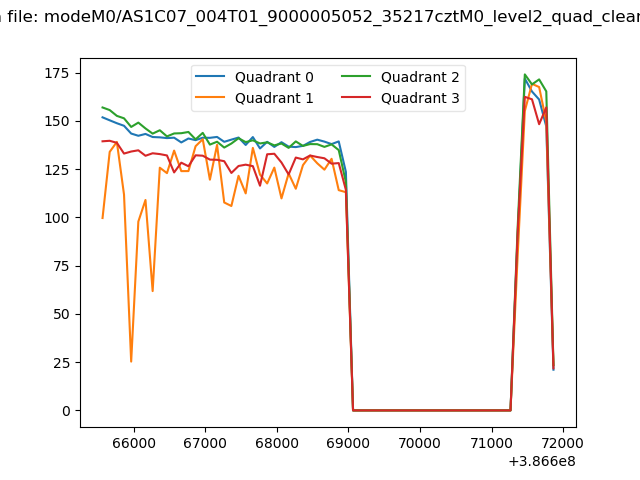 |
|
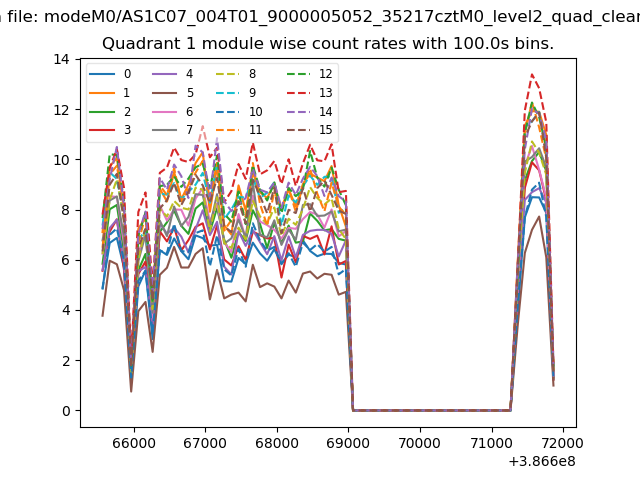
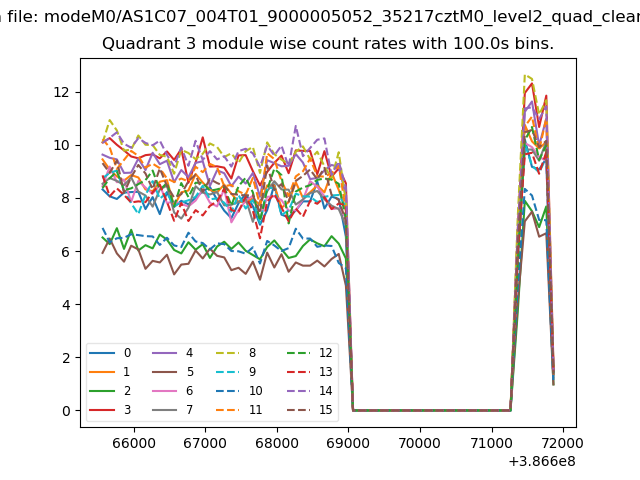
| Module-wise count rates for Quadrant A Data is divided into 100 sec bins |
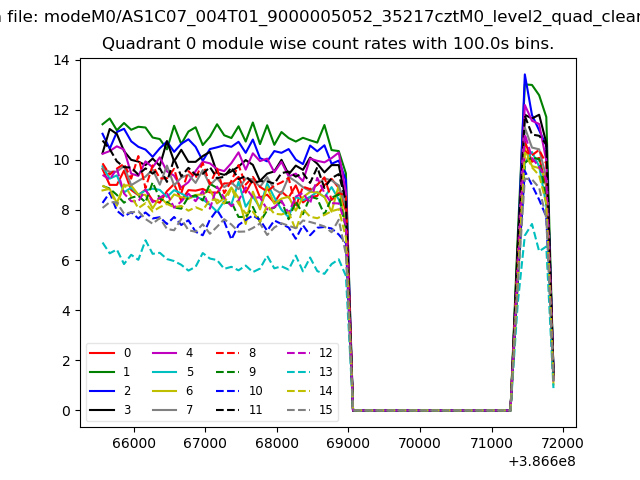 |
 |
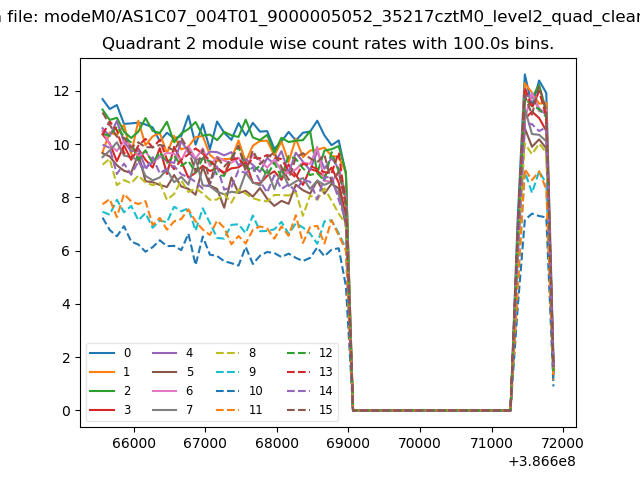
| Module-wise count rates for Quadrant B Data is divided into 100 sec bins |
 |
 |
| Module-wise count rates for Quadrant C Data is divided into 100 sec bins |
 |
 |
| Module-wise count rates for Quadrant D Data is divided into 100 sec bins |
 |
 |
| Parameter | Plot |
|---|---|
| CZT HV Monitor | 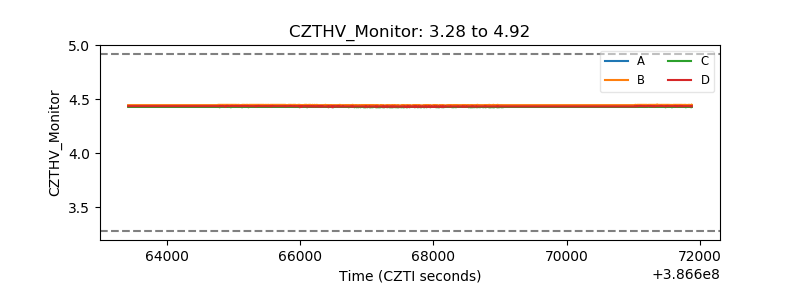 |
| D_VDD | 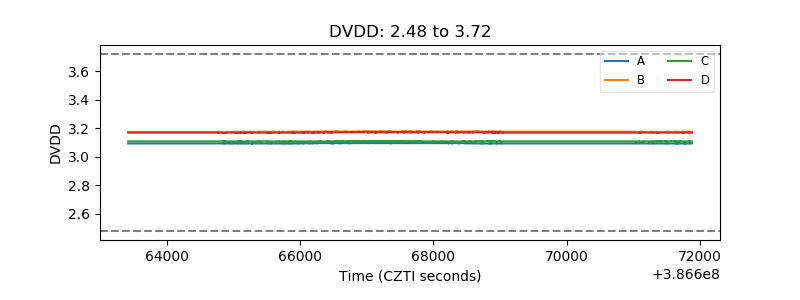 |
| Temperature 1 | 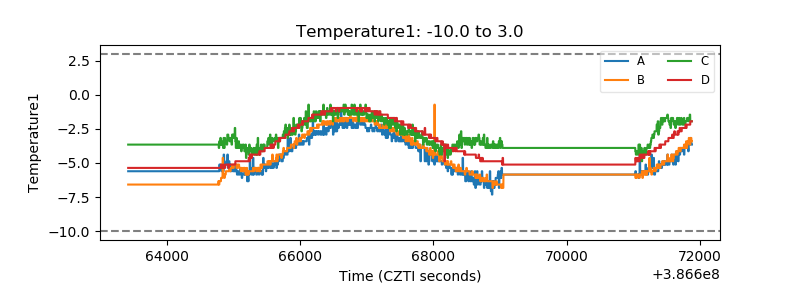 |
| Veto HV Monitor | 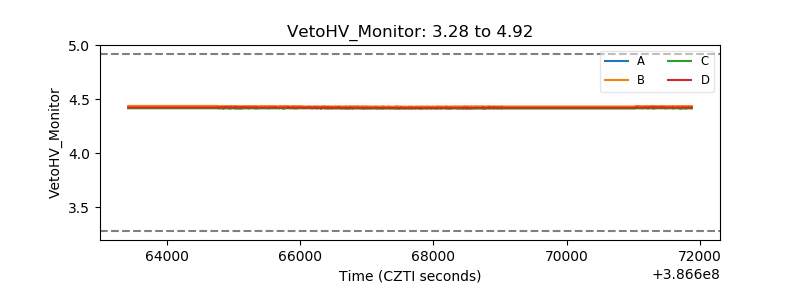 |
| Veto LLD | 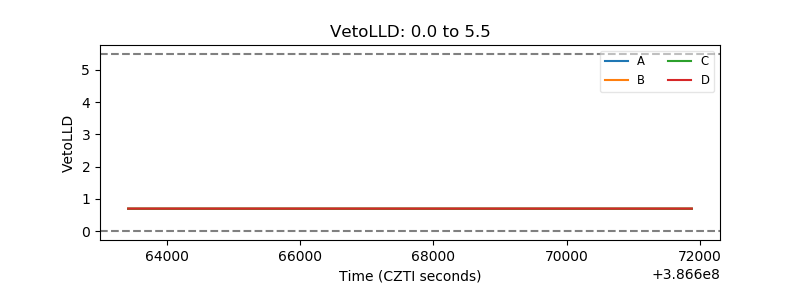 |
| Alpha Counter | 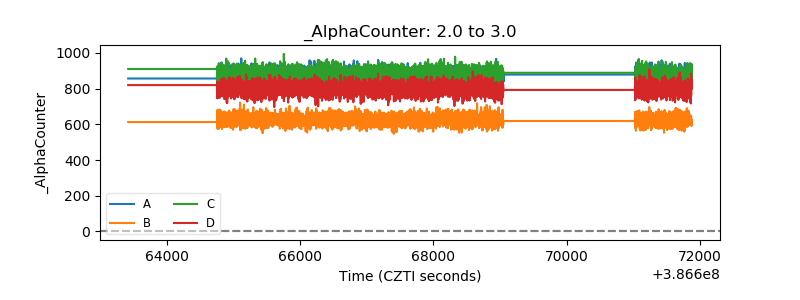 |
| _CPM_Rate | 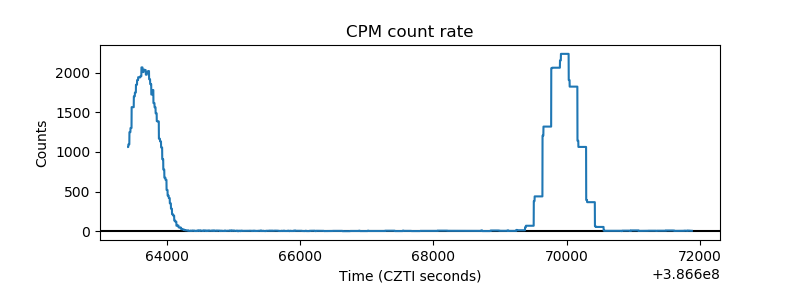 |
| CZT Counter | 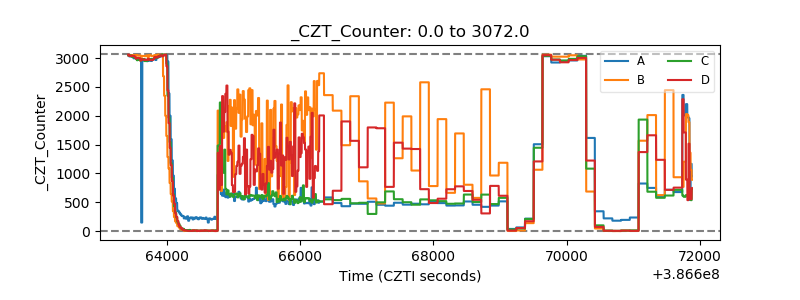 |
| +2.5 Volts monitor | 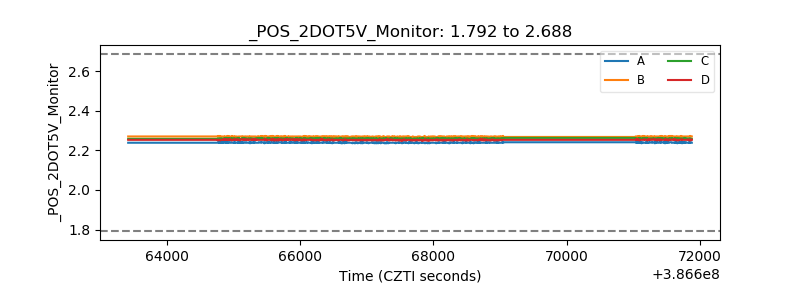 |
| +5 Volts monitor | 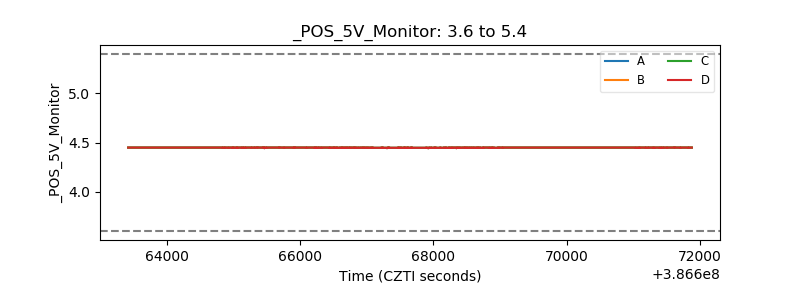 |
| _ROLL_ROT | 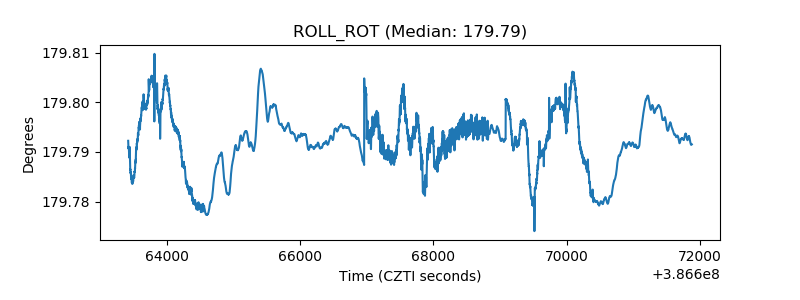 |
| _Roll_DEC | 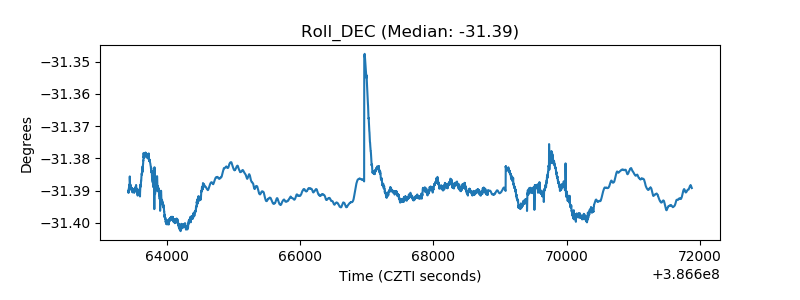 |
| _Roll_RA | 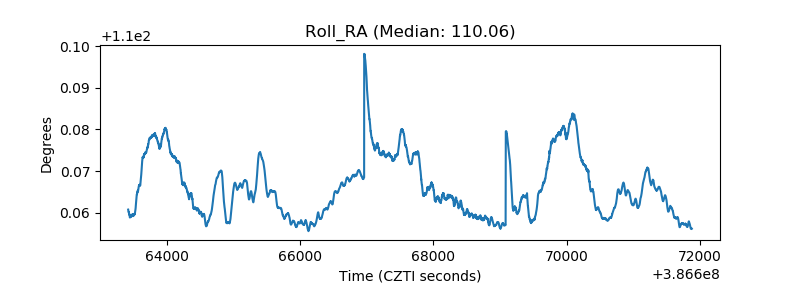 |
| Veto Counter | 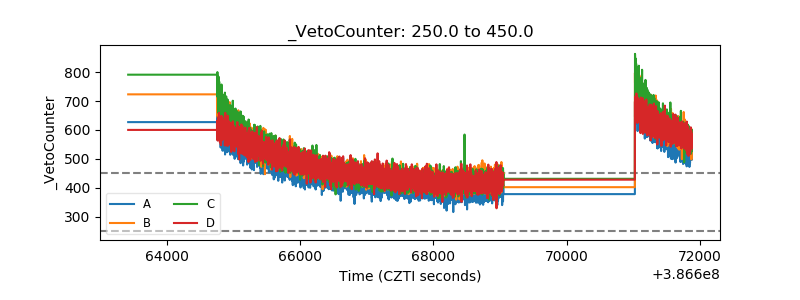 |