| Param | Original file | Final file |
|---|---|---|
| Filename | modeM0/AS1C07_004T01_9000005052_35216cztM0_level2.evt | modeM0/AS1C07_004T01_9000005052_35216cztM0_level2_quad_clean.evt |
| Size (bytes) | 658,975,680 | 65,715,840 |
| Size | 628.4 MB | 62.7 MB |
| Events in quadrant A | 2,685,435 | 427,163 |
| Events in quadrant B | 8,112,416 | 361,282 |
| Events in quadrant C | 3,081,905 | 434,591 |
| Events in quadrant D | 5,720,701 | 396,321 |
| Mode M0 | |||
|---|---|---|---|
| Quadrant | BADHDUFLAG | Total packets | Discarded packets |
| A | 0 | 11182 | 3 |
| B | 0 | 27748 | 2 |
| C | 0 | 12387 | 2 |
| D | 0 | 20730 | 2 |
| Mode SS | |||
|---|---|---|---|
| Quadrant | BADHDUFLAG | Total packets | Discarded packets |
| A | 0 | 108 | 0 |
| B | 0 | 108 | 0 |
| C | 0 | 108 | 0 |
| D | 0 | 108 | 0 |
| Mode M9 | |||
|---|---|---|---|
| Quadrant | BADHDUFLAG | Total packets | Discarded packets |
| A | 0 | 36 | 0 |
| B | 0 | 36 | 0 |
| C | 0 | 36 | 0 |
| D | 0 | 36 | 0 |
| Quadrant | Total seconds | Saturated seconds | Saturation percentage |
|---|---|---|---|
| A | 5286 | 13 | 0.245933% |
| B | 5286 | 2342 | 44.305713% |
| C | 5286 | 74 | 1.399924% |
| D | 5286 | 321 | 6.072645% |
Noise dominated data is calculated using 1-second bins in cleaned event files. If a bin has >2000 counts, and if more than 50% of those come from <1% of pixels, then it is considered to be noise-dominated and hence unusable.
| Quadrant | # 1 sec bins | Bins with >0 counts | Bins with >2000 counts | High rate bins dominated by noise | Noise dominated (total time) | Noise dominated (detector-on time) | Marked lightcurve |
|---|---|---|---|---|---|---|---|
| A | 8843 | 5288 | 2 | 2 | 0.02% | 0.04% | 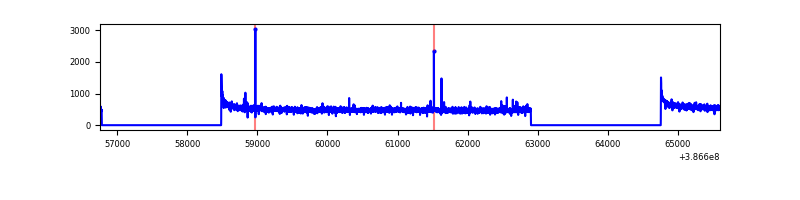 |
| B | 8842 | 5287 | 1654 | 1654 | 18.71% | 31.28% | 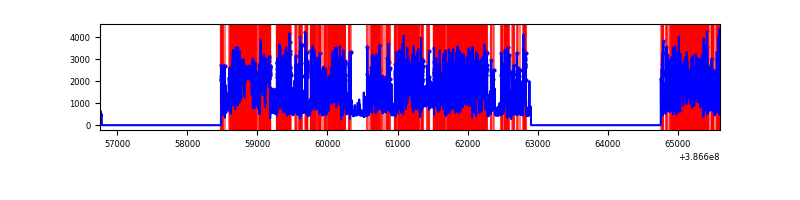 |
| C | 8843 | 5288 | 51 | 51 | 0.58% | 0.96% | 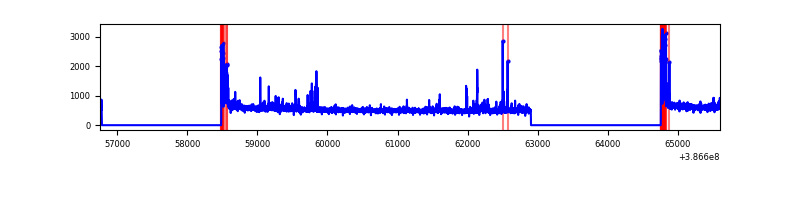 |
| D | 8843 | 5288 | 411 | 411 | 4.65% | 7.77% | 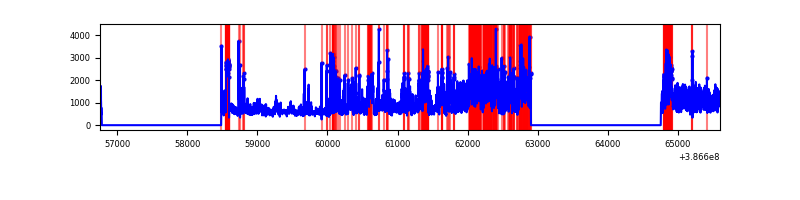 |
Top three noisy pixels from each quadrant. If the there are fewer than three noisy pixels in the level2.evt file, extra rows are filled as -1
| Pixel properties | Quadrant properties | ||||||
|---|---|---|---|---|---|---|---|
| Quadrant | DetID | PixID | Counts | Sigma | Mean | Median | Sigma |
| A | 10 | 83 | 101083 | 765.13 | 659 | 648 | 131.3 |
| A | 7 | 191 | 13436 | 97.42 | 659 | 648 | 131.3 |
| A | 13 | 6 | 12659 | 91.5 | 659 | 648 | 131.3 |
| B | 5 | 236 | 5837446 | 58585.08 | 522 | 511 | 99.6 |
| B | 4 | 232 | 139971 | 1399.75 | 522 | 511 | 99.6 |
| B | 5 | 172 | 53865 | 535.51 | 522 | 511 | 99.6 |
| C | 15 | 214 | 224644 | 1521.88 | 639 | 643 | 147.2 |
| C | 0 | 10 | 216117 | 1463.95 | 639 | 643 | 147.2 |
| C | 3 | 233 | 67590 | 454.84 | 639 | 643 | 147.2 |
| D | 8 | 195 | 2284060 | 15066.01 | 627 | 610 | 151.6 |
| D | 13 | 249 | 299982 | 1975.23 | 627 | 610 | 151.6 |
| D | 7 | 80 | 287291 | 1891.5 | 627 | 610 | 151.6 |
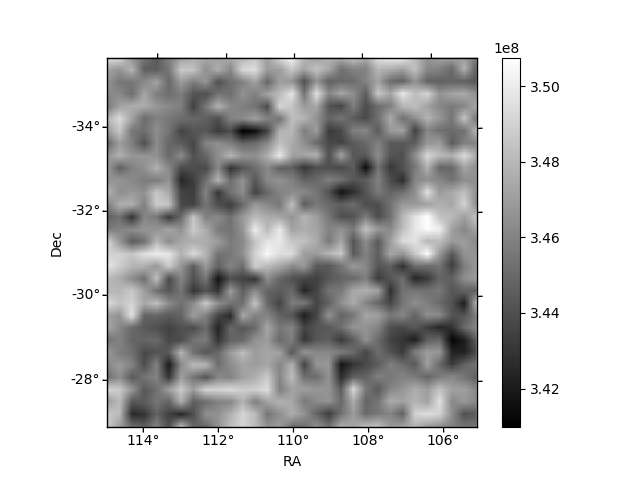
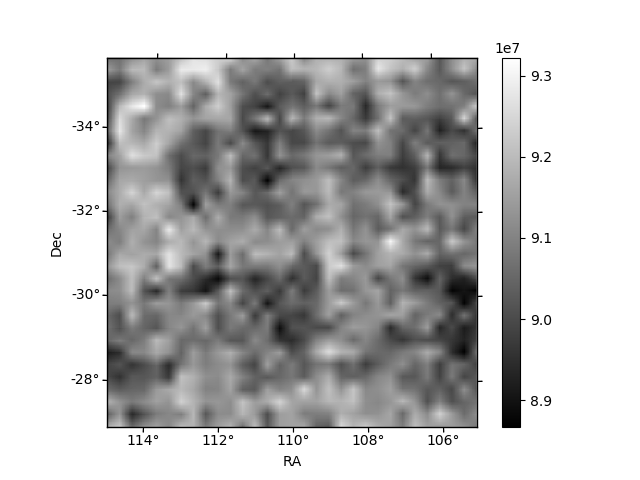
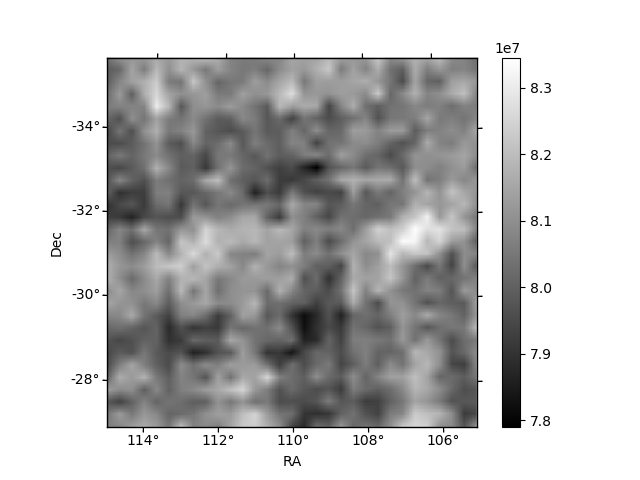
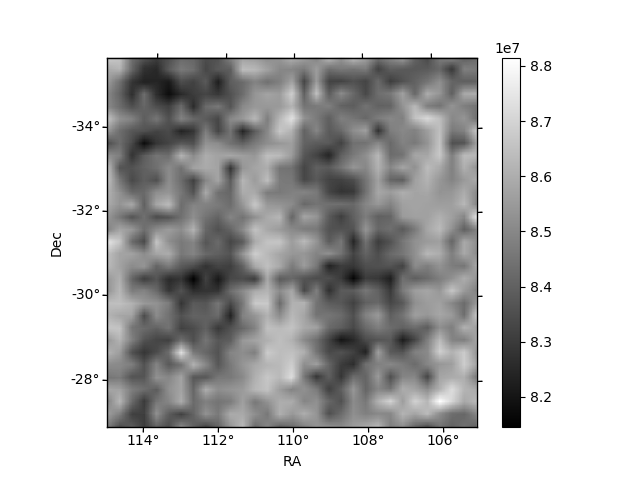
Histogram calculated using DETX and DETY for each event in the final _common_clean file
| Quadrant A | 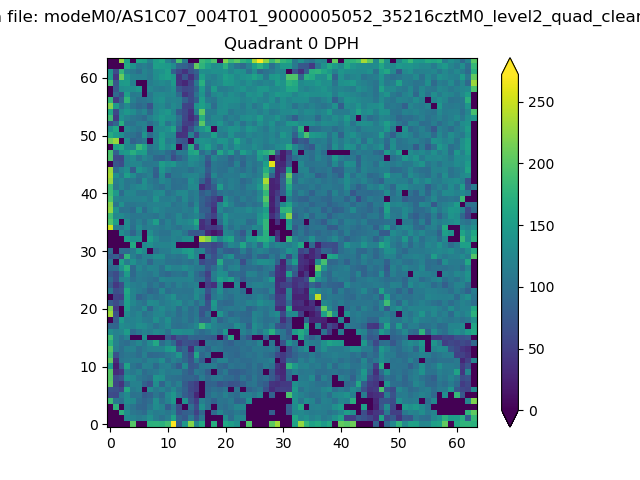 |
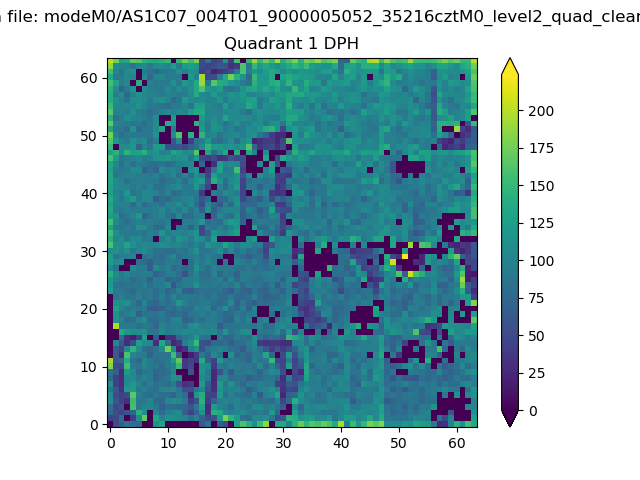 |
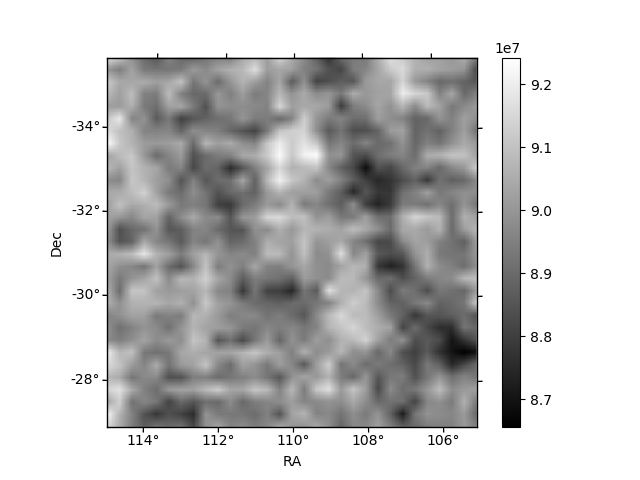
Quadrant B |
|---|---|---|---|
| Quadrant D | 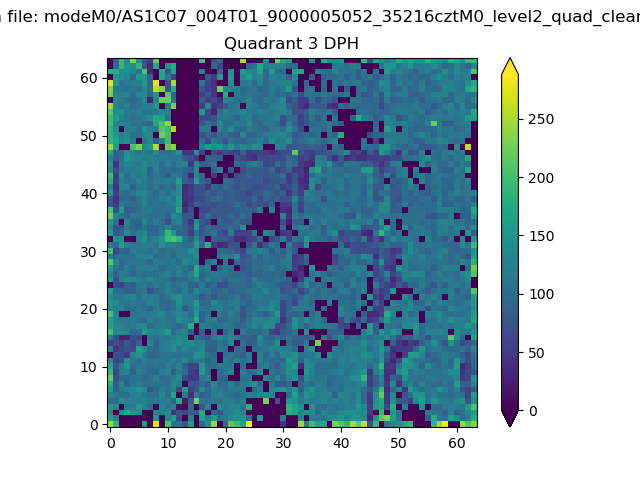 |
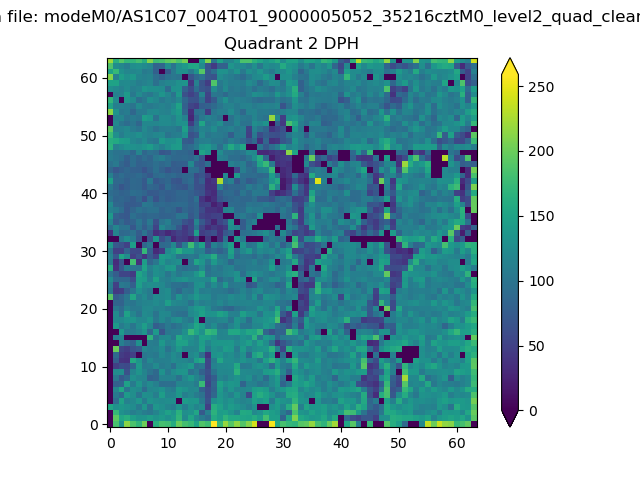 |
Quadrant C |
| Plot type | Count rate plots | Images |
|---|---|---|
| Comparison with Poisson distribution Blue bars denote a histogram of data divided into 1 sec bins. Red curve is a Poisson curve with rate = median count rate of data. |
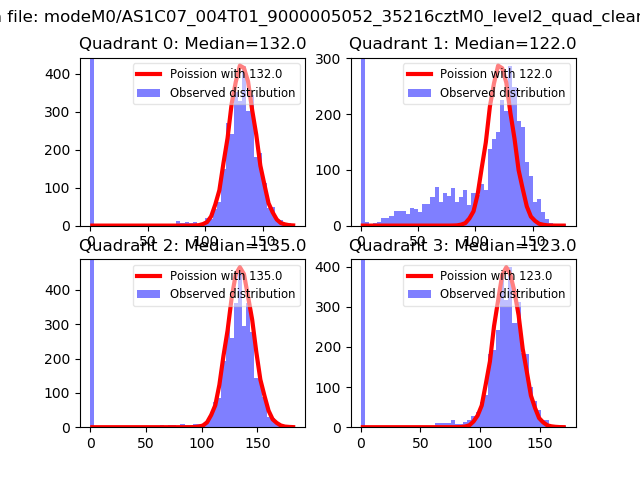 |
 |
| Quadrant-wise count rates Data is divided into 100 sec bins |
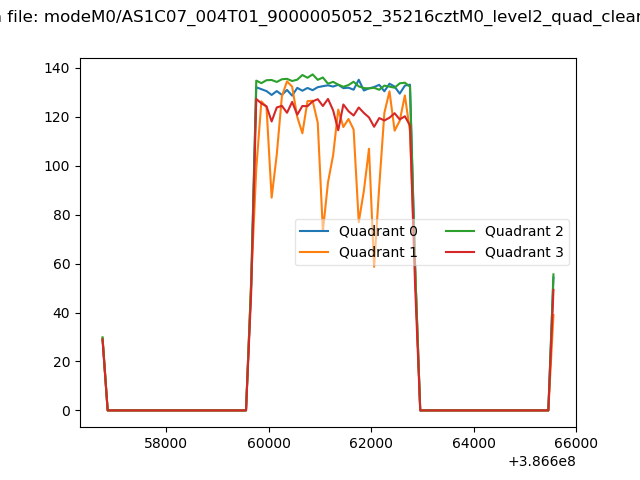 |
|
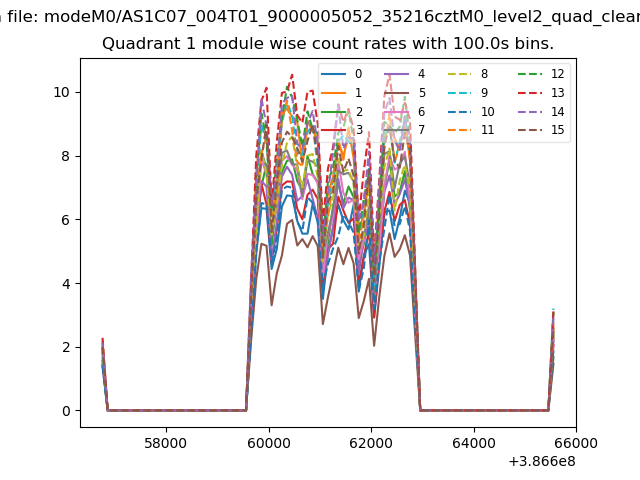
| Module-wise count rates for Quadrant A Data is divided into 100 sec bins |
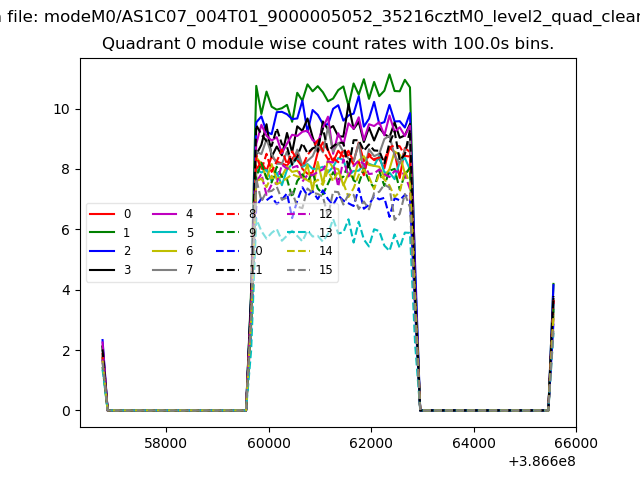 |
 |
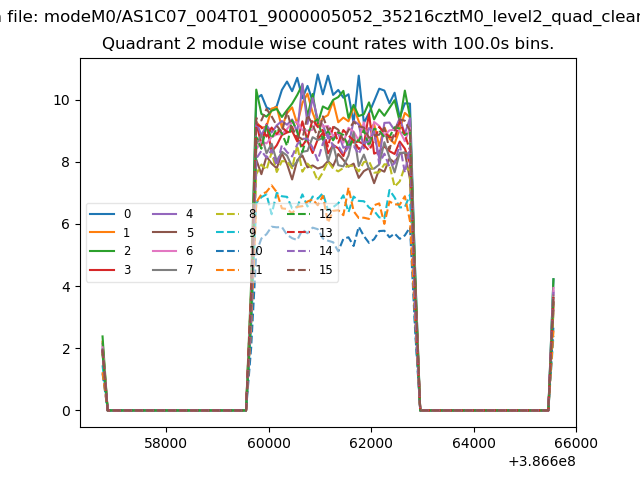
| Module-wise count rates for Quadrant B Data is divided into 100 sec bins |
 |
 |
| Module-wise count rates for Quadrant C Data is divided into 100 sec bins |
 |
 |
| Module-wise count rates for Quadrant D Data is divided into 100 sec bins |
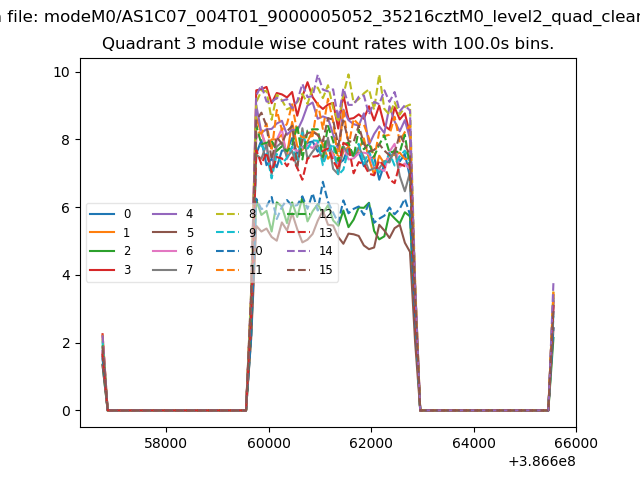 |
 |
| Parameter | Plot |
|---|---|
| CZT HV Monitor | 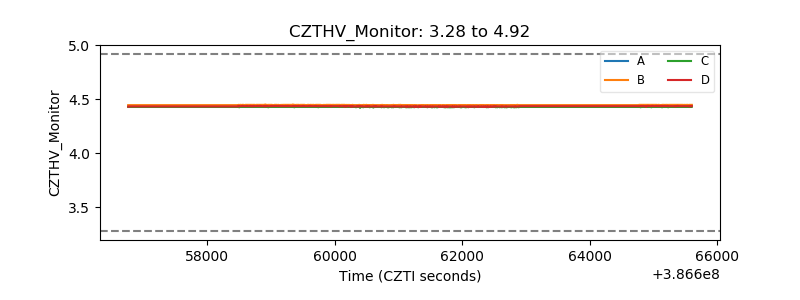 |
| D_VDD | 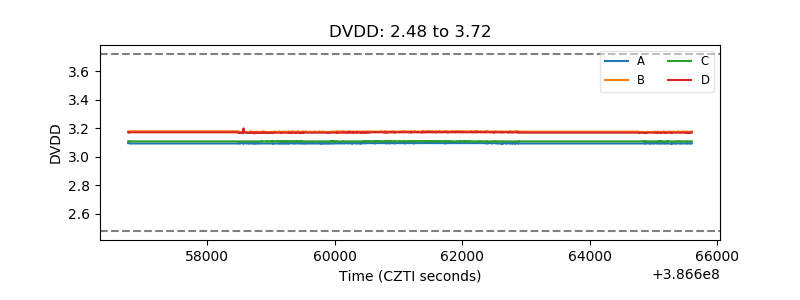 |
| Temperature 1 | 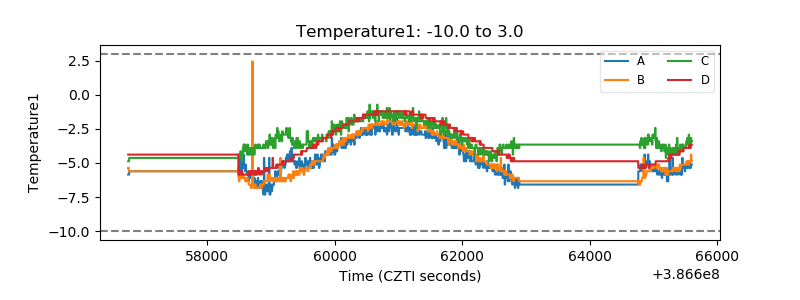 |
| Veto HV Monitor | 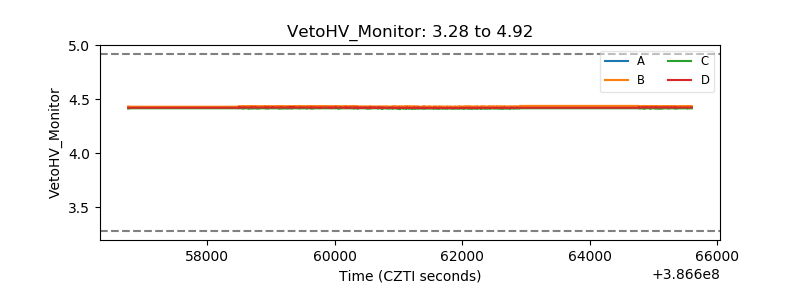 |
| Veto LLD | 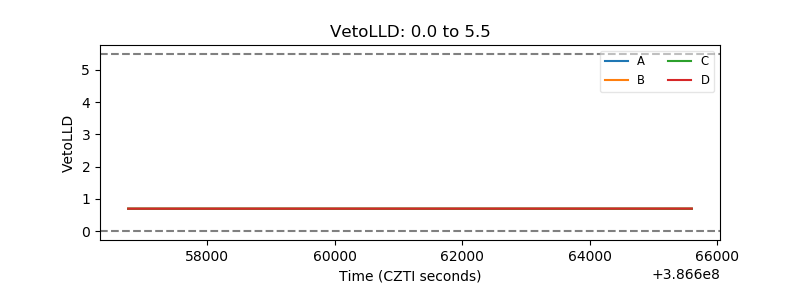 |
| Alpha Counter | 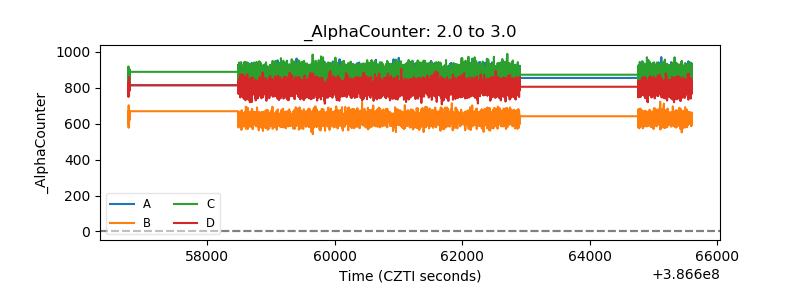 |
| _CPM_Rate | 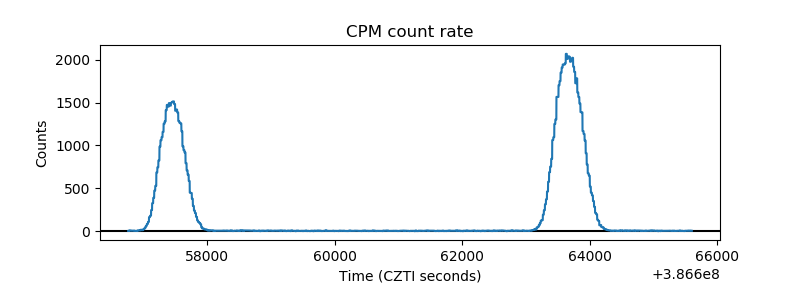 |
| CZT Counter | 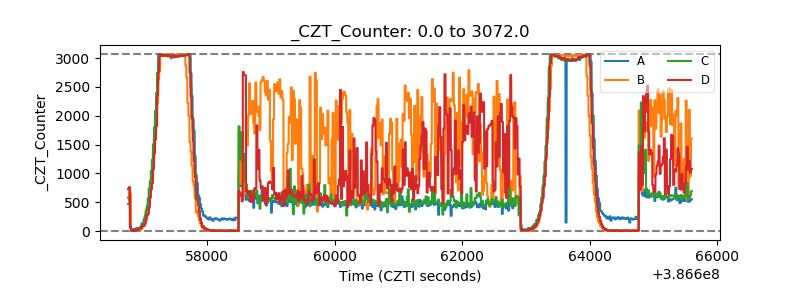 |
| +2.5 Volts monitor | 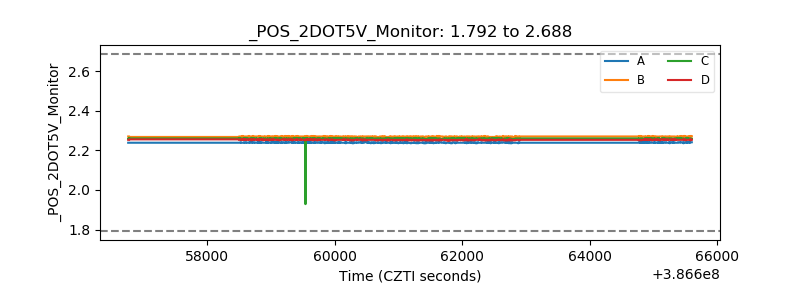 |
| +5 Volts monitor | 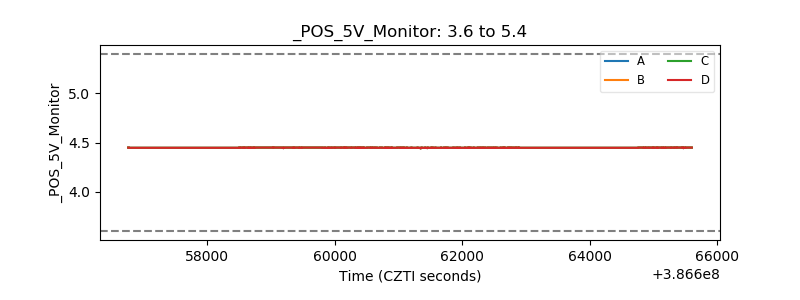 |
| _ROLL_ROT | 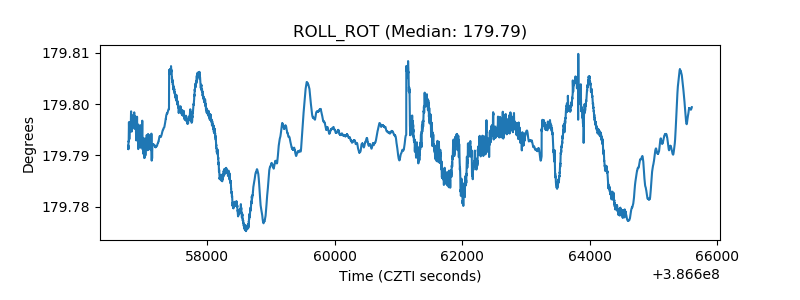 |
| _Roll_DEC | 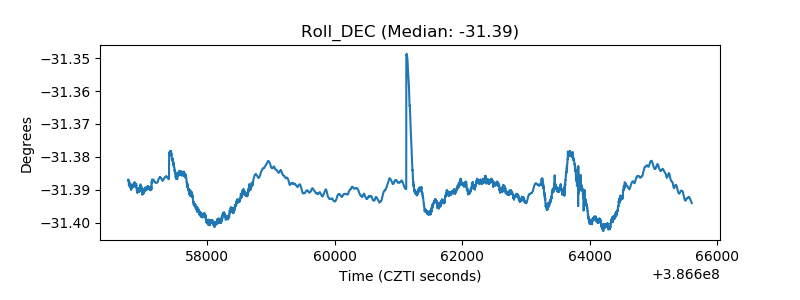 |
| _Roll_RA | 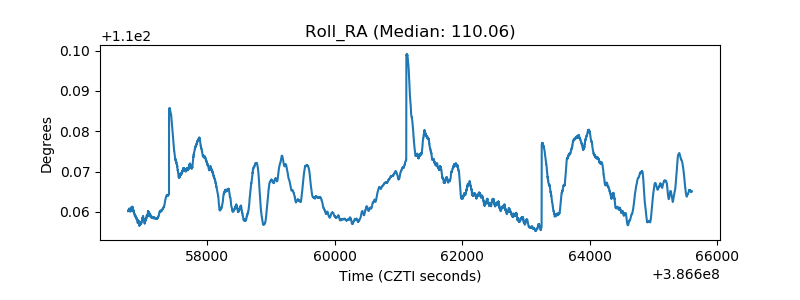 |
| Veto Counter | 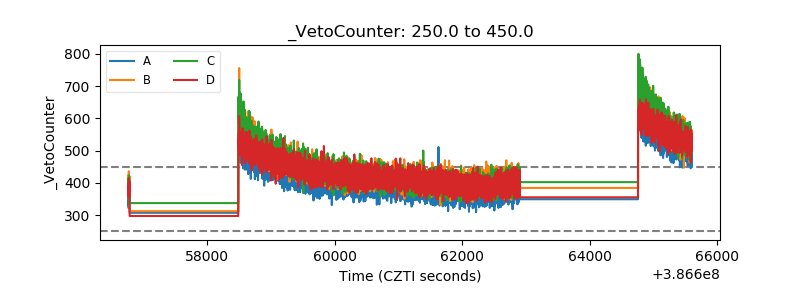 |