| Param | Original file | Final file |
|---|---|---|
| Filename | modeM0/AS1C07_004T01_9000005052_35213cztM0_level2.evt | modeM0/AS1C07_004T01_9000005052_35213cztM0_level2_quad_clean.evt |
| Size (bytes) | 673,447,680 | 53,703,360 |
| Size | 642.2 MB | 51.2 MB |
| Events in quadrant A | 2,688,755 | 326,997 |
| Events in quadrant B | 6,174,374 | 305,909 |
| Events in quadrant C | 3,168,880 | 331,472 |
| Events in quadrant D | 7,983,144 | 266,674 |
| Mode M0 | |||
|---|---|---|---|
| Quadrant | BADHDUFLAG | Total packets | Discarded packets |
| A | 0 | 11565 | 3 |
| B | 0 | 22134 | 2 |
| C | 0 | 12666 | 2 |
| D | 0 | 27671 | 2 |
| Mode SS | |||
|---|---|---|---|
| Quadrant | BADHDUFLAG | Total packets | Discarded packets |
| A | 0 | 116 | 0 |
| B | 0 | 116 | 0 |
| C | 0 | 116 | 0 |
| D | 0 | 116 | 0 |
| Mode M9 | |||
|---|---|---|---|
| Quadrant | BADHDUFLAG | Total packets | Discarded packets |
| A | 0 | 23 | 0 |
| B | 0 | 23 | 0 |
| C | 0 | 23 | 0 |
| D | 0 | 24 | 0 |
| Quadrant | Total seconds | Saturated seconds | Saturation percentage |
|---|---|---|---|
| A | 5629 | 10 | 0.177651% |
| B | 5629 | 1177 | 20.909575% |
| C | 5629 | 78 | 1.385681% |
| D | 5629 | 1146 | 20.358856% |
Noise dominated data is calculated using 1-second bins in cleaned event files. If a bin has >2000 counts, and if more than 50% of those come from <1% of pixels, then it is considered to be noise-dominated and hence unusable.
| Quadrant | # 1 sec bins | Bins with >0 counts | Bins with >2000 counts | High rate bins dominated by noise | Noise dominated (total time) | Noise dominated (detector-on time) | Marked lightcurve |
|---|---|---|---|---|---|---|---|
| A | 7212 | 5630 | 2 | 2 | 0.03% | 0.04% | 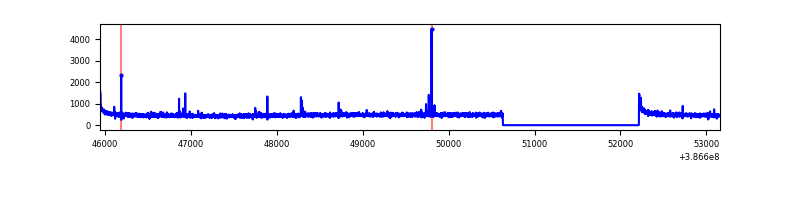 |
| B | 7212 | 5630 | 765 | 765 | 10.61% | 13.59% | 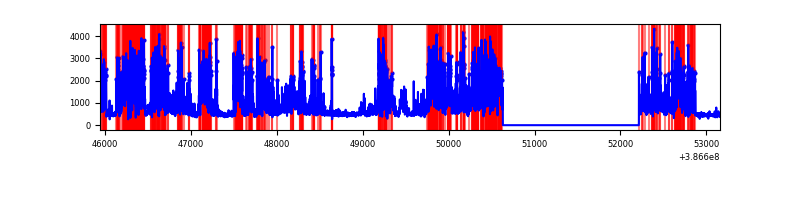 |
| C | 7212 | 5630 | 59 | 59 | 0.82% | 1.05% | 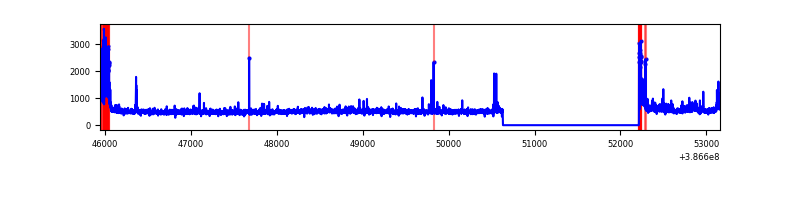 |
| D | 7212 | 5630 | 1083 | 1083 | 15.02% | 19.24% | 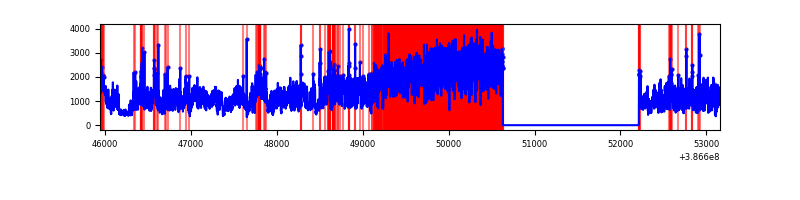 |
Top three noisy pixels from each quadrant. If the there are fewer than three noisy pixels in the level2.evt file, extra rows are filled as -1
| Pixel properties | Quadrant properties | ||||||
|---|---|---|---|---|---|---|---|
| Quadrant | DetID | PixID | Counts | Sigma | Mean | Median | Sigma |
| A | 10 | 83 | 100339 | 752.33 | 655 | 642 | 132.5 |
| A | 13 | 6 | 12503 | 89.5 | 655 | 642 | 132.5 |
| A | 7 | 191 | 12121 | 86.62 | 655 | 642 | 132.5 |
| B | 5 | 236 | 3605994 | 31262.92 | 603 | 589 | 115.3 |
| B | 4 | 232 | 101178 | 872.22 | 603 | 589 | 115.3 |
| B | 5 | 172 | 35335 | 301.29 | 603 | 589 | 115.3 |
| C | 0 | 10 | 293688 | 1989.58 | 635 | 638 | 147.3 |
| C | 15 | 214 | 238468 | 1614.68 | 635 | 638 | 147.3 |
| C | 1 | 23 | 47756 | 319.89 | 635 | 638 | 147.3 |
| D | 8 | 195 | 4080197 | 28003.02 | 600 | 582 | 145.7 |
| D | 5 | 223 | 963735 | 6611.21 | 600 | 582 | 145.7 |
| D | 2 | 250 | 175635 | 1201.59 | 600 | 582 | 145.7 |
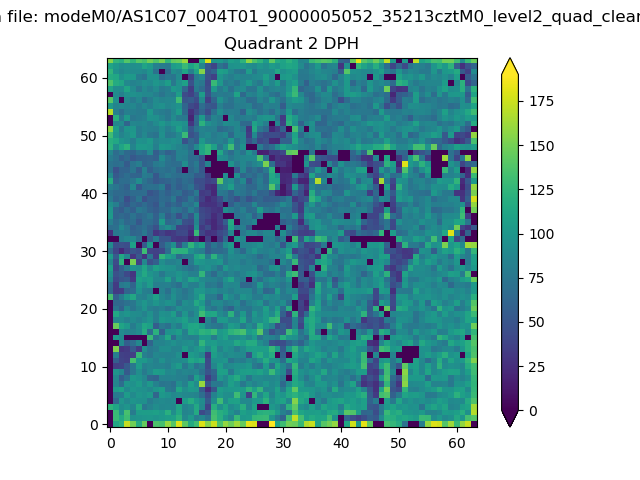
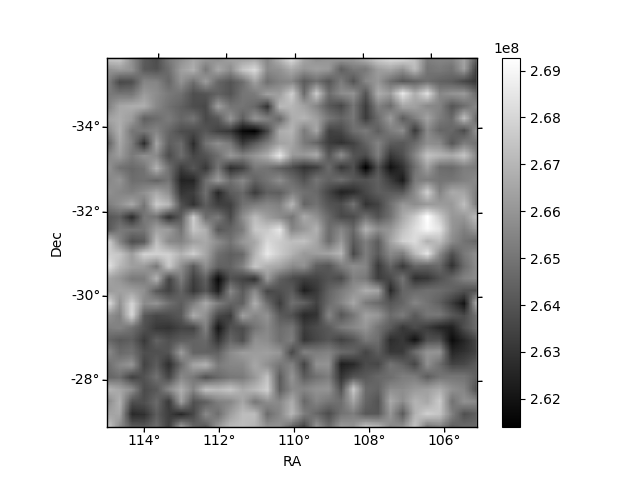
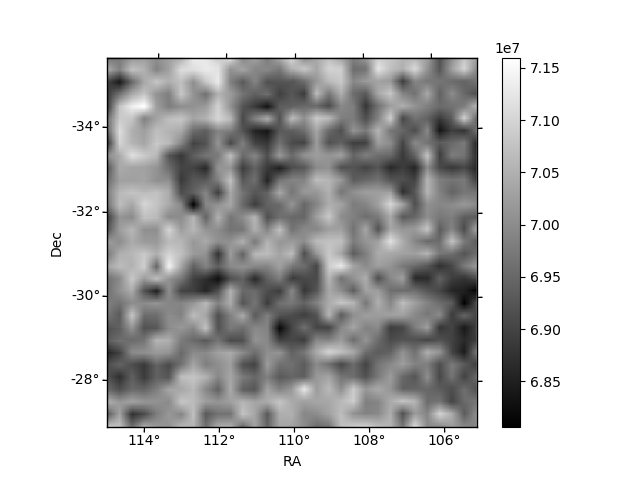
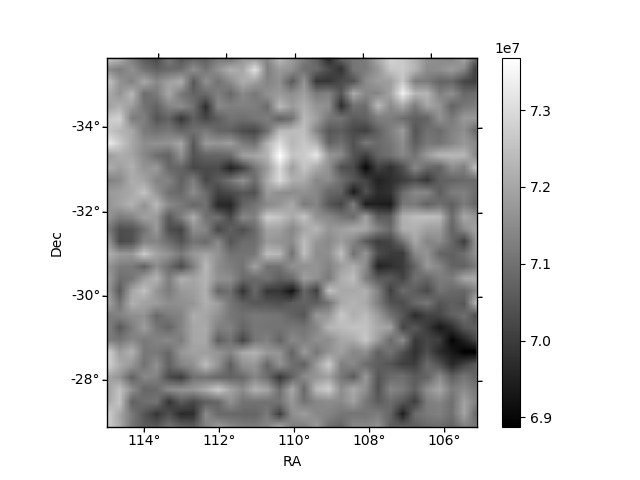
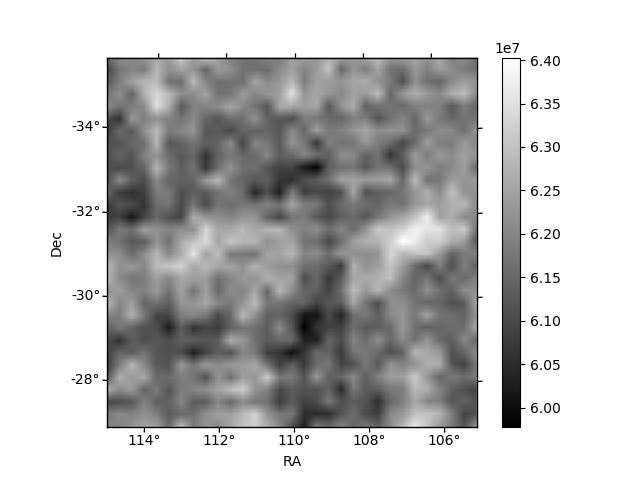
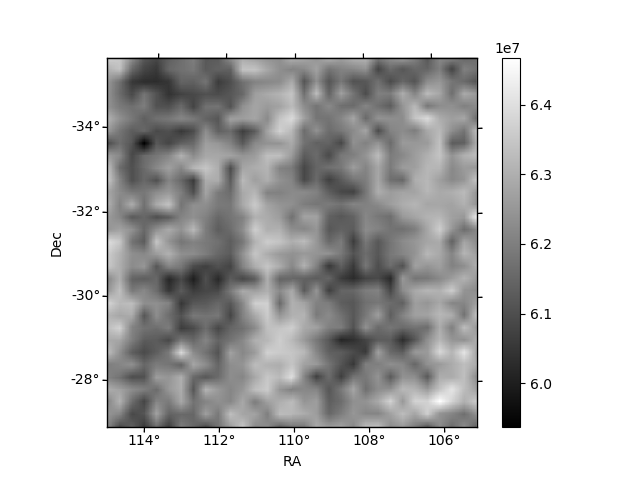
Histogram calculated using DETX and DETY for each event in the final _common_clean file
| Quadrant A | 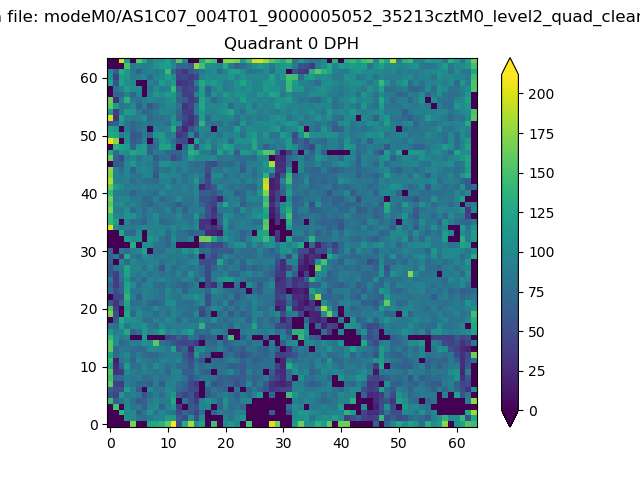 |
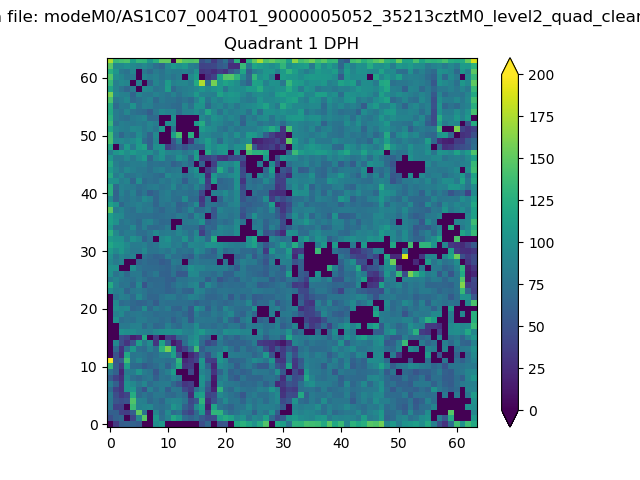 |
Quadrant B |
|---|---|---|---|
| Quadrant D | 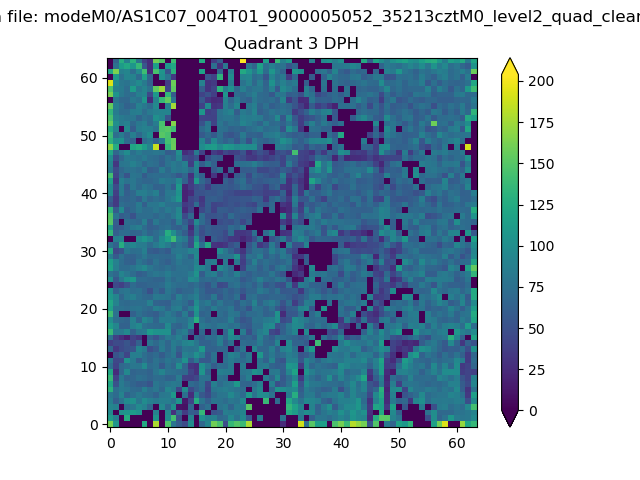 |
 |
Quadrant C |
| Plot type | Count rate plots | Images |
|---|---|---|
| Comparison with Poisson distribution Blue bars denote a histogram of data divided into 1 sec bins. Red curve is a Poisson curve with rate = median count rate of data. |
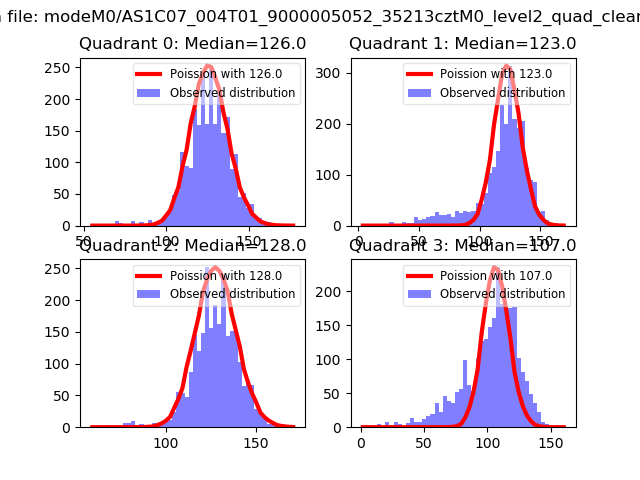 |
 |
| Quadrant-wise count rates Data is divided into 100 sec bins |
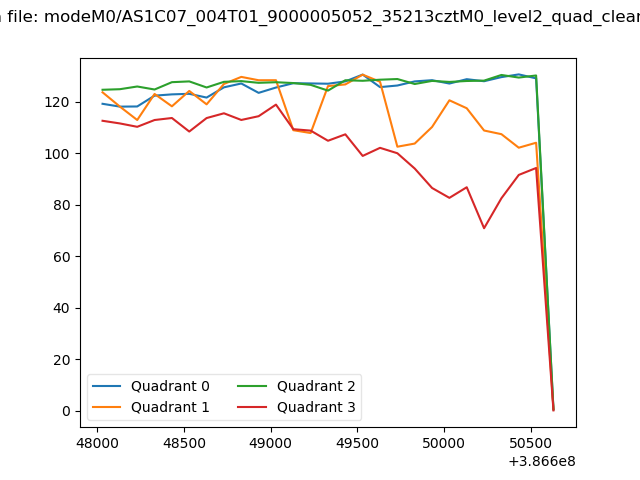 |
|
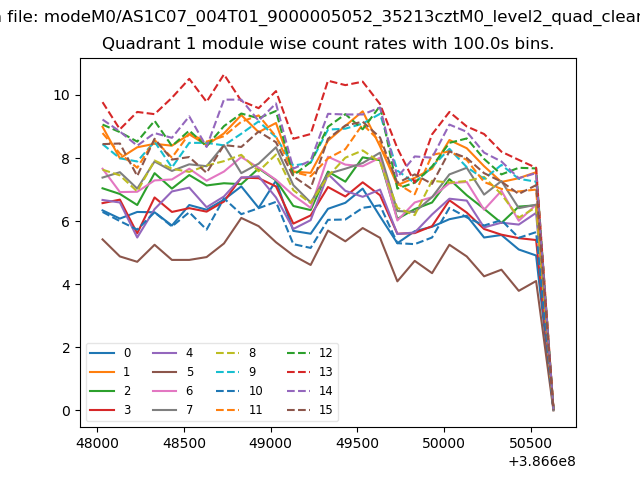
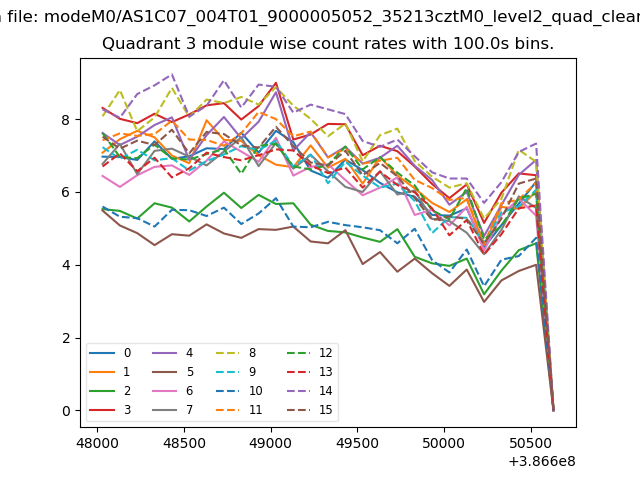
| Module-wise count rates for Quadrant A Data is divided into 100 sec bins |
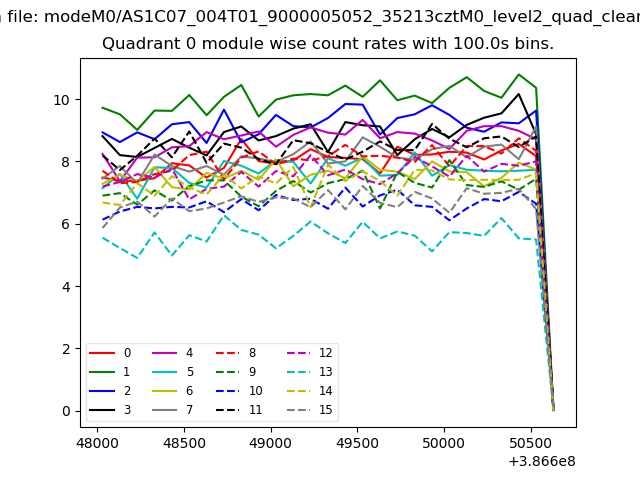 |
 |
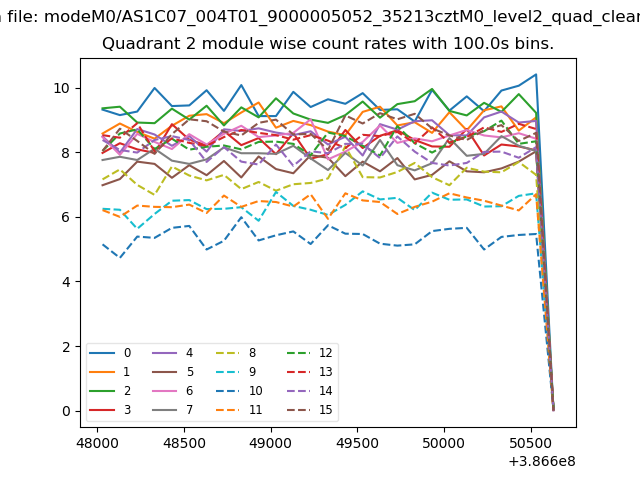
| Module-wise count rates for Quadrant B Data is divided into 100 sec bins |
 |
 |
| Module-wise count rates for Quadrant C Data is divided into 100 sec bins |
 |
 |
| Module-wise count rates for Quadrant D Data is divided into 100 sec bins |
 |
 |
| Parameter | Plot |
|---|---|
| CZT HV Monitor | 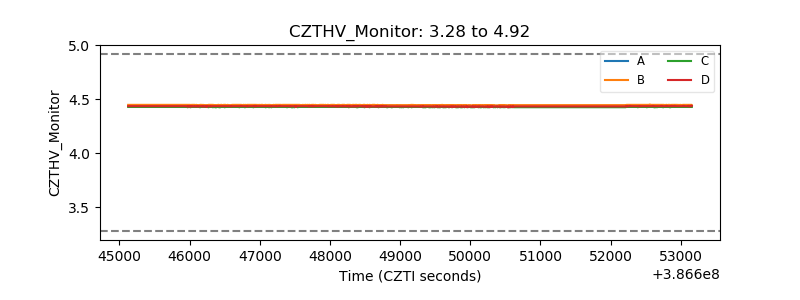 |
| D_VDD | 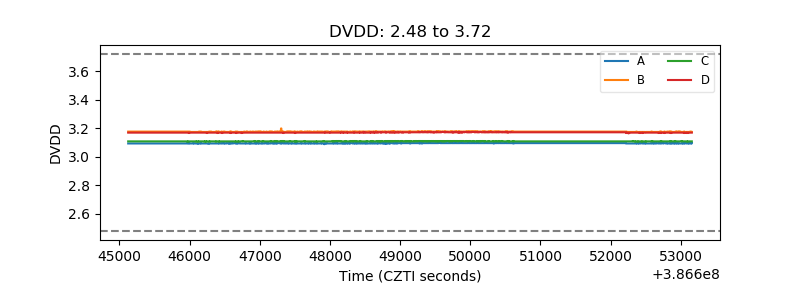 |
| Temperature 1 | 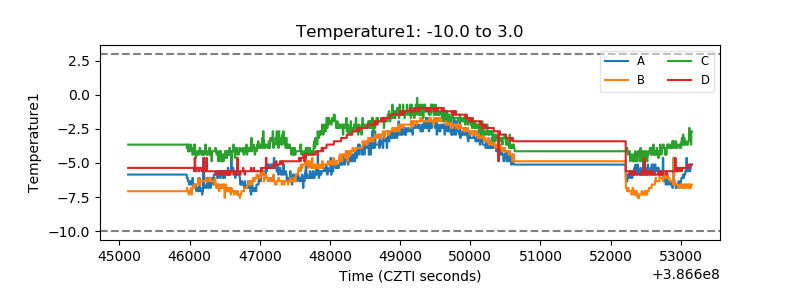 |
| Veto HV Monitor | 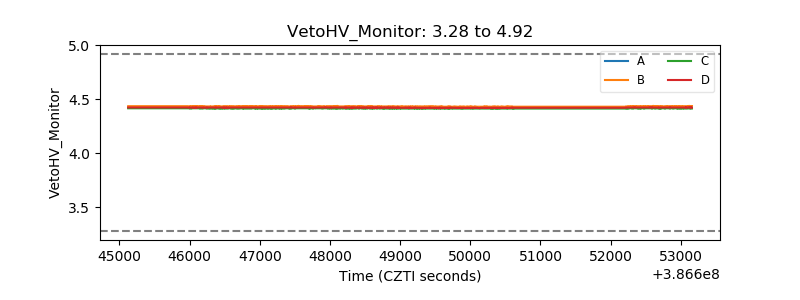 |
| Veto LLD | 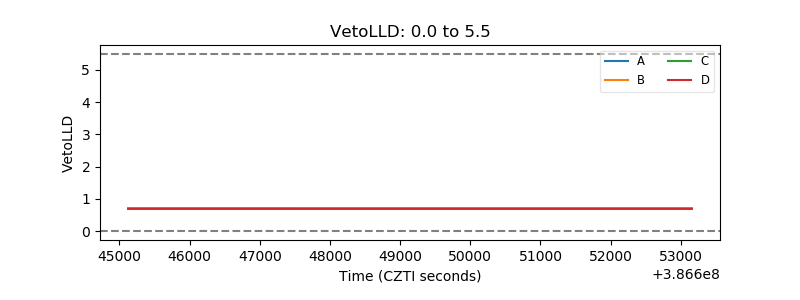 |
| Alpha Counter | 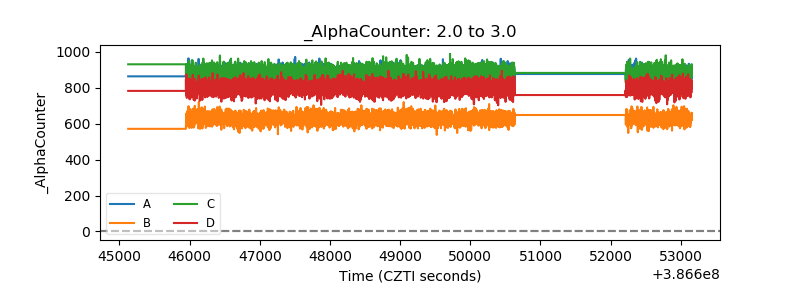 |
| _CPM_Rate | 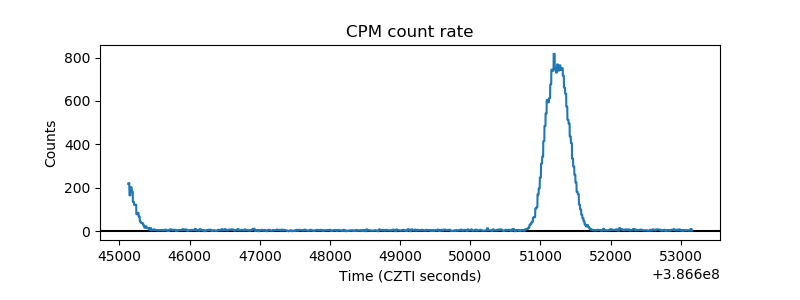 |
| CZT Counter | 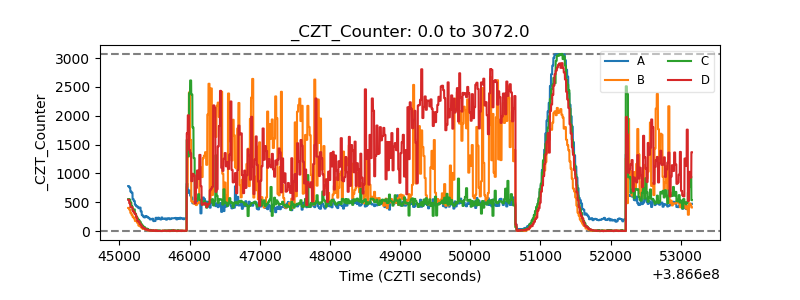 |
| +2.5 Volts monitor | 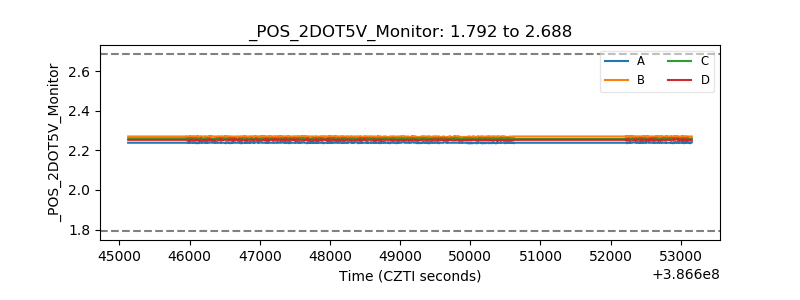 |
| +5 Volts monitor | 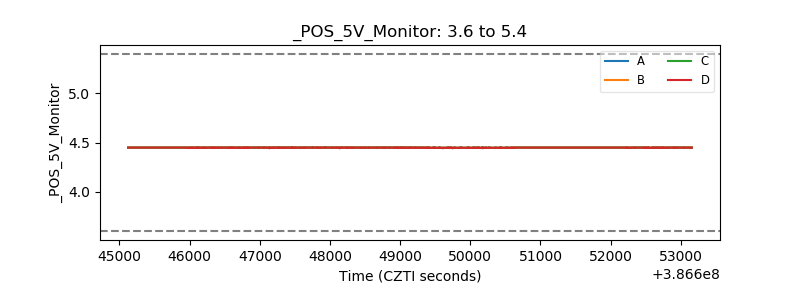 |
| _ROLL_ROT | 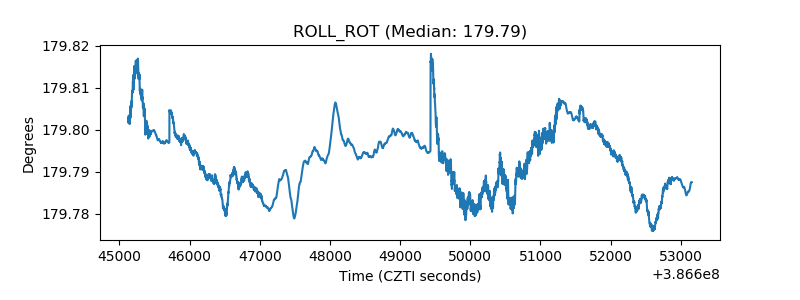 |
| _Roll_DEC | 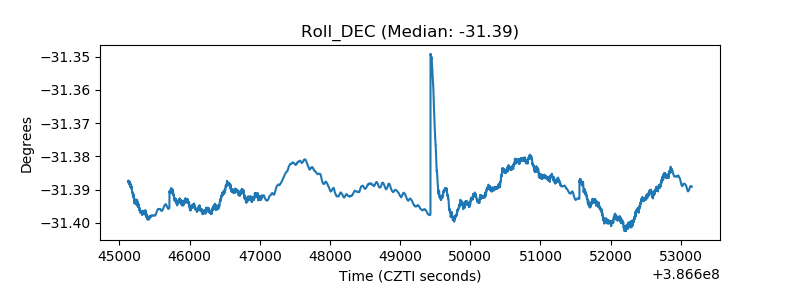 |
| _Roll_RA | 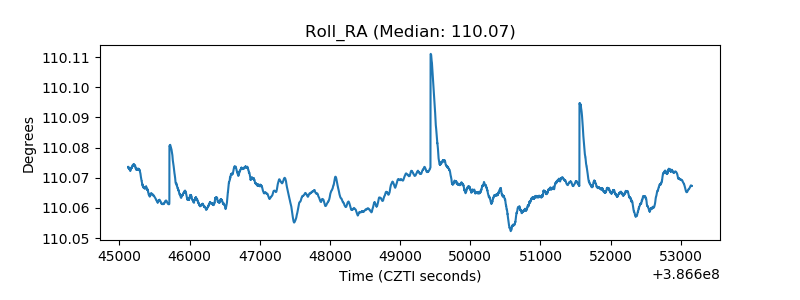 |
| Veto Counter | 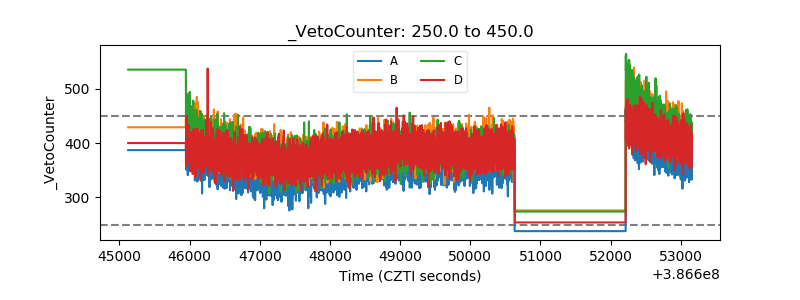 |