| Param | Original file | Final file |
|---|---|---|
| Filename | modeM0/AS1C07_004T01_9000005052_35210cztM0_level2.evt | modeM0/AS1C07_004T01_9000005052_35210cztM0_level2_quad_clean.evt |
| Size (bytes) | 621,149,760 | 72,832,320 |
| Size | 592.4 MB | 69.5 MB |
| Events in quadrant A | 2,897,731 | 466,345 |
| Events in quadrant B | 5,147,261 | 442,504 |
| Events in quadrant C | 3,192,992 | 461,151 |
| Events in quadrant D | 7,167,109 | 414,787 |
| Mode M0 | |||
|---|---|---|---|
| Quadrant | BADHDUFLAG | Total packets | Discarded packets |
| A | 0 | 12496 | 3 |
| B | 0 | 19398 | 2 |
| C | 0 | 13101 | 2 |
| D | 0 | 25510 | 2 |
| Mode SS | |||
|---|---|---|---|
| Quadrant | BADHDUFLAG | Total packets | Discarded packets |
| A | 0 | 122 | 0 |
| B | 0 | 122 | 0 |
| C | 0 | 122 | 0 |
| D | 0 | 122 | 0 |
| Mode M9 | |||
|---|---|---|---|
| Quadrant | BADHDUFLAG | Total packets | Discarded packets |
| A | 0 | 24 | 0 |
| B | 0 | 24 | 0 |
| C | 0 | 24 | 0 |
| D | 0 | 25 | 0 |
| Quadrant | Total seconds | Saturated seconds | Saturation percentage |
|---|---|---|---|
| A | 6015 | 15 | 0.249377% |
| B | 6015 | 705 | 11.720698% |
| C | 6015 | 83 | 1.379884% |
| D | 6015 | 506 | 8.412303% |
Noise dominated data is calculated using 1-second bins in cleaned event files. If a bin has >2000 counts, and if more than 50% of those come from <1% of pixels, then it is considered to be noise-dominated and hence unusable.
| Quadrant | # 1 sec bins | Bins with >0 counts | Bins with >2000 counts | High rate bins dominated by noise | Noise dominated (total time) | Noise dominated (detector-on time) | Marked lightcurve |
|---|---|---|---|---|---|---|---|
| A | 7299 | 6016 | 9 | 9 | 0.12% | 0.15% | 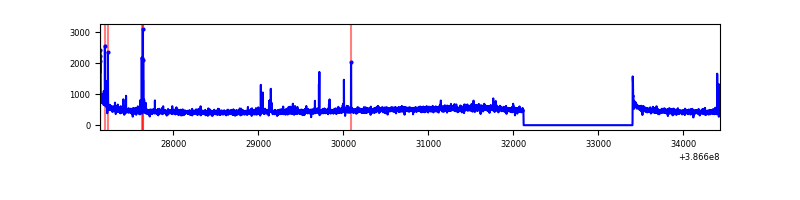 |
| B | 7299 | 6016 | 405 | 405 | 5.55% | 6.73% | 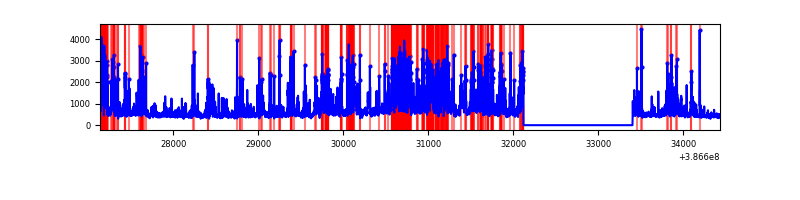 |
| C | 7299 | 6016 | 64 | 64 | 0.88% | 1.06% | 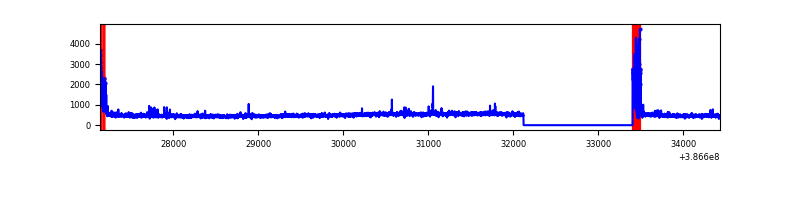 |
| D | 7299 | 6016 | 531 | 531 | 7.27% | 8.83% |  |
Top three noisy pixels from each quadrant. If the there are fewer than three noisy pixels in the level2.evt file, extra rows are filled as -1
| Pixel properties | Quadrant properties | ||||||
|---|---|---|---|---|---|---|---|
| Quadrant | DetID | PixID | Counts | Sigma | Mean | Median | Sigma |
| A | 10 | 83 | 104400 | 734.23 | 693 | 678 | 141.3 |
| A | 7 | 16 | 34270 | 237.79 | 693 | 678 | 141.3 |
| A | 13 | 6 | 26667 | 183.97 | 693 | 678 | 141.3 |
| B | 5 | 236 | 2279284 | 17956.86 | 662 | 648 | 126.9 |
| B | 4 | 232 | 143889 | 1128.81 | 662 | 648 | 126.9 |
| B | 15 | 85 | 32449 | 250.61 | 662 | 648 | 126.9 |
| C | 0 | 10 | 259525 | 1653.12 | 668 | 673 | 156.6 |
| C | 15 | 214 | 249907 | 1591.69 | 668 | 673 | 156.6 |
| C | 1 | 23 | 25452 | 158.25 | 668 | 673 | 156.6 |
| D | 8 | 195 | 3368991 | 20912.79 | 649 | 632 | 161.1 |
| D | 5 | 223 | 377573 | 2340.28 | 649 | 632 | 161.1 |
| D | 13 | 249 | 232355 | 1438.68 | 649 | 632 | 161.1 |
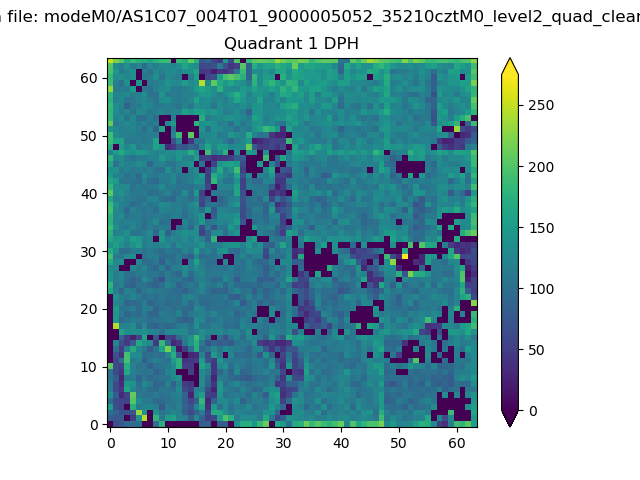
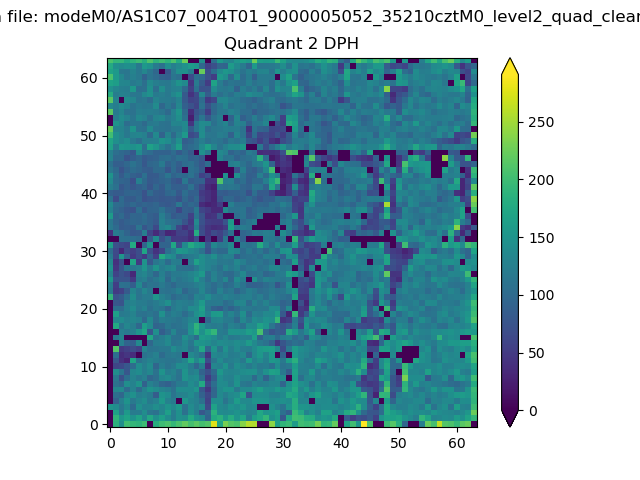
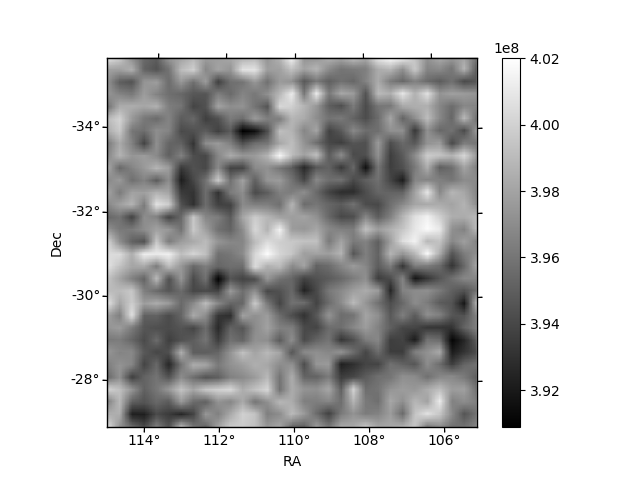
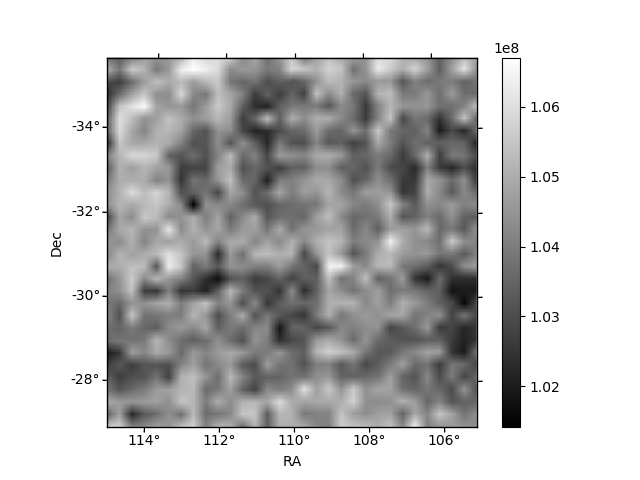
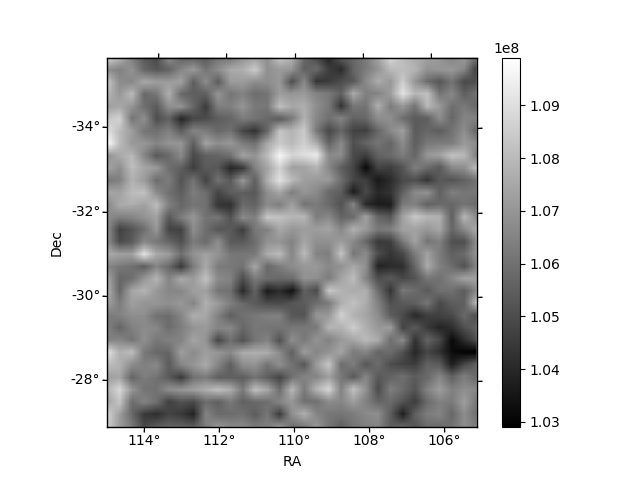
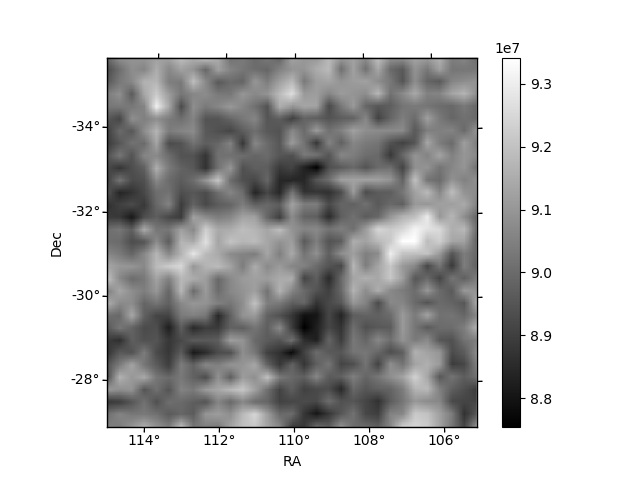
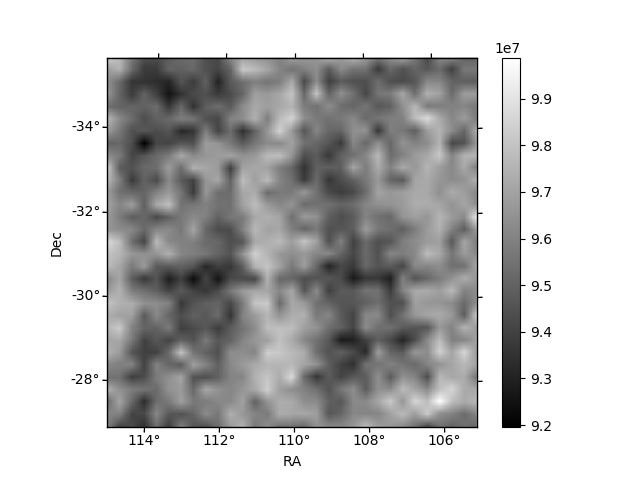
Histogram calculated using DETX and DETY for each event in the final _common_clean file
| Quadrant A | 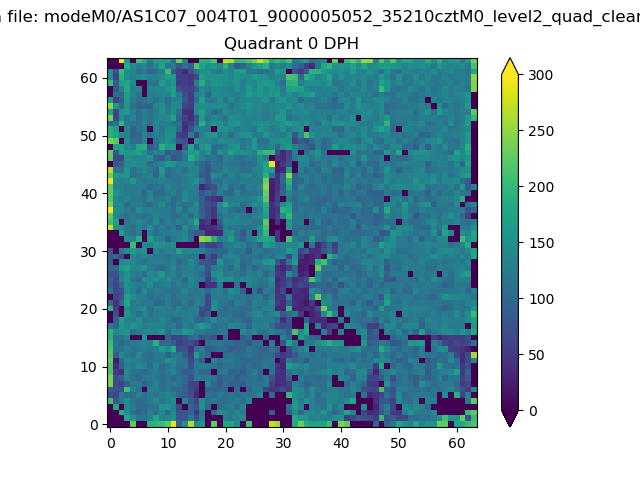 |
 |
Quadrant B |
|---|---|---|---|
| Quadrant D | 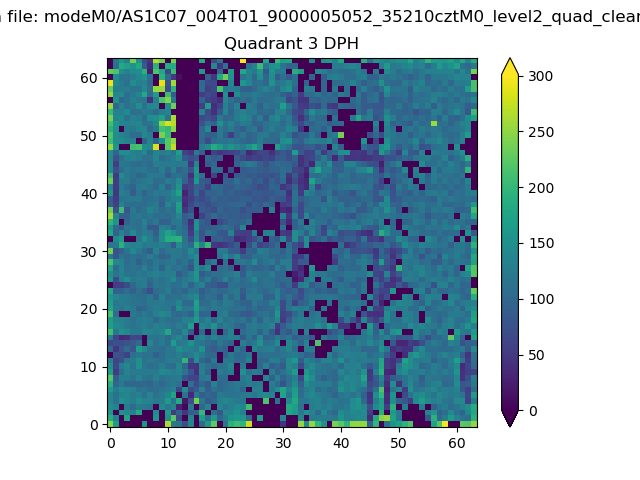 |
 |
Quadrant C |
| Plot type | Count rate plots | Images |
|---|---|---|
| Comparison with Poisson distribution Blue bars denote a histogram of data divided into 1 sec bins. Red curve is a Poisson curve with rate = median count rate of data. |
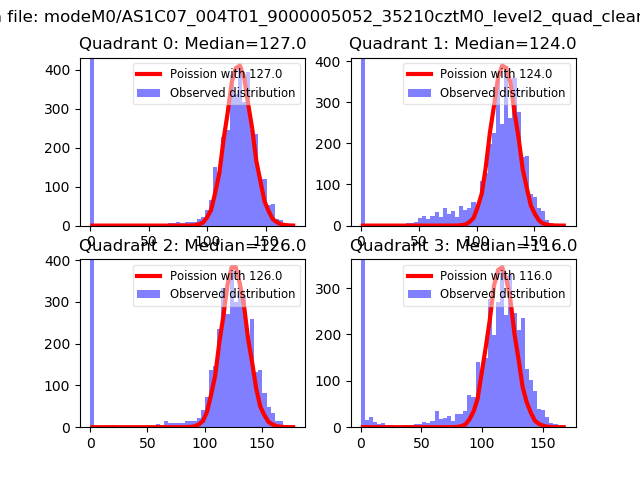 |
 |
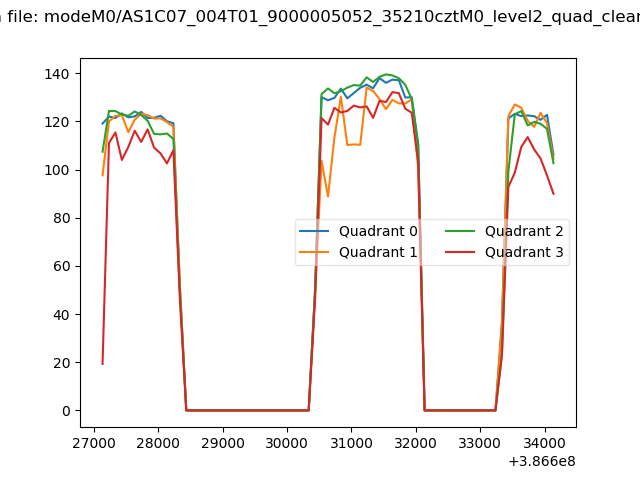
| Quadrant-wise count rates Data is divided into 100 sec bins |
 |
|
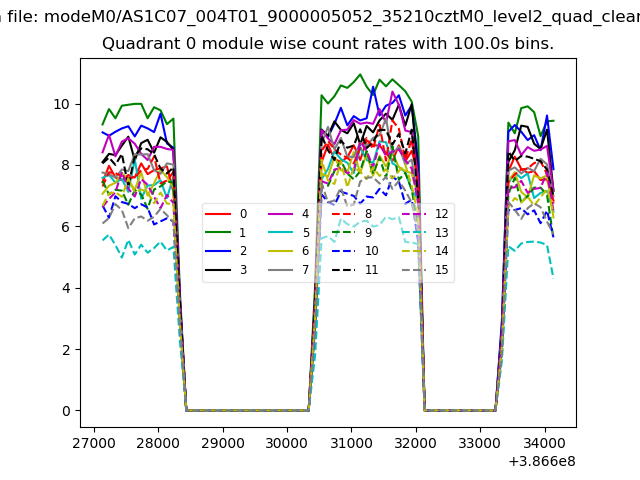
| Module-wise count rates for Quadrant A Data is divided into 100 sec bins |
 |
 |
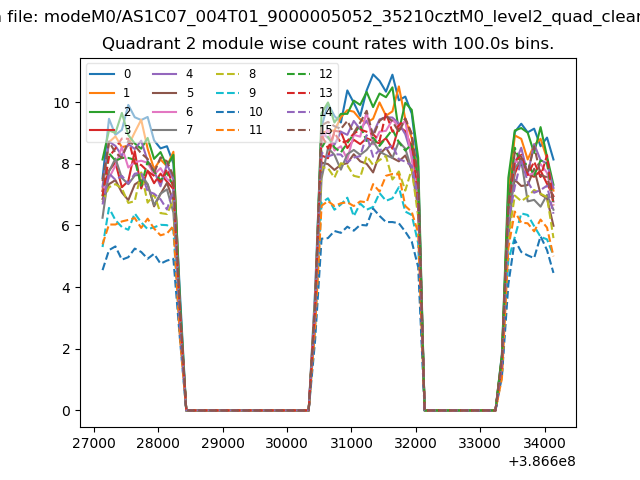
| Module-wise count rates for Quadrant B Data is divided into 100 sec bins |
 |
 |
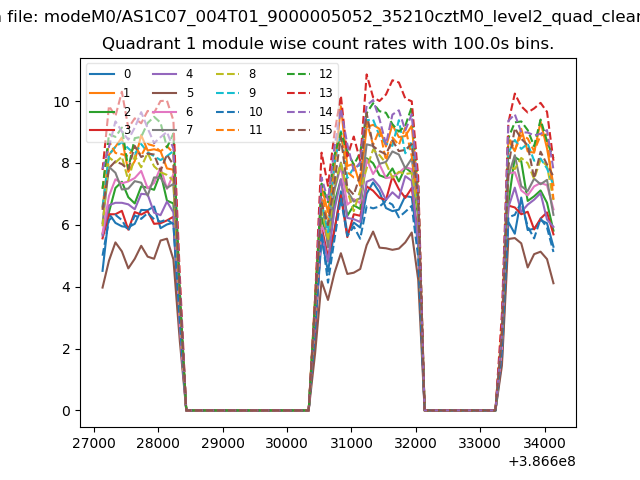
| Module-wise count rates for Quadrant C Data is divided into 100 sec bins |
 |
 |
| Module-wise count rates for Quadrant D Data is divided into 100 sec bins |
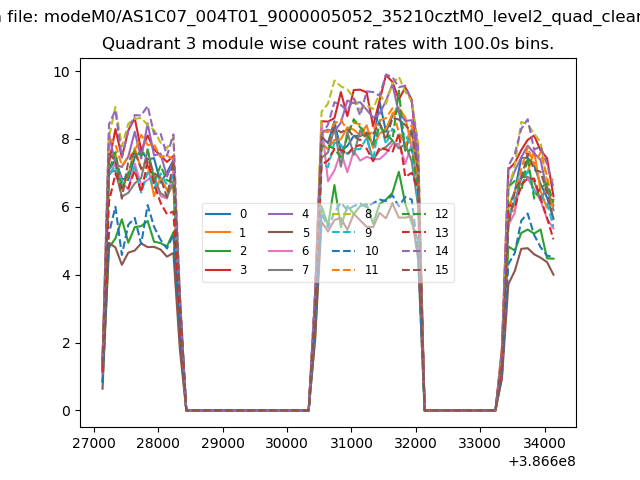 |
 |
| Parameter | Plot |
|---|---|
| CZT HV Monitor | 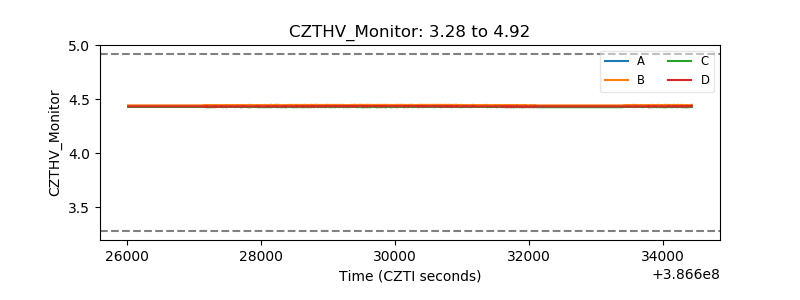 |
| D_VDD | 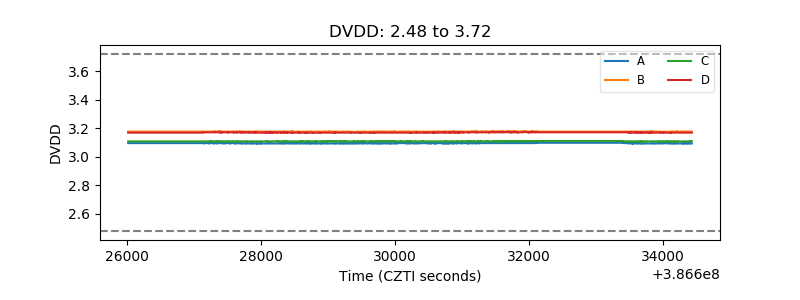 |
| Temperature 1 | 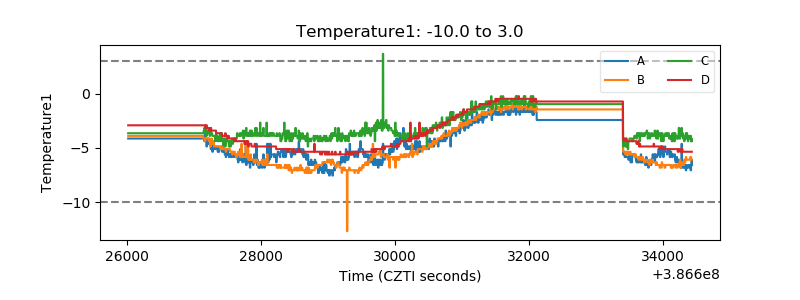 |
| Veto HV Monitor | 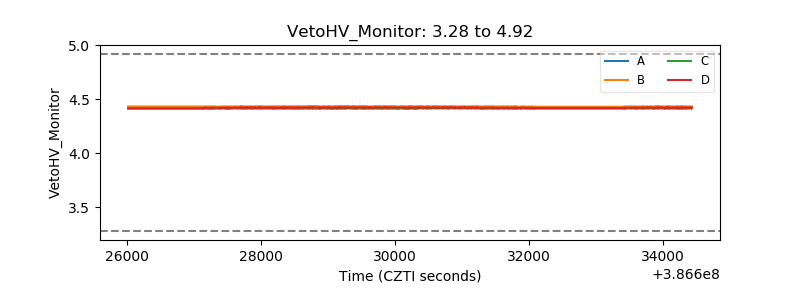 |
| Veto LLD |  |
| Alpha Counter |  |
| _CPM_Rate | 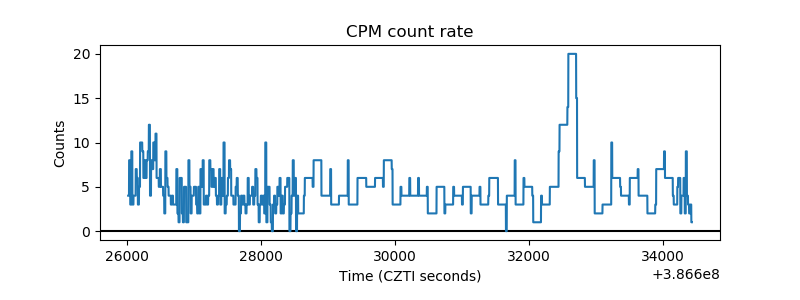 |
| CZT Counter | 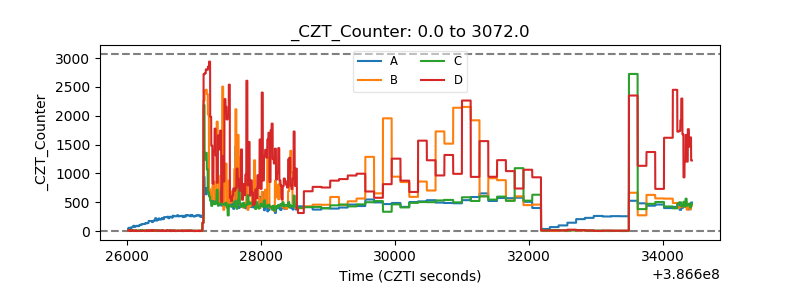 |
| +2.5 Volts monitor | 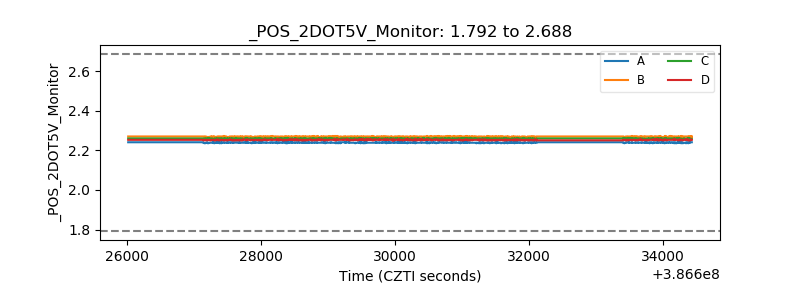 |
| +5 Volts monitor | 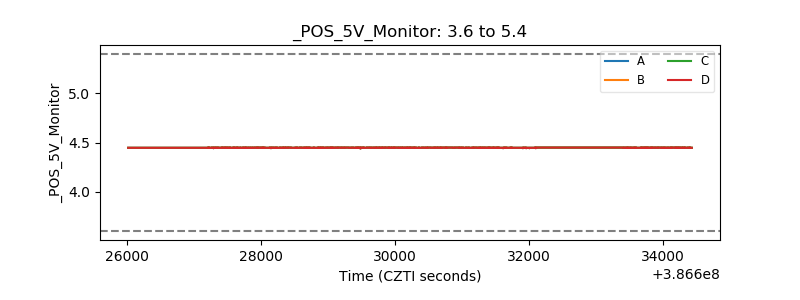 |
| _ROLL_ROT | 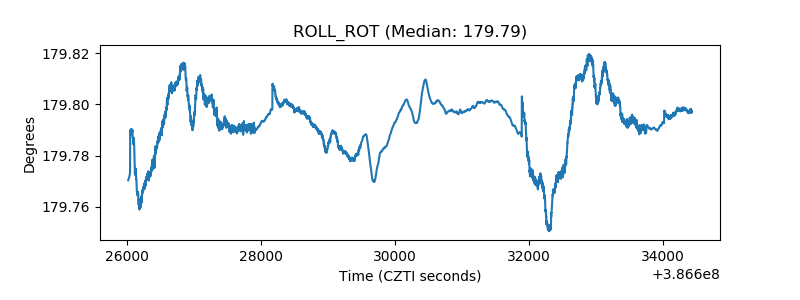 |
| _Roll_DEC | 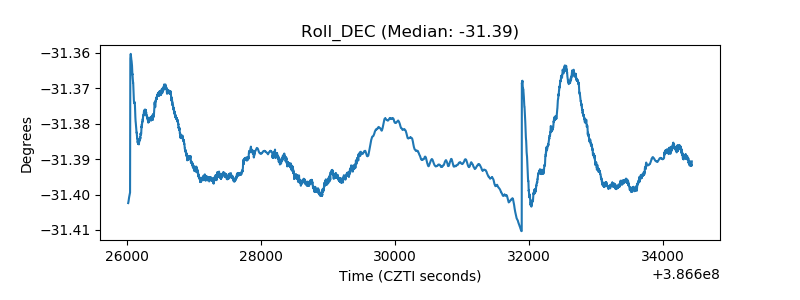 |
| _Roll_RA | 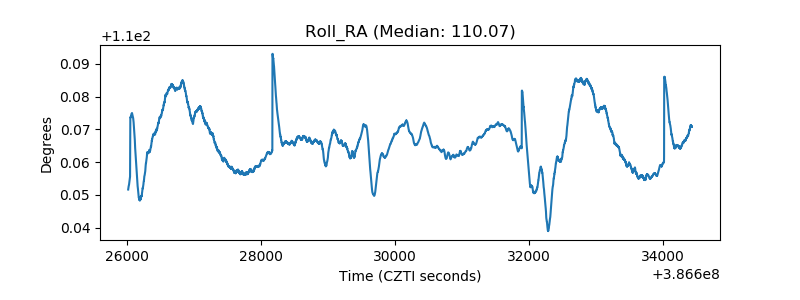 |
| Veto Counter | 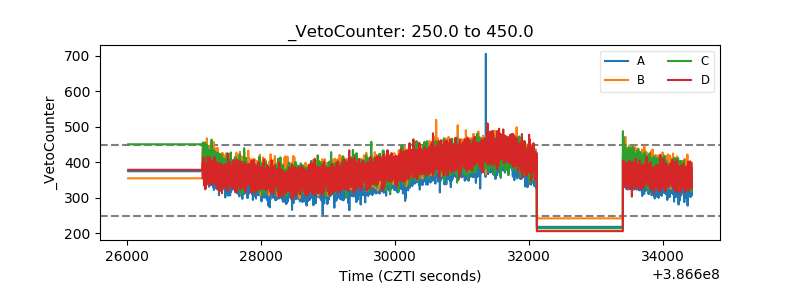 |