| Param | Original file | Final file |
|---|---|---|
| Filename | modeM0/AS1C07_004T01_9000005052_35209cztM0_level2.evt | modeM0/AS1C07_004T01_9000005052_35209cztM0_level2_quad_clean.evt |
| Size (bytes) | 596,378,880 | 72,449,280 |
| Size | 568.8 MB | 69.1 MB |
| Events in quadrant A | 3,129,180 | 462,553 |
| Events in quadrant B | 5,860,743 | 445,971 |
| Events in quadrant C | 3,140,357 | 464,893 |
| Events in quadrant D | 5,536,318 | 412,049 |
| Mode M0 | |||
|---|---|---|---|
| Quadrant | BADHDUFLAG | Total packets | Discarded packets |
| A | 0 | 13208 | 3 |
| B | 0 | 21323 | 2 |
| C | 0 | 12936 | 2 |
| D | 0 | 20556 | 2 |
| Mode SS | |||
|---|---|---|---|
| Quadrant | BADHDUFLAG | Total packets | Discarded packets |
| A | 0 | 118 | 0 |
| B | 0 | 118 | 0 |
| C | 0 | 118 | 0 |
| D | 0 | 118 | 0 |
| Mode M9 | |||
|---|---|---|---|
| Quadrant | BADHDUFLAG | Total packets | Discarded packets |
| A | 0 | 17 | 0 |
| B | 0 | 17 | 0 |
| C | 0 | 17 | 0 |
| D | 0 | 18 | 0 |
| Quadrant | Total seconds | Saturated seconds | Saturation percentage |
|---|---|---|---|
| A | 5830 | 110 | 1.886792% |
| B | 5830 | 965 | 16.552316% |
| C | 5830 | 78 | 1.337907% |
| D | 5830 | 527 | 9.039451% |
Noise dominated data is calculated using 1-second bins in cleaned event files. If a bin has >2000 counts, and if more than 50% of those come from <1% of pixels, then it is considered to be noise-dominated and hence unusable.
| Quadrant | # 1 sec bins | Bins with >0 counts | Bins with >2000 counts | High rate bins dominated by noise | Noise dominated (total time) | Noise dominated (detector-on time) | Marked lightcurve |
|---|---|---|---|---|---|---|---|
| A | 7143 | 5831 | 62 | 62 | 0.87% | 1.06% | 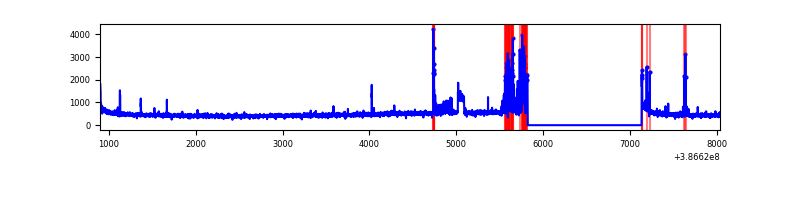 |
| B | 7143 | 5831 | 672 | 672 | 9.41% | 11.52% | 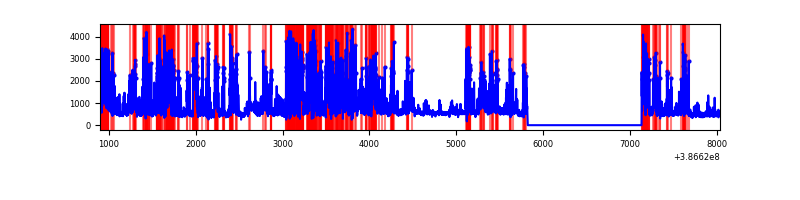 |
| C | 7143 | 5831 | 62 | 62 | 0.87% | 1.06% | 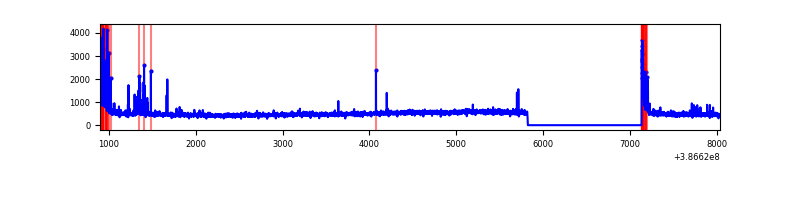 |
| D | 7143 | 5831 | 512 | 512 | 7.17% | 8.78% | 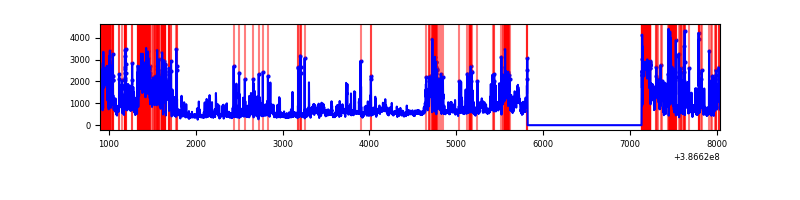 |
Top three noisy pixels from each quadrant. If the there are fewer than three noisy pixels in the level2.evt file, extra rows are filled as -1
| Pixel properties | Quadrant properties | ||||||
|---|---|---|---|---|---|---|---|
| Quadrant | DetID | PixID | Counts | Sigma | Mean | Median | Sigma |
| A | 7 | 16 | 281569 | 2070.72 | 669 | 656 | 135.7 |
| A | 10 | 83 | 104662 | 766.67 | 669 | 656 | 135.7 |
| A | 9 | 143 | 56689 | 413.04 | 669 | 656 | 135.7 |
| B | 5 | 236 | 3231425 | 26655.69 | 627 | 610 | 121.2 |
| B | 4 | 232 | 65546 | 535.75 | 627 | 610 | 121.2 |
| B | 5 | 172 | 65336 | 534.02 | 627 | 610 | 121.2 |
| C | 0 | 10 | 267852 | 1766.91 | 648 | 651 | 151.2 |
| C | 15 | 214 | 243036 | 1602.81 | 648 | 651 | 151.2 |
| C | 15 | 159 | 49269 | 321.5 | 648 | 651 | 151.2 |
| D | 8 | 195 | 1341430 | 8703.86 | 624 | 608 | 154.0 |
| D | 5 | 223 | 655338 | 4250.14 | 624 | 608 | 154.0 |
| D | 10 | 118 | 589908 | 3825.4 | 624 | 608 | 154.0 |
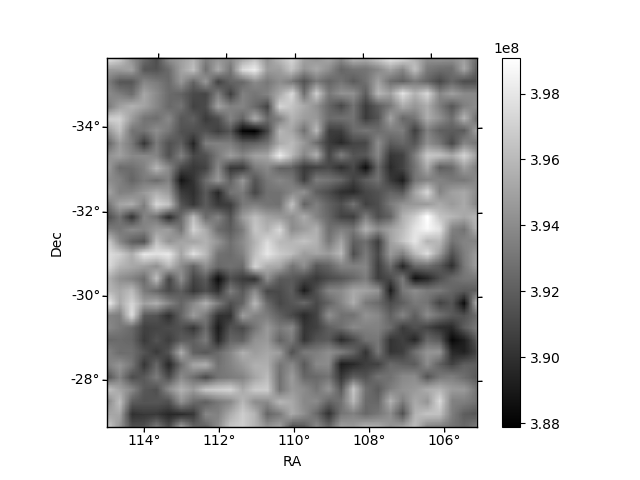
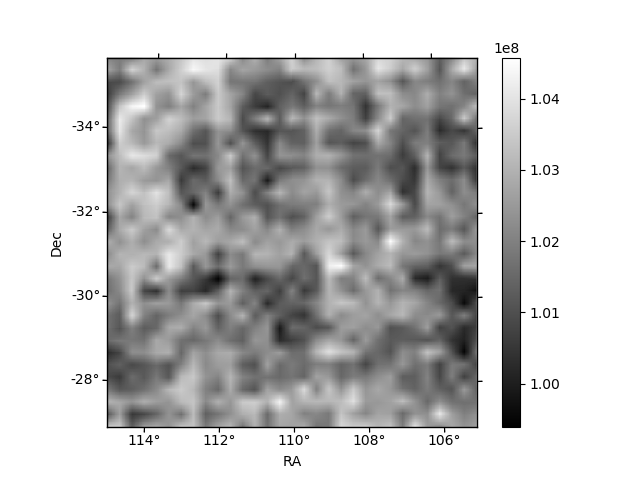
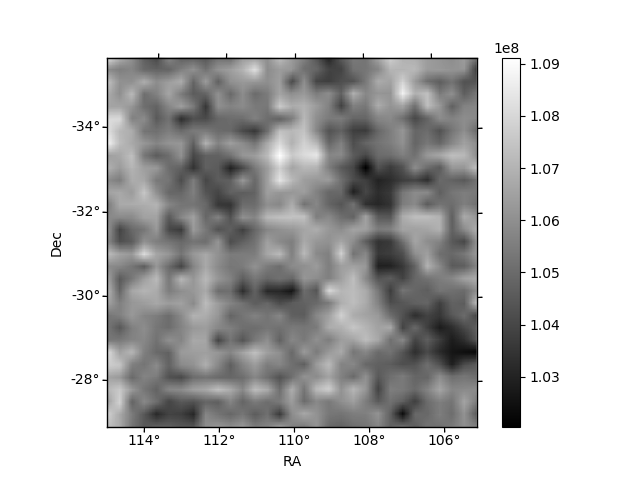
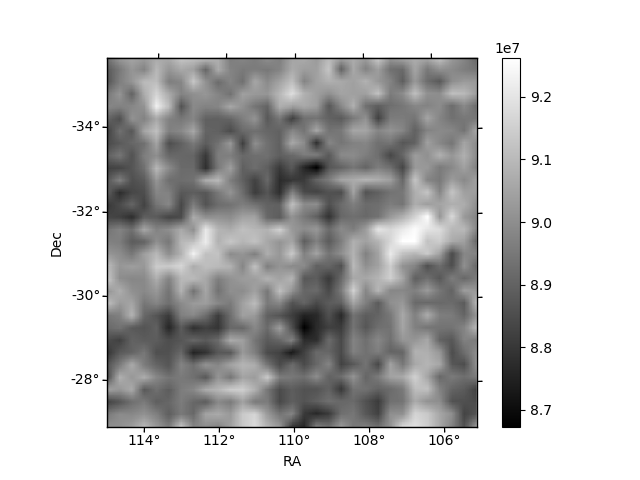
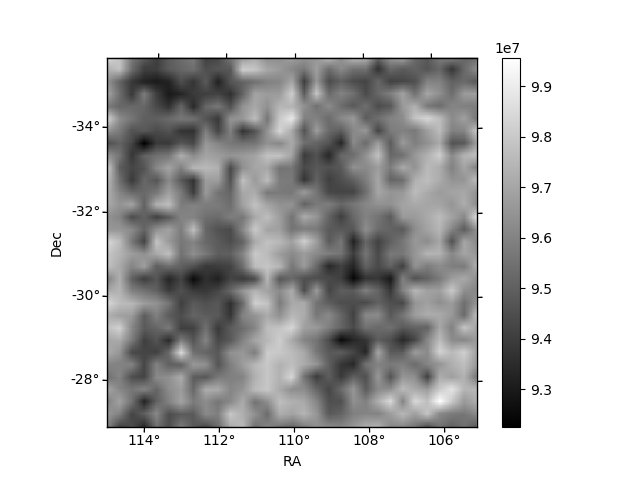
Histogram calculated using DETX and DETY for each event in the final _common_clean file
| Quadrant A | 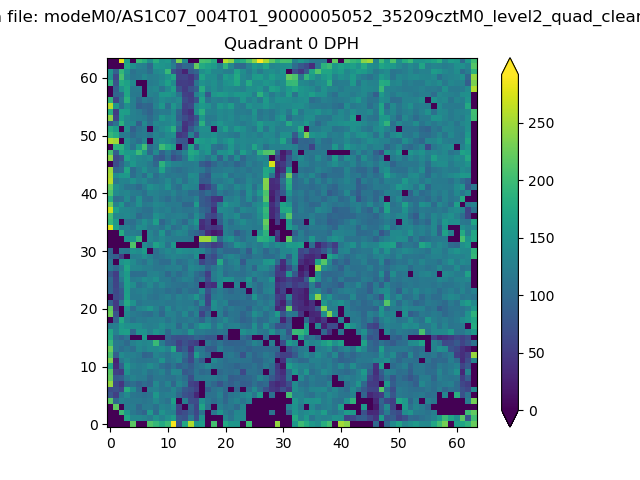 |
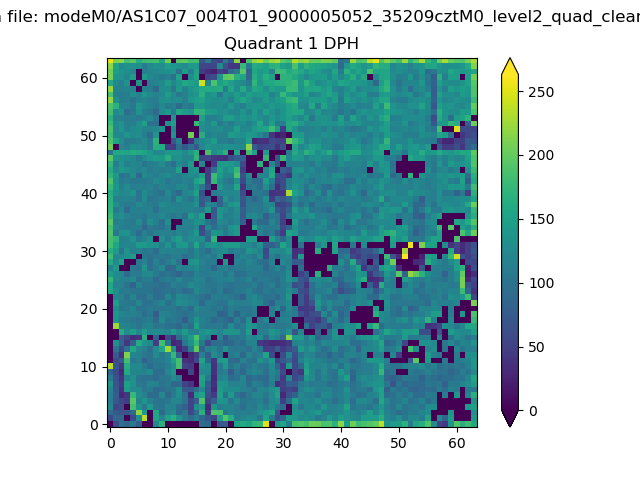 |
Quadrant B |
|---|---|---|---|
| Quadrant D | 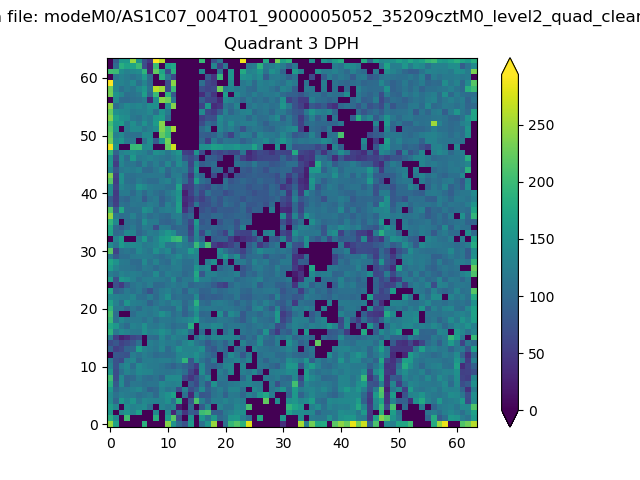 |
 |
Quadrant C |
| Plot type | Count rate plots | Images |
|---|---|---|
| Comparison with Poisson distribution Blue bars denote a histogram of data divided into 1 sec bins. Red curve is a Poisson curve with rate = median count rate of data. |
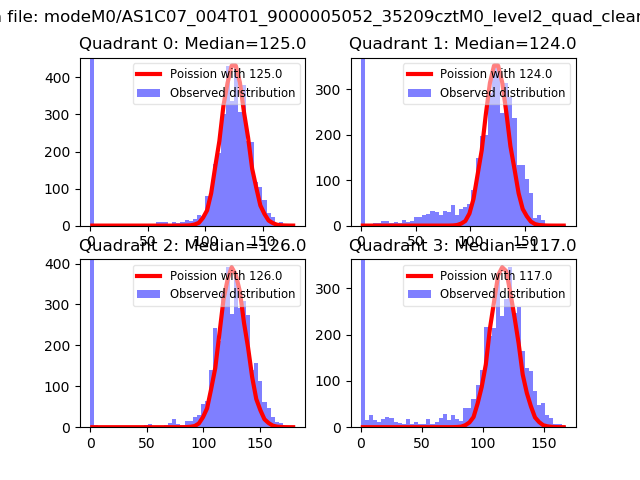 |
 |
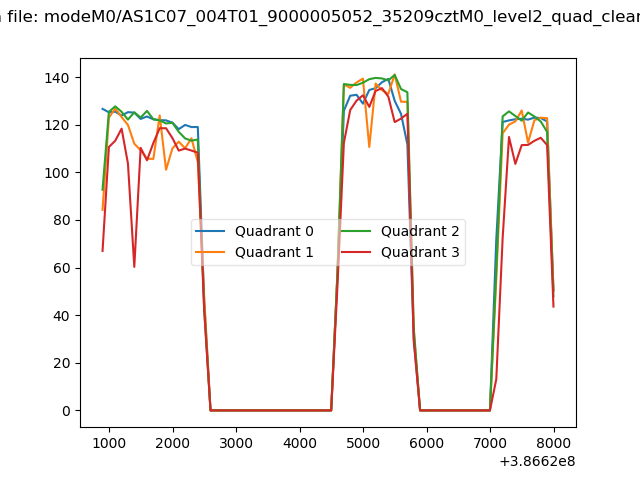
| Quadrant-wise count rates Data is divided into 100 sec bins |
 |
|
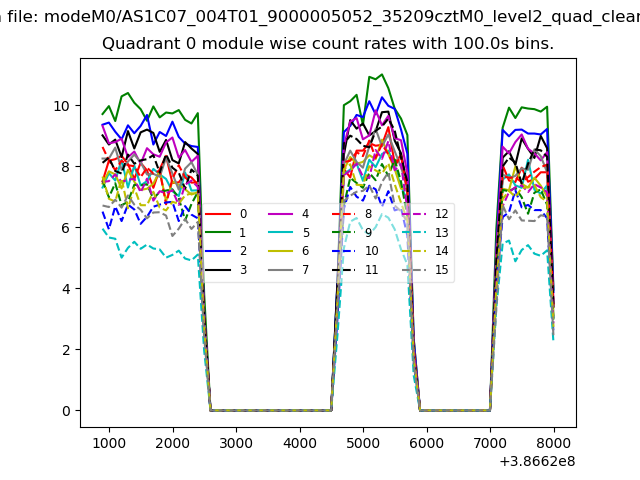
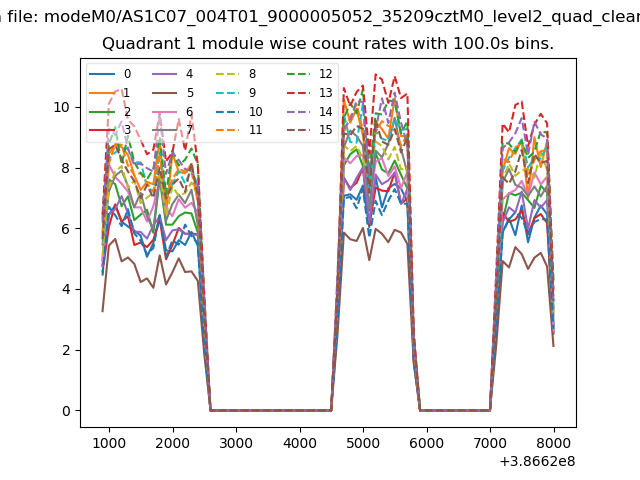
| Module-wise count rates for Quadrant A Data is divided into 100 sec bins |
 |
 |
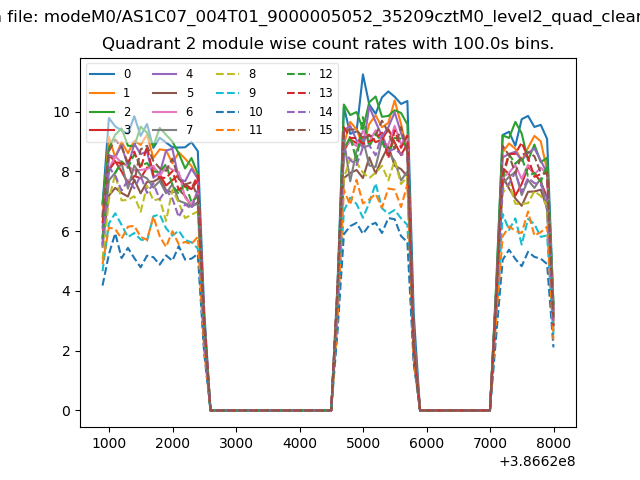
| Module-wise count rates for Quadrant B Data is divided into 100 sec bins |
 |
 |
| Module-wise count rates for Quadrant C Data is divided into 100 sec bins |
 |
 |
| Module-wise count rates for Quadrant D Data is divided into 100 sec bins |
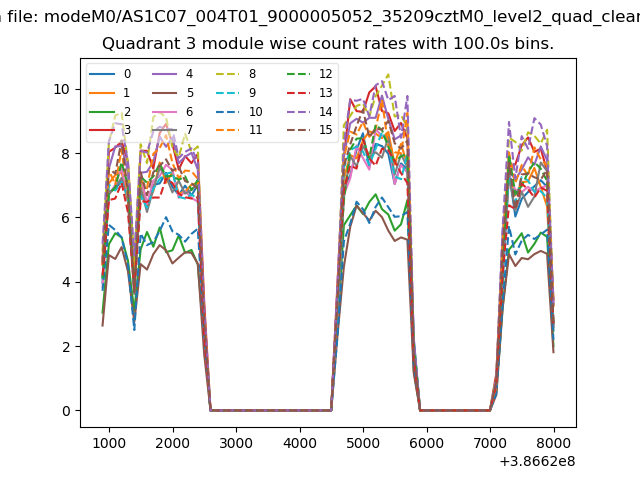 |
 |
| Parameter | Plot |
|---|---|
| CZT HV Monitor | 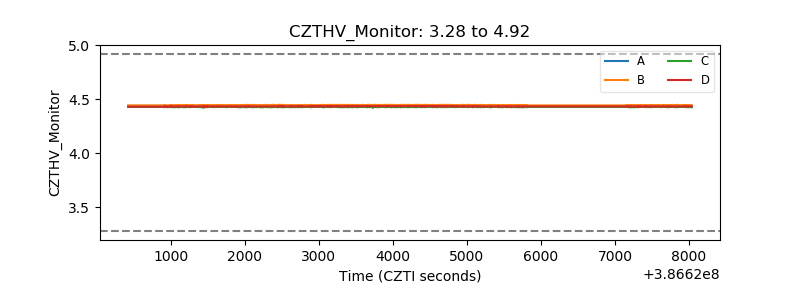 |
| D_VDD | 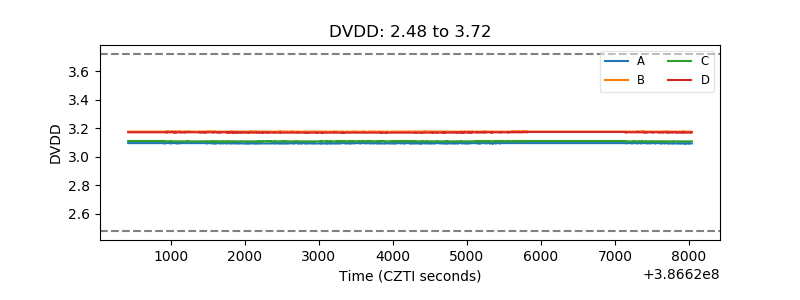 |
| Temperature 1 | 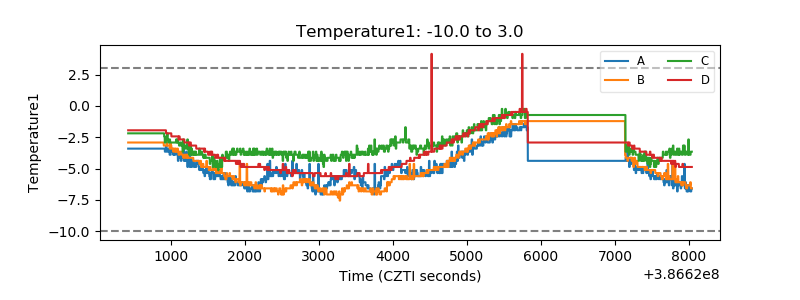 |
| Veto HV Monitor | 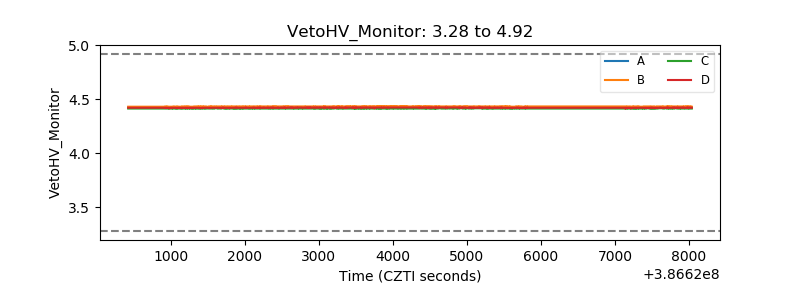 |
| Veto LLD | 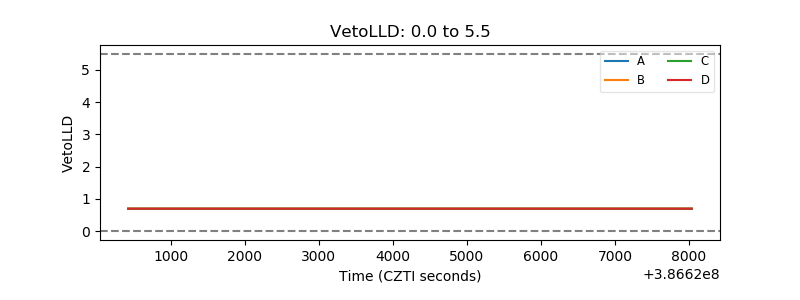 |
| Alpha Counter | 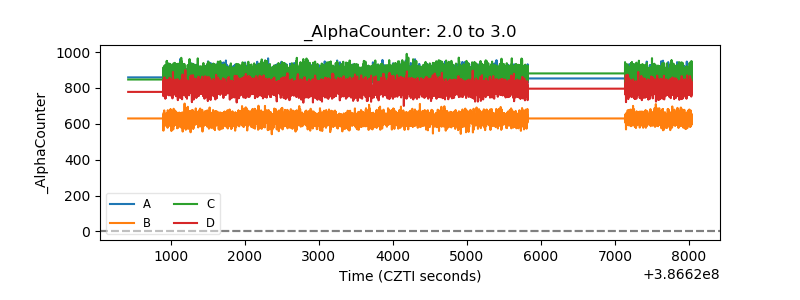 |
| _CPM_Rate | 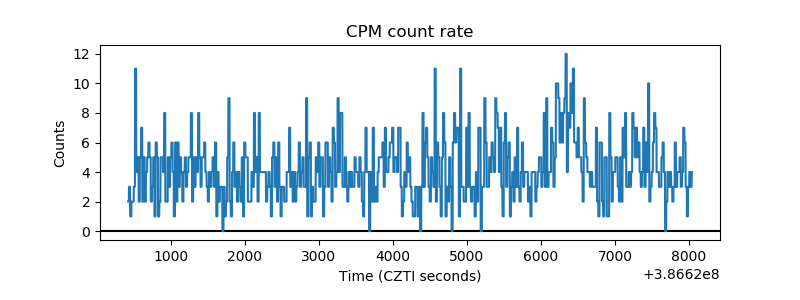 |
| CZT Counter | 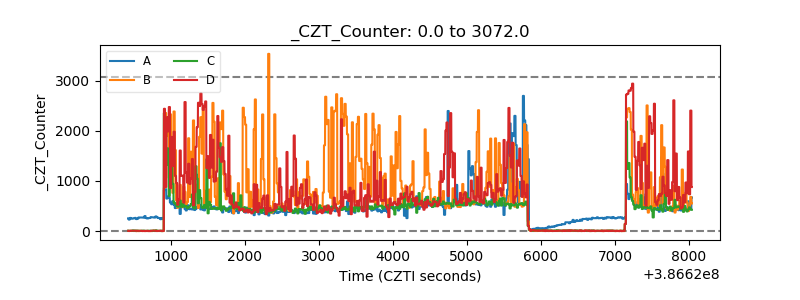 |
| +2.5 Volts monitor | 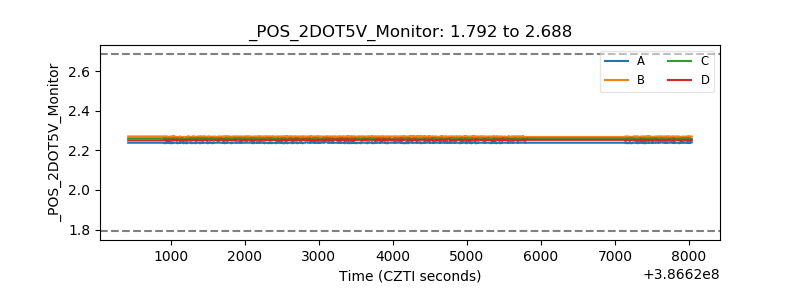 |
| +5 Volts monitor | 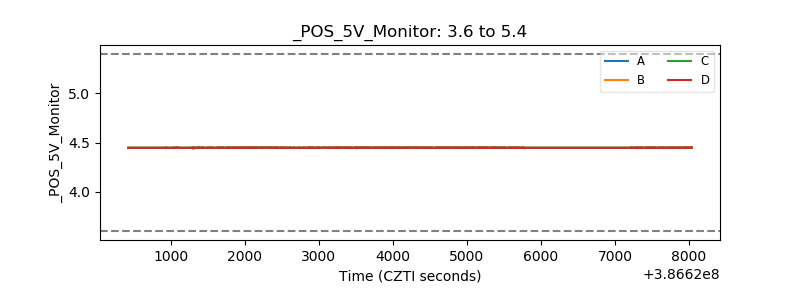 |
| _ROLL_ROT | 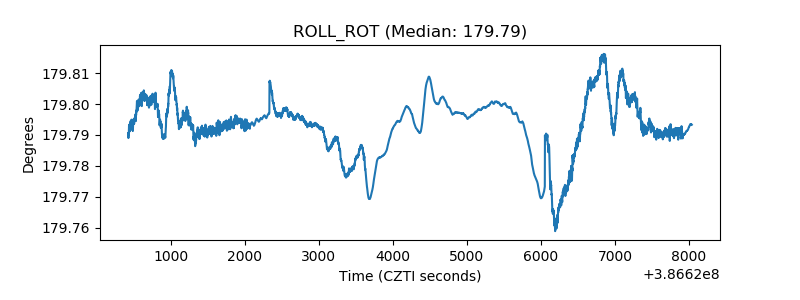 |
| _Roll_DEC | 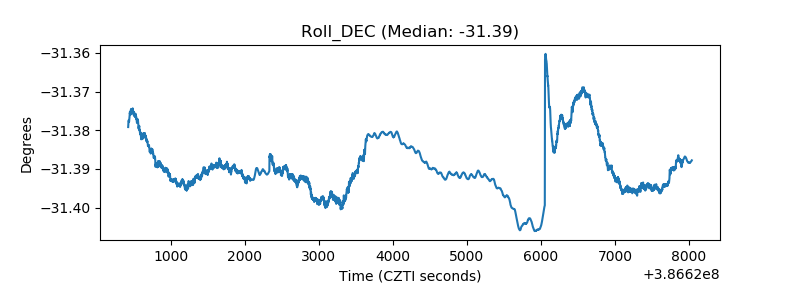 |
| _Roll_RA | 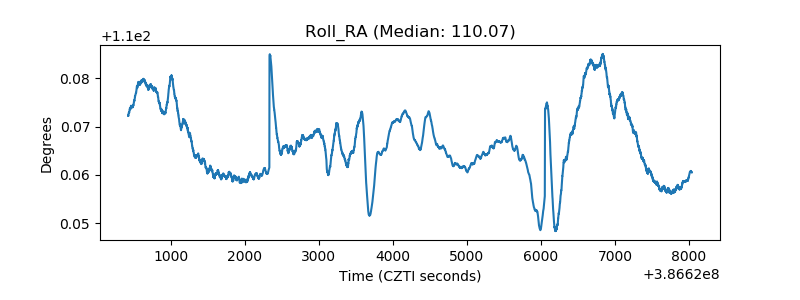 |
| Veto Counter | 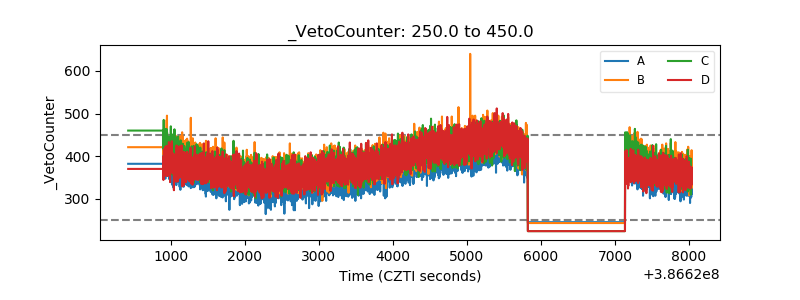 |