| Param | Original file | Final file |
|---|---|---|
| Filename | modeM0/AS1C07_004T01_9000005052_35208cztM0_level2.evt | modeM0/AS1C07_004T01_9000005052_35208cztM0_level2_quad_clean.evt |
| Size (bytes) | 603,357,120 | 69,344,640 |
| Size | 575.4 MB | 66.1 MB |
| Events in quadrant A | 2,694,038 | 450,730 |
| Events in quadrant B | 5,930,019 | 412,692 |
| Events in quadrant C | 3,226,231 | 441,787 |
| Events in quadrant D | 6,039,304 | 397,857 |
| Mode M0 | |||
|---|---|---|---|
| Quadrant | BADHDUFLAG | Total packets | Discarded packets |
| A | 0 | 11714 | 3 |
| B | 0 | 21520 | 2 |
| C | 0 | 13123 | 2 |
| D | 0 | 21981 | 2 |
| Mode SS | |||
|---|---|---|---|
| Quadrant | BADHDUFLAG | Total packets | Discarded packets |
| A | 0 | 114 | 0 |
| B | 0 | 114 | 0 |
| C | 0 | 114 | 0 |
| D | 0 | 114 | 0 |
| Mode M9 | |||
|---|---|---|---|
| Quadrant | BADHDUFLAG | Total packets | Discarded packets |
| A | 0 | 23 | 0 |
| B | 0 | 23 | 0 |
| C | 0 | 23 | 0 |
| D | 0 | 24 | 0 |
| Quadrant | Total seconds | Saturated seconds | Saturation percentage |
|---|---|---|---|
| A | 5668 | 6 | 0.105857% |
| B | 5668 | 1079 | 19.036697% |
| C | 5668 | 120 | 2.117149% |
| D | 5668 | 638 | 11.256175% |
Noise dominated data is calculated using 1-second bins in cleaned event files. If a bin has >2000 counts, and if more than 50% of those come from <1% of pixels, then it is considered to be noise-dominated and hence unusable.
| Quadrant | # 1 sec bins | Bins with >0 counts | Bins with >2000 counts | High rate bins dominated by noise | Noise dominated (total time) | Noise dominated (detector-on time) | Marked lightcurve |
|---|---|---|---|---|---|---|---|
| A | 7161 | 5669 | 1 | 1 | 0.01% | 0.02% | 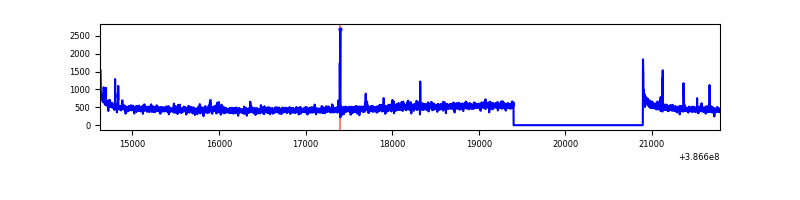 |
| B | 7161 | 5669 | 674 | 674 | 9.41% | 11.89% | 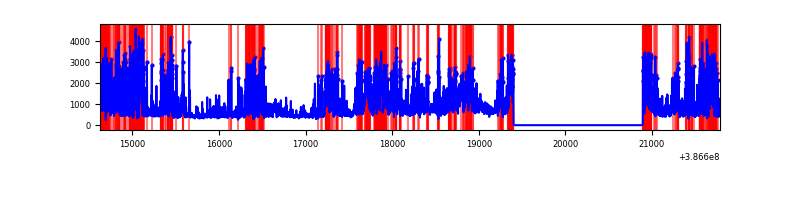 |
| C | 7161 | 5669 | 102 | 102 | 1.42% | 1.80% | 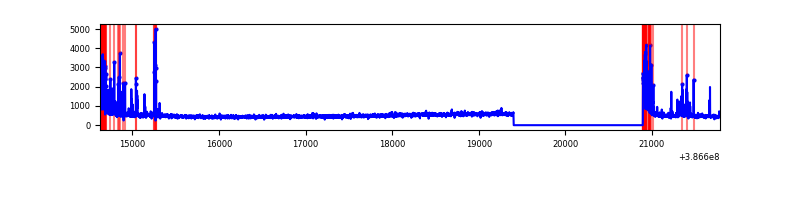 |
| D | 7161 | 5669 | 618 | 618 | 8.63% | 10.90% | 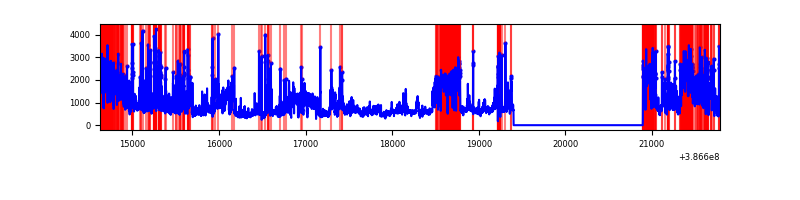 |
Top three noisy pixels from each quadrant. If the there are fewer than three noisy pixels in the level2.evt file, extra rows are filled as -1
| Pixel properties | Quadrant properties | ||||||
|---|---|---|---|---|---|---|---|
| Quadrant | DetID | PixID | Counts | Sigma | Mean | Median | Sigma |
| A | 10 | 83 | 104633 | 780.91 | 654 | 641 | 133.2 |
| A | 9 | 143 | 33202 | 244.51 | 654 | 641 | 133.2 |
| A | 13 | 6 | 12978 | 92.64 | 654 | 641 | 133.2 |
| B | 5 | 236 | 3415793 | 29018.43 | 610 | 595 | 117.7 |
| B | 4 | 232 | 59091 | 497.03 | 610 | 595 | 117.7 |
| B | 0 | 190 | 26110 | 216.8 | 610 | 595 | 117.7 |
| C | 0 | 10 | 374355 | 2549.24 | 628 | 633 | 146.6 |
| C | 15 | 214 | 236161 | 1606.59 | 628 | 633 | 146.6 |
| C | 1 | 23 | 74990 | 507.21 | 628 | 633 | 146.6 |
| D | 8 | 195 | 1613896 | 10785.08 | 608 | 592 | 149.6 |
| D | 10 | 118 | 743695 | 4967.71 | 608 | 592 | 149.6 |
| D | 5 | 157 | 449970 | 3004.13 | 608 | 592 | 149.6 |
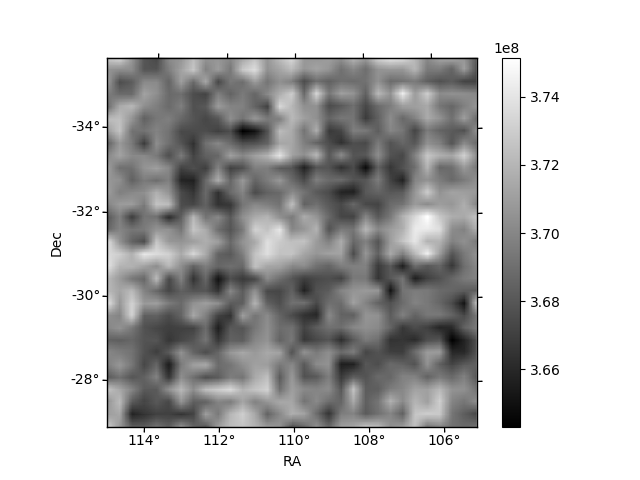
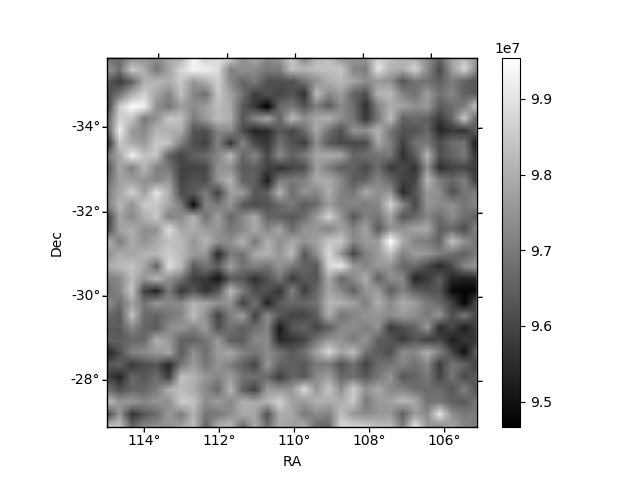
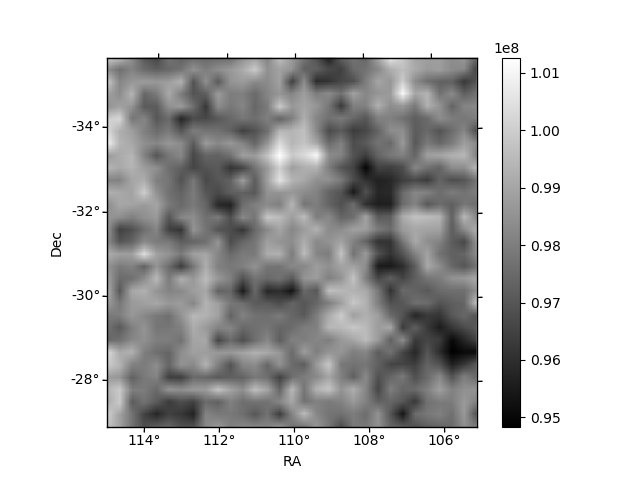
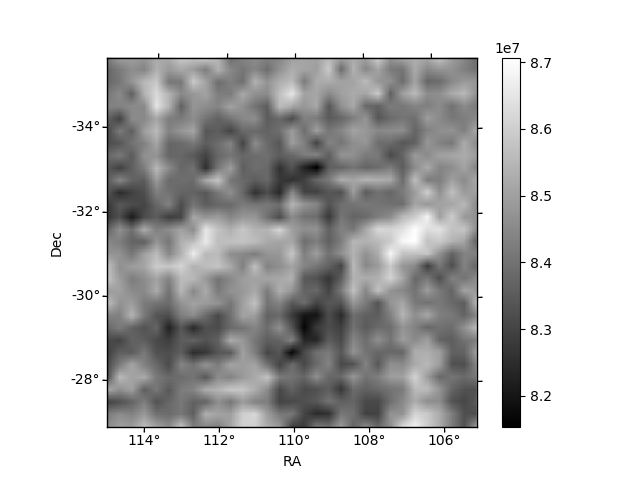
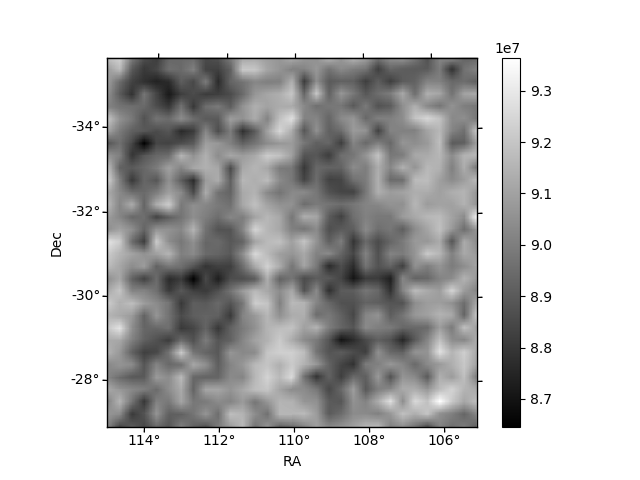
Histogram calculated using DETX and DETY for each event in the final _common_clean file
| Quadrant A | 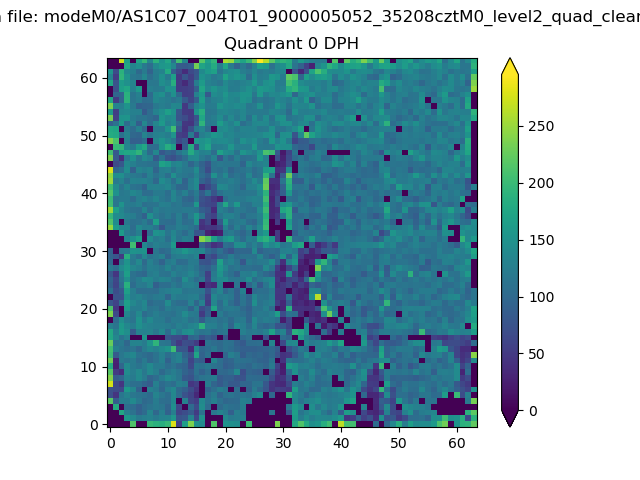 |
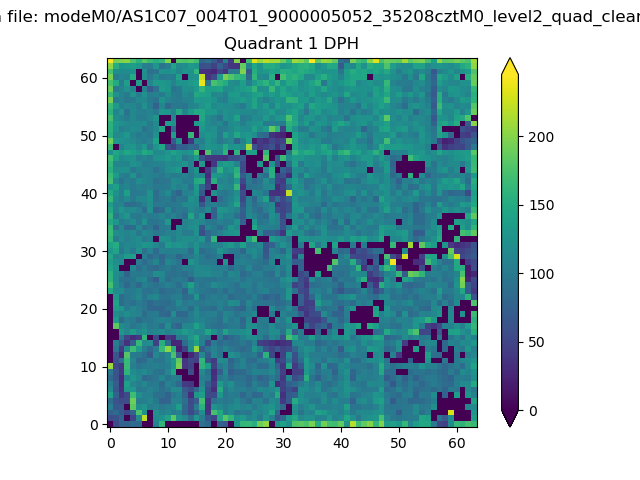 |
Quadrant B |
|---|---|---|---|
| Quadrant D | 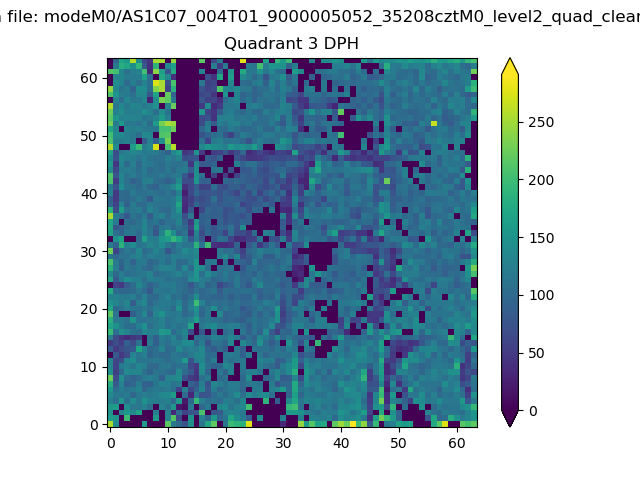 |
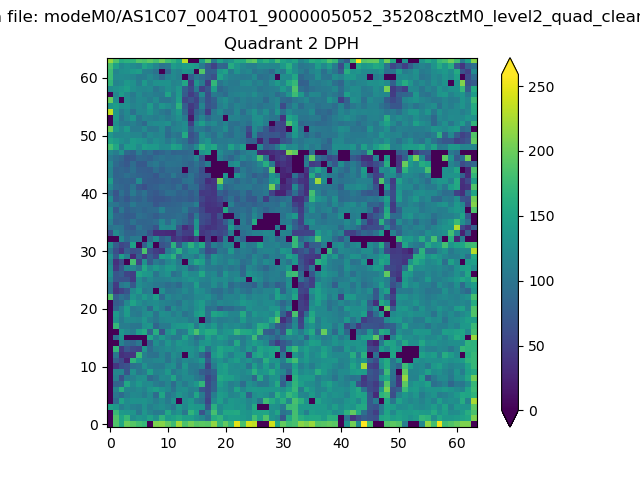 |
Quadrant C |
| Plot type | Count rate plots | Images |
|---|---|---|
| Comparison with Poisson distribution Blue bars denote a histogram of data divided into 1 sec bins. Red curve is a Poisson curve with rate = median count rate of data. |
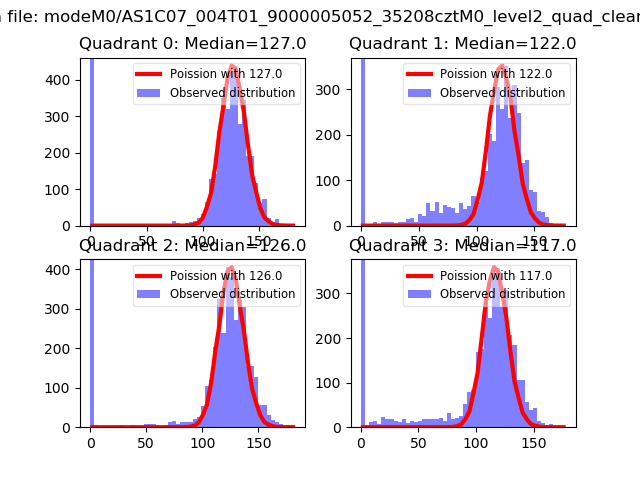 |
 |
| Quadrant-wise count rates Data is divided into 100 sec bins |
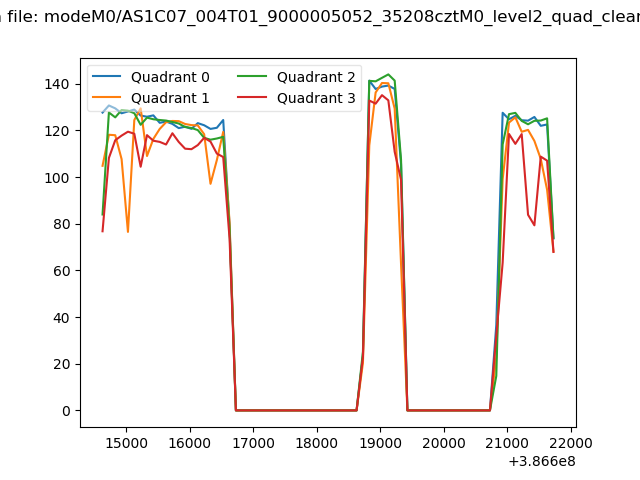 |
|
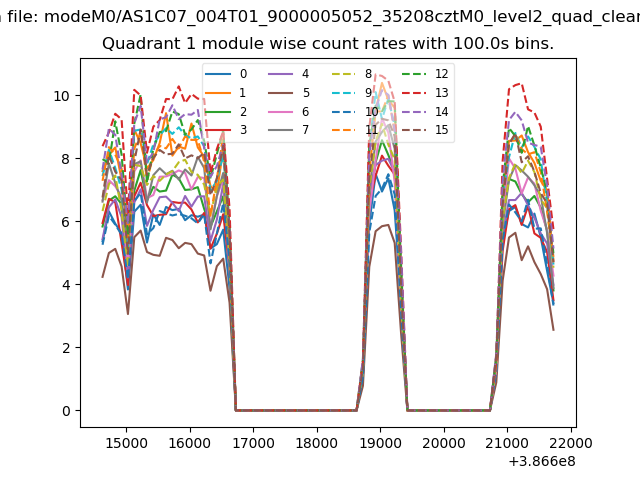
| Module-wise count rates for Quadrant A Data is divided into 100 sec bins |
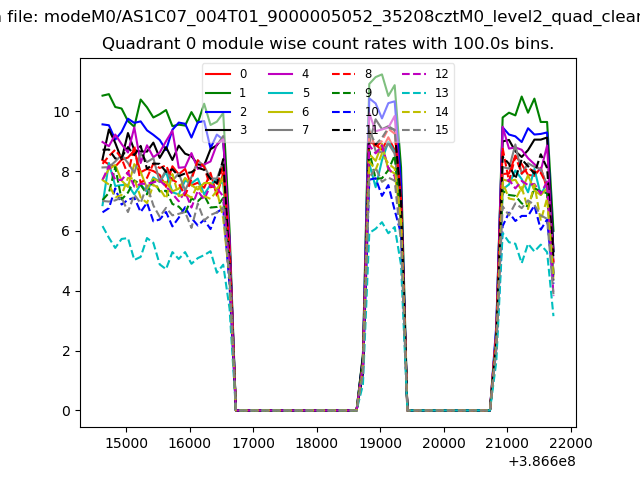 |
 |
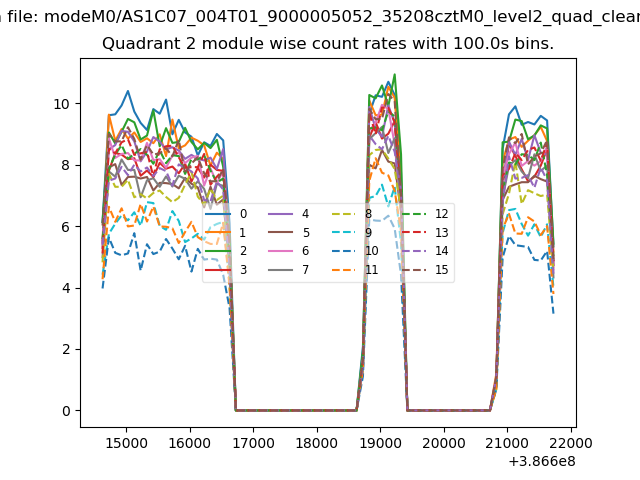
| Module-wise count rates for Quadrant B Data is divided into 100 sec bins |
 |
 |
| Module-wise count rates for Quadrant C Data is divided into 100 sec bins |
 |
 |
| Module-wise count rates for Quadrant D Data is divided into 100 sec bins |
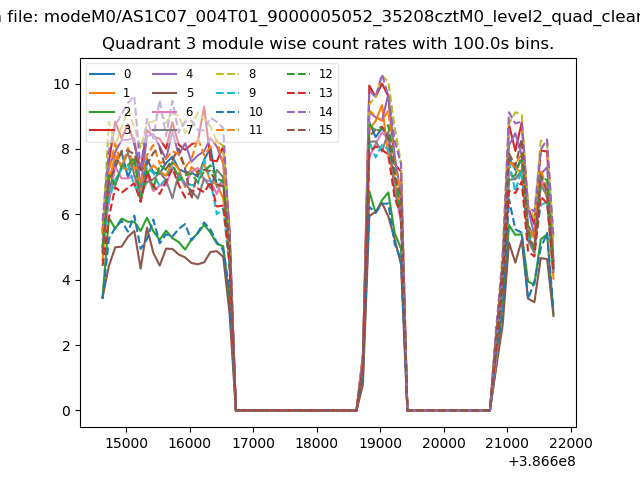 |
 |
| Parameter | Plot |
|---|---|
| CZT HV Monitor | 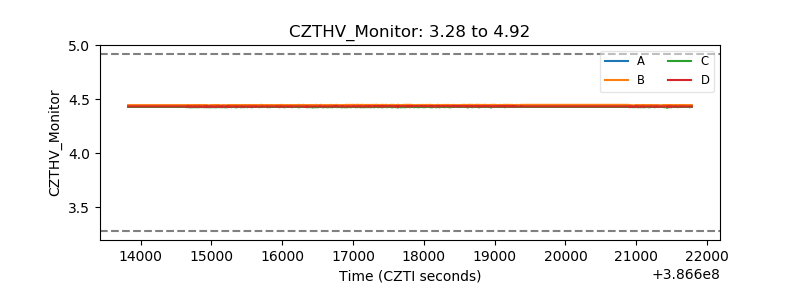 |
| D_VDD | 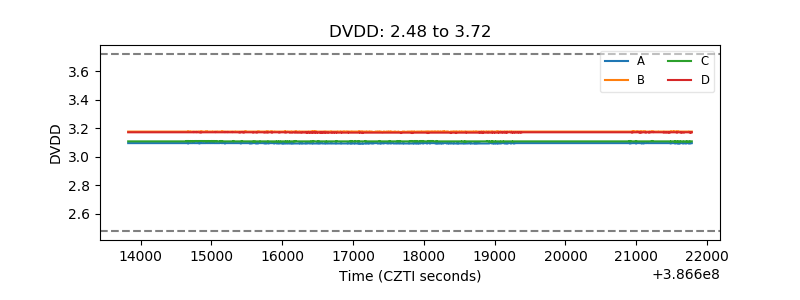 |
| Temperature 1 | 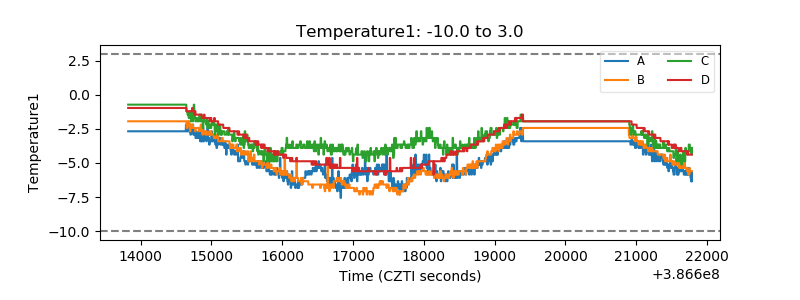 |
| Veto HV Monitor | 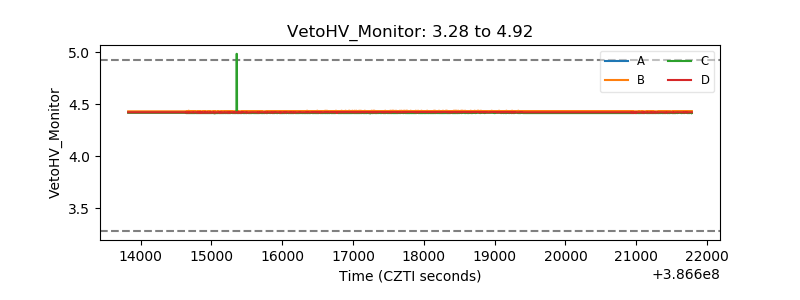 |
| Veto LLD | 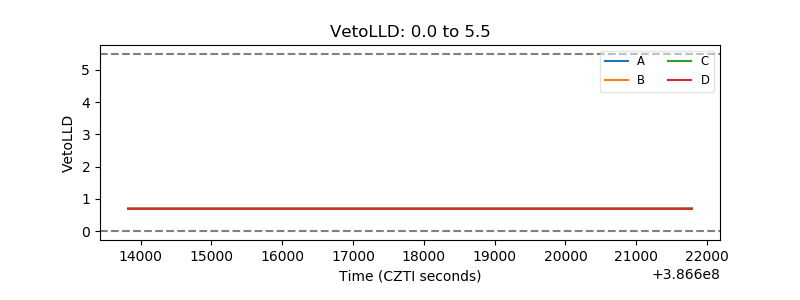 |
| Alpha Counter | 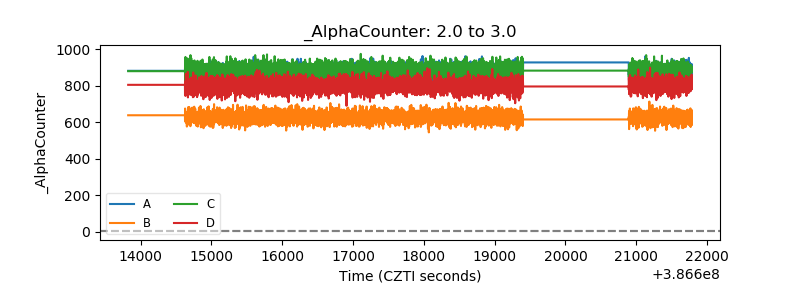 |
| _CPM_Rate | 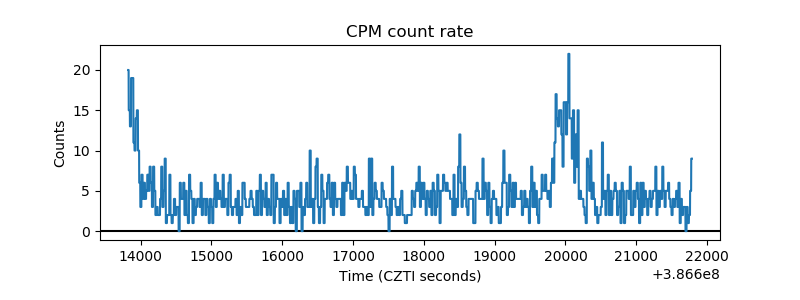 |
| CZT Counter | 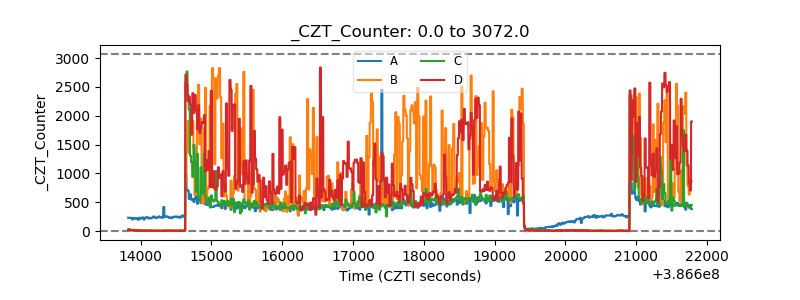 |
| +2.5 Volts monitor | 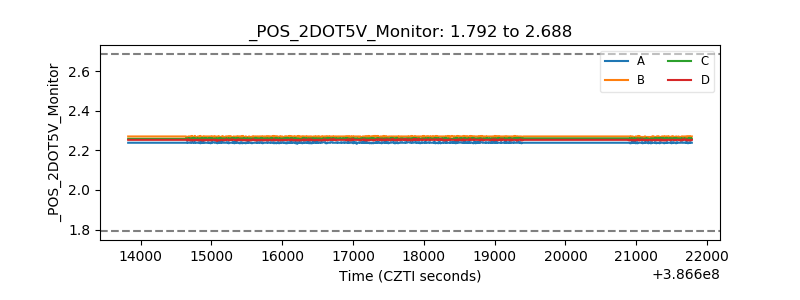 |
| +5 Volts monitor | 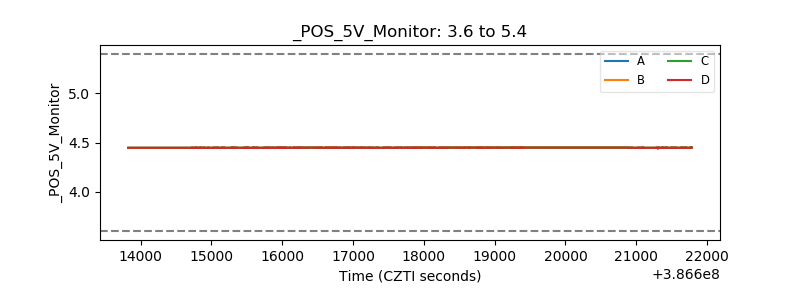 |
| _ROLL_ROT | 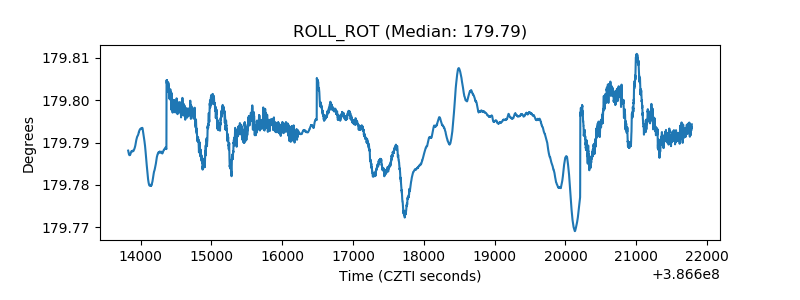 |
| _Roll_DEC | 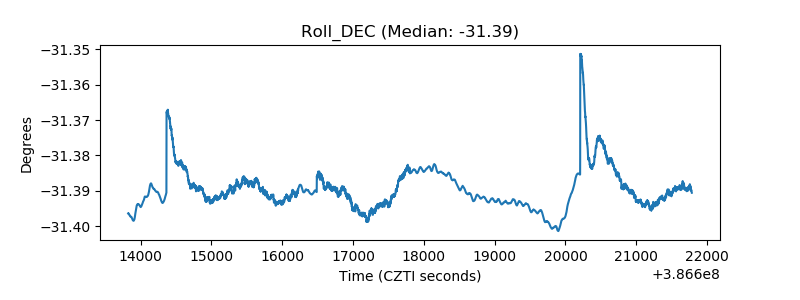 |
| _Roll_RA | 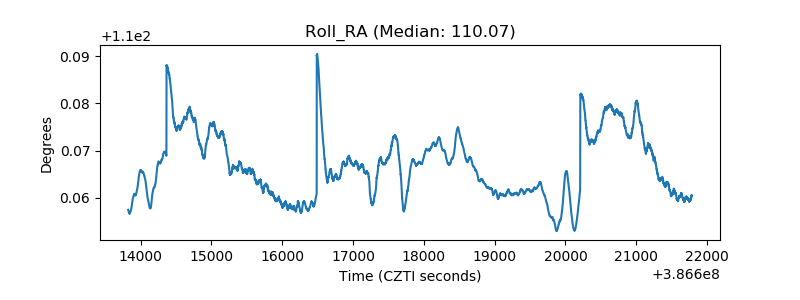 |
| Veto Counter |  |