| Param | Original file | Final file |
|---|---|---|
| Filename | modeM0/AS1T05_020T01_9000005050_35201cztM0_level2.evt | modeM0/AS1T05_020T01_9000005050_35201cztM0_level2_quad_clean.evt |
| Size (bytes) | 2,524,766,400 | 263,036,160 |
| Size | 2.4 GB | 250.9 MB |
| Events in quadrant A | 11,255,020 | 1,665,645 |
| Events in quadrant B | 29,156,919 | 1,477,612 |
| Events in quadrant C | 13,144,964 | 1,650,422 |
| Events in quadrant D | 21,320,419 | 1,546,339 |
| Mode SS | |||
|---|---|---|---|
| Quadrant | BADHDUFLAG | Total packets | Discarded packets |
| A | 0 | 480 | 0 |
| B | 0 | 480 | 0 |
| C | 0 | 480 | 0 |
| D | 0 | 480 | 0 |
| Mode M0 | |||
|---|---|---|---|
| Quadrant | BADHDUFLAG | Total packets | Discarded packets |
| A | 0 | 48524 | 5 |
| B | 0 | 102816 | 5 |
| C | 0 | 52873 | 5 |
| D | 0 | 79866 | 5 |
| Mode M9 | |||
|---|---|---|---|
| Quadrant | BADHDUFLAG | Total packets | Discarded packets |
| A | 0 | 73 | 0 |
| B | 0 | 73 | 0 |
| C | 0 | 73 | 0 |
| D | 0 | 73 | 0 |
| Quadrant | Total seconds | Saturated seconds | Saturation percentage |
|---|---|---|---|
| A | 23620 | 39 | 0.165114% |
| B | 23620 | 6021 | 25.491109% |
| C | 23620 | 269 | 1.138865% |
| D | 23620 | 1333 | 5.643522% |
Noise dominated data is calculated using 1-second bins in cleaned event files. If a bin has >2000 counts, and if more than 50% of those come from <1% of pixels, then it is considered to be noise-dominated and hence unusable.
| Quadrant | # 1 sec bins | Bins with >0 counts | Bins with >2000 counts | High rate bins dominated by noise | Noise dominated (total time) | Noise dominated (detector-on time) | Marked lightcurve |
|---|---|---|---|---|---|---|---|
| A | 30815 | 23625 | 8 | 8 | 0.03% | 0.03% | 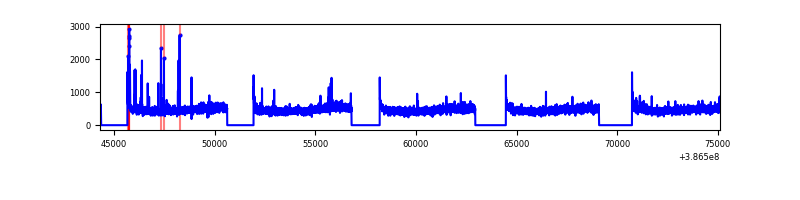 |
| B | 30815 | 23625 | 4156 | 4156 | 13.49% | 17.59% | 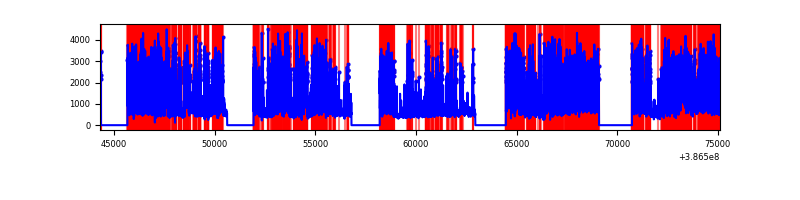 |
| C | 30815 | 23625 | 185 | 185 | 0.60% | 0.78% | 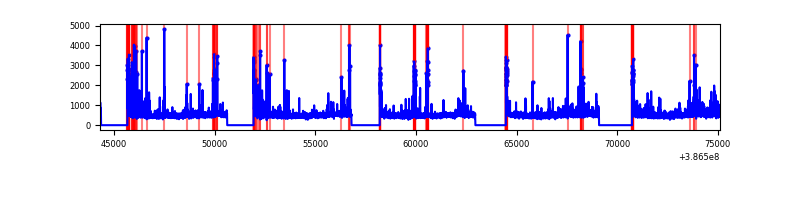 |
| D | 30815 | 23625 | 1069 | 1069 | 3.47% | 4.52% | 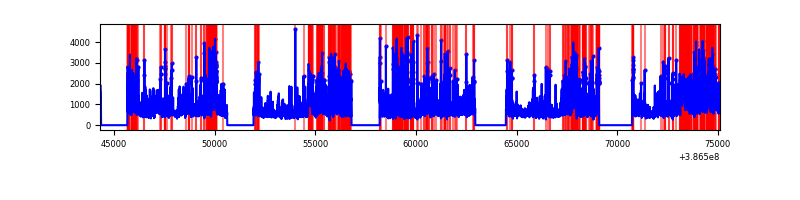 |
Top three noisy pixels from each quadrant. If the there are fewer than three noisy pixels in the level2.evt file, extra rows are filled as -1
| Pixel properties | Quadrant properties | ||||||
|---|---|---|---|---|---|---|---|
| Quadrant | DetID | PixID | Counts | Sigma | Mean | Median | Sigma |
| A | 10 | 83 | 323670 | 579.26 | 2773 | 2719 | 554.1 |
| A | 15 | 169 | 73609 | 127.94 | 2773 | 2719 | 554.1 |
| A | 9 | 143 | 63250 | 109.25 | 2773 | 2719 | 554.1 |
| B | 5 | 236 | 18754657 | 39400.12 | 2483 | 2412 | 475.9 |
| B | 3 | 112 | 330129 | 688.56 | 2483 | 2412 | 475.9 |
| B | 0 | 190 | 97971 | 200.78 | 2483 | 2412 | 475.9 |
| C | 15 | 214 | 976888 | 1573.66 | 2694 | 2718 | 619.0 |
| C | 0 | 10 | 797768 | 1284.31 | 2694 | 2718 | 619.0 |
| C | 1 | 23 | 465394 | 747.4 | 2694 | 2718 | 619.0 |
| D | 8 | 195 | 7554985 | 11708.33 | 2665 | 2592 | 645.0 |
| D | 2 | 250 | 1174805 | 1817.26 | 2665 | 2592 | 645.0 |
| D | 12 | 233 | 715247 | 1104.81 | 2665 | 2592 | 645.0 |
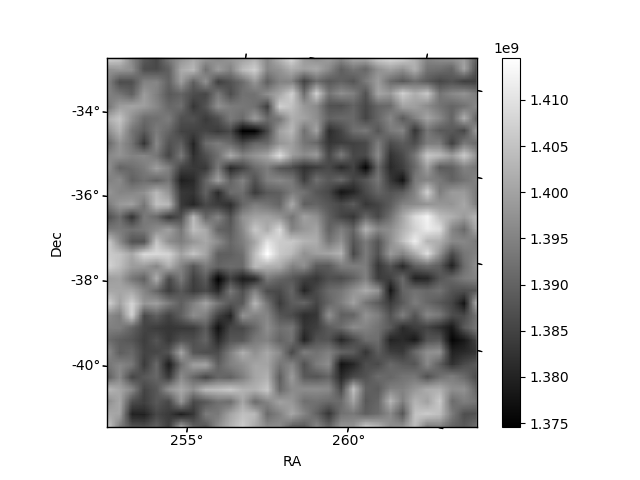
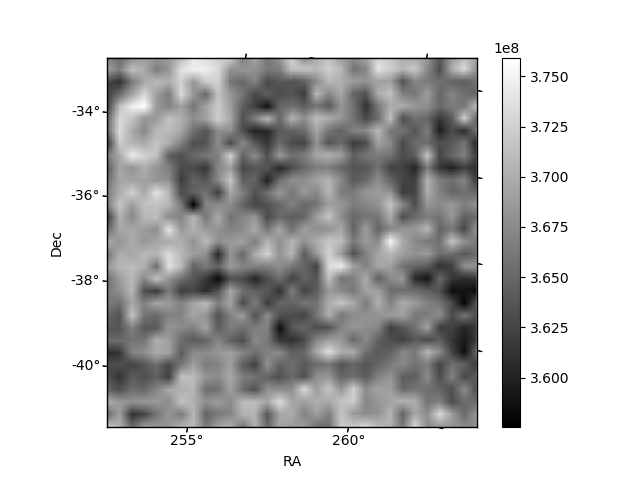
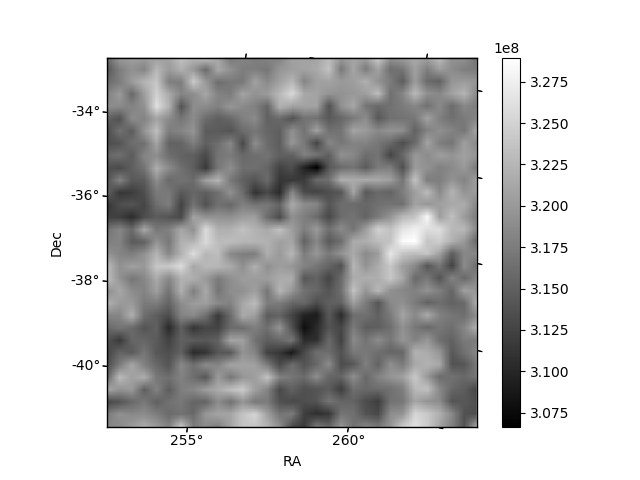
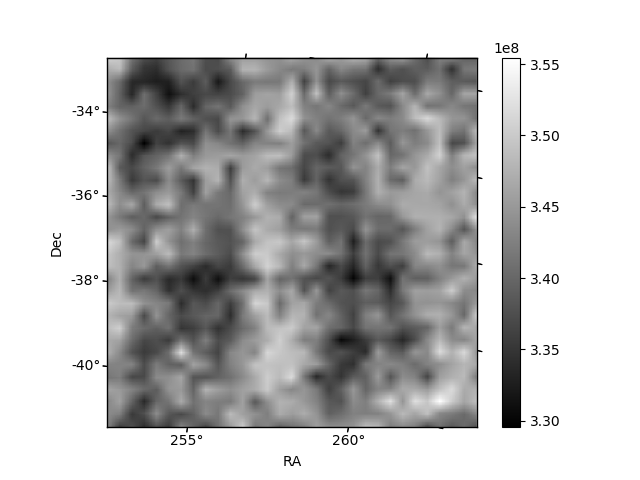
Histogram calculated using DETX and DETY for each event in the final _common_clean file
| Quadrant A | 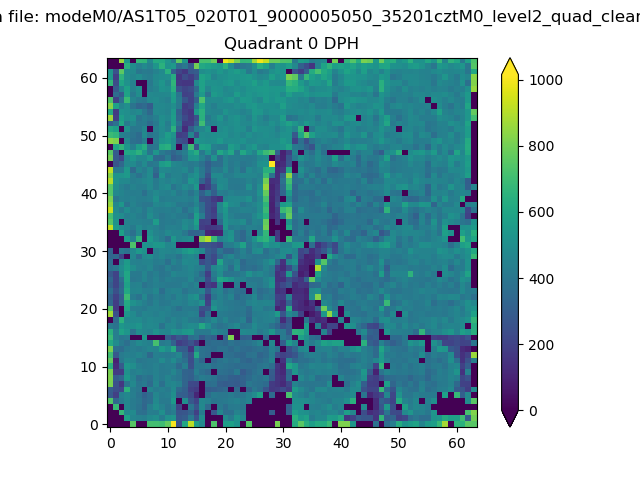 |
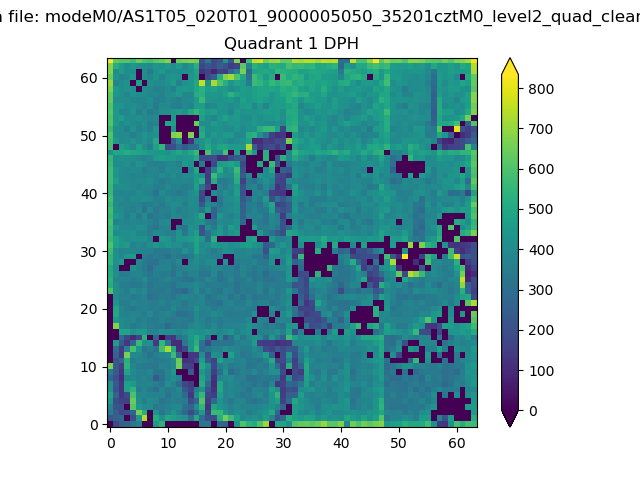 |
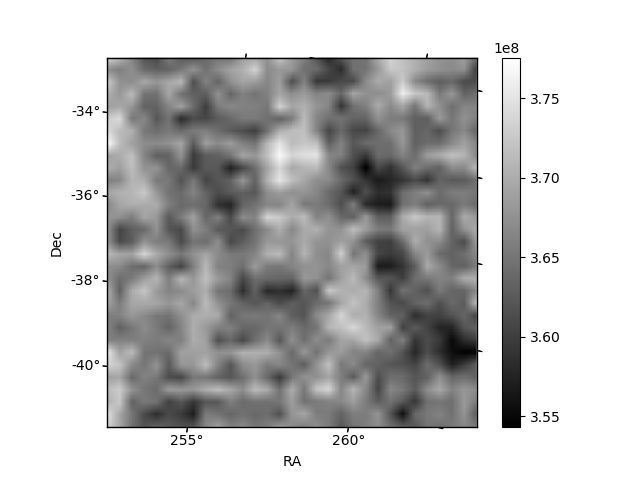
Quadrant B |
|---|---|---|---|
| Quadrant D | 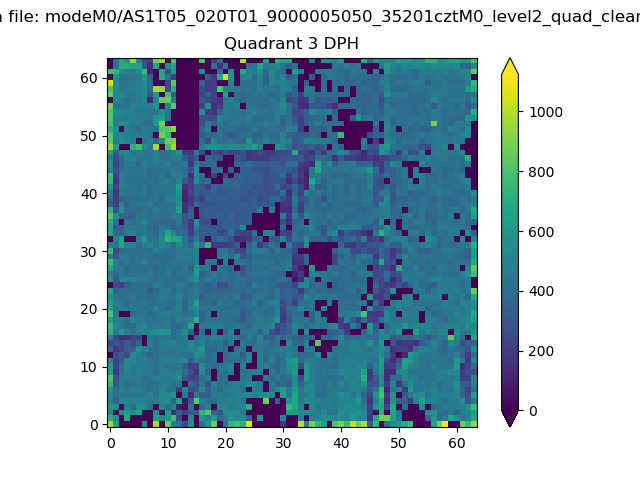 |
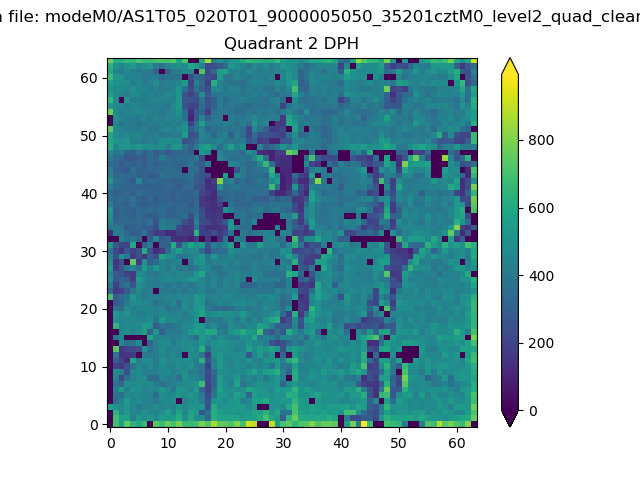 |
Quadrant C |
| Plot type | Count rate plots | Images |
|---|---|---|
| Comparison with Poisson distribution Blue bars denote a histogram of data divided into 1 sec bins. Red curve is a Poisson curve with rate = median count rate of data. |
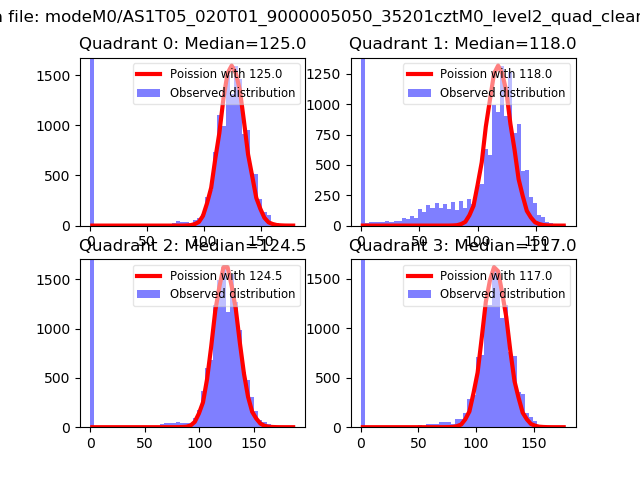 |
 |
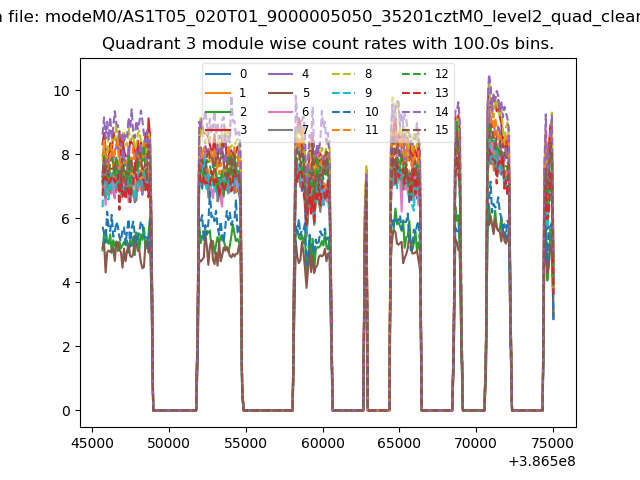
| Quadrant-wise count rates Data is divided into 100 sec bins |
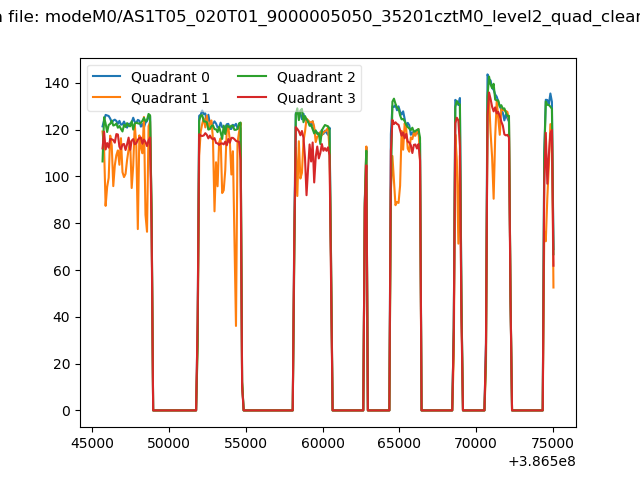 |
|
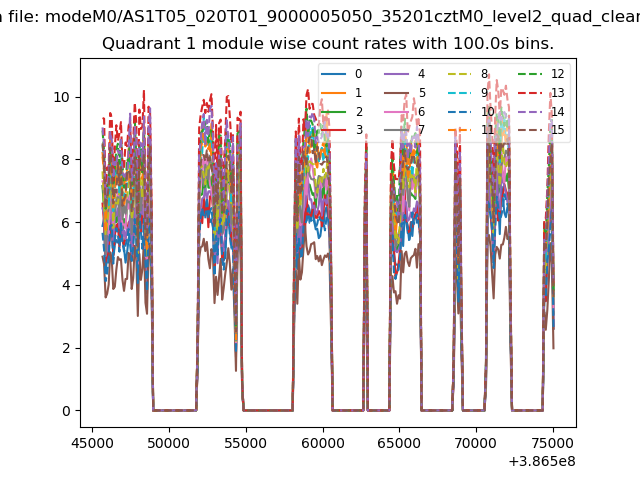
| Module-wise count rates for Quadrant A Data is divided into 100 sec bins |
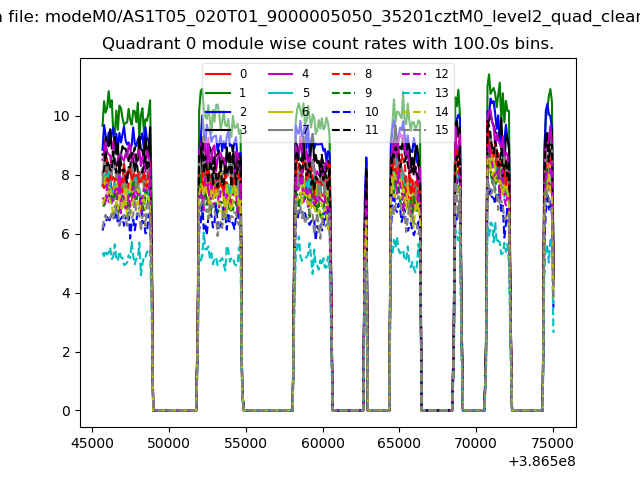 |
 |
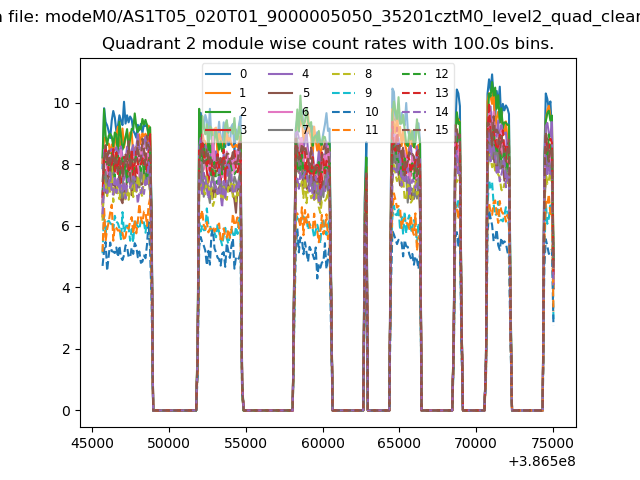
| Module-wise count rates for Quadrant B Data is divided into 100 sec bins |
 |
 |
| Module-wise count rates for Quadrant C Data is divided into 100 sec bins |
 |
 |
| Module-wise count rates for Quadrant D Data is divided into 100 sec bins |
 |
 |
| Parameter | Plot |
|---|---|
| CZT HV Monitor | 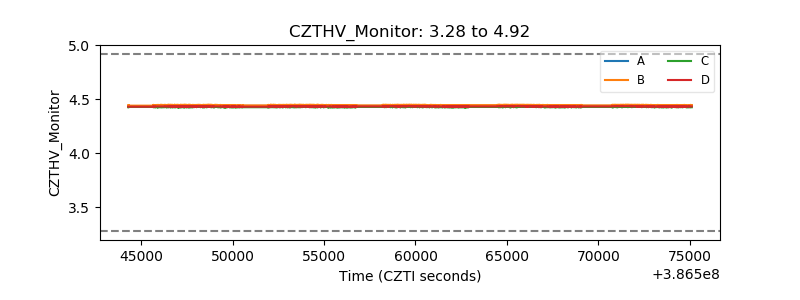 |
| D_VDD | 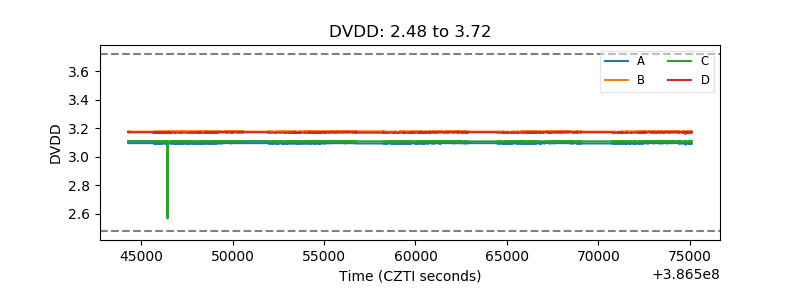 |
| Temperature 1 | 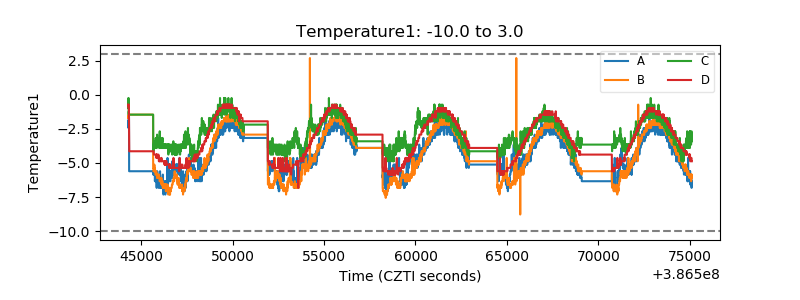 |
| Veto HV Monitor | 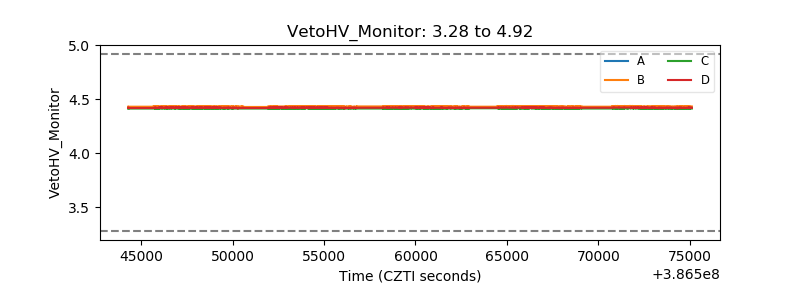 |
| Veto LLD | 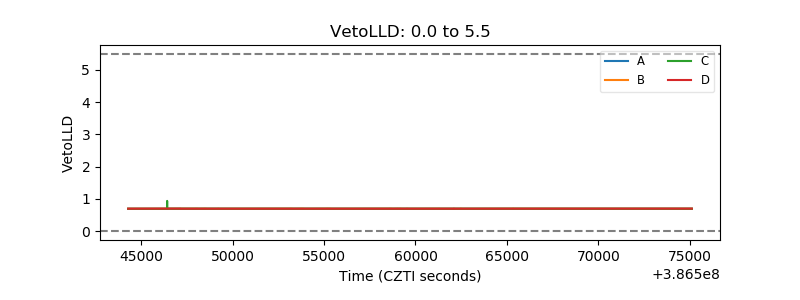 |
| Alpha Counter | 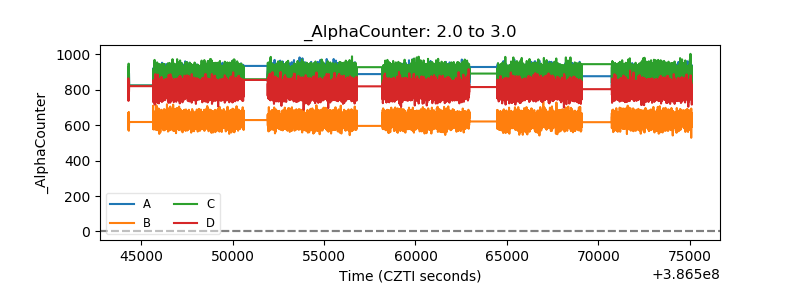 |
| _CPM_Rate | 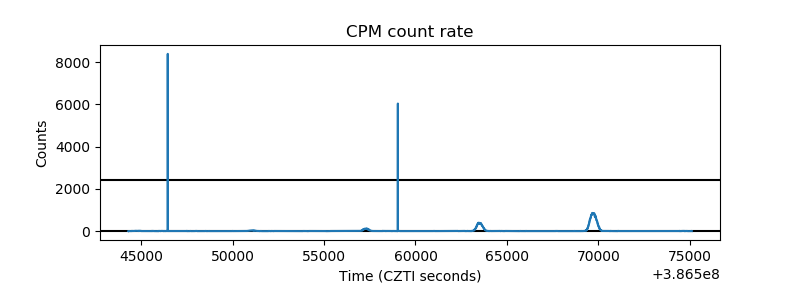 |
| CZT Counter | 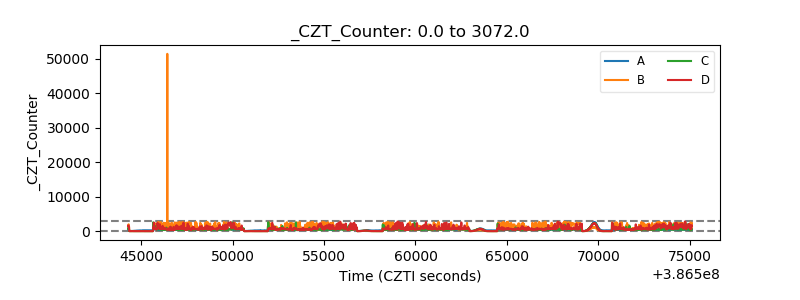 |
| +2.5 Volts monitor | 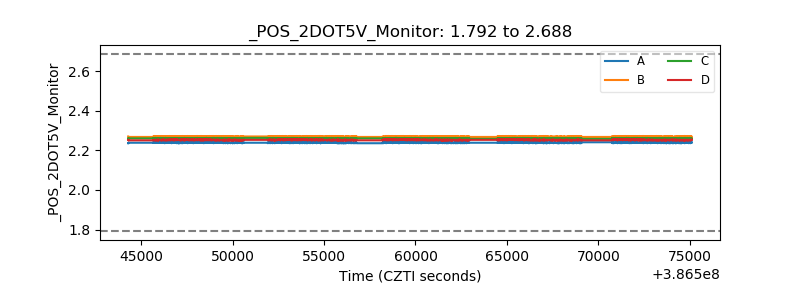 |
| +5 Volts monitor | 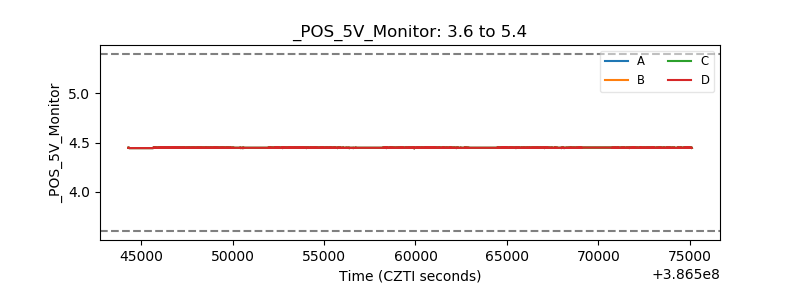 |
| _ROLL_ROT | 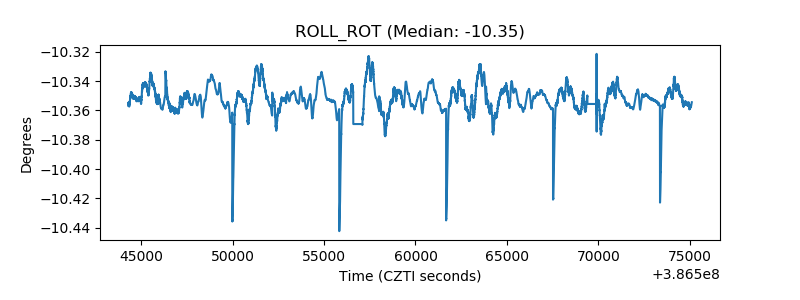 |
| _Roll_DEC | 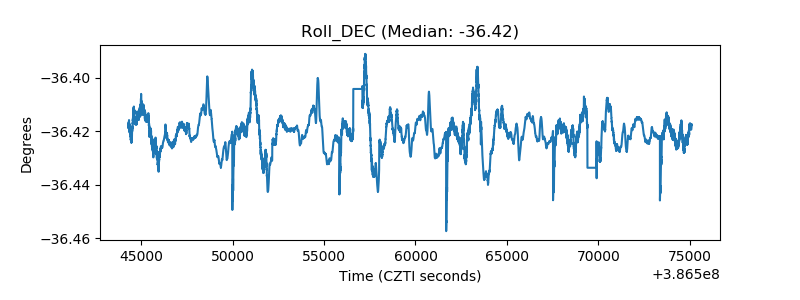 |
| _Roll_RA | 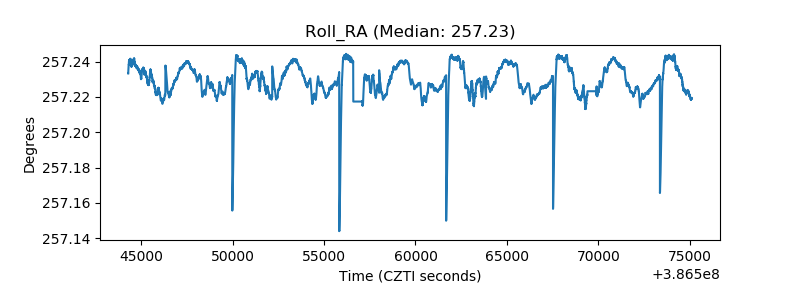 |
| Veto Counter | 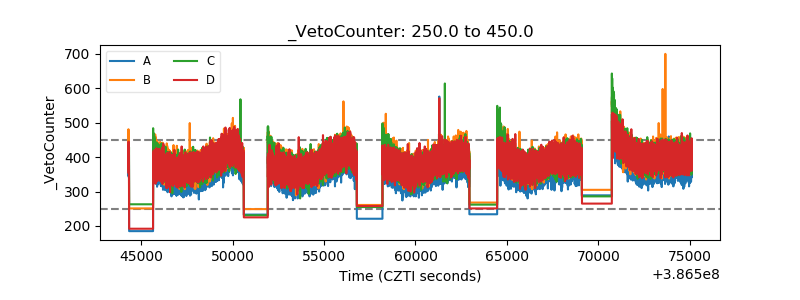 |