| Param | Original file | Final file |
|---|---|---|
| Filename | modeM0/AS1T05_020T01_9000005050_35195cztM0_level2.evt | modeM0/AS1T05_020T01_9000005050_35195cztM0_level2_quad_clean.evt |
| Size (bytes) | 716,094,720 | 86,751,360 |
| Size | 682.9 MB | 82.7 MB |
| Events in quadrant A | 3,148,966 | 575,928 |
| Events in quadrant B | 8,039,898 | 519,421 |
| Events in quadrant C | 3,641,336 | 564,459 |
| Events in quadrant D | 6,427,400 | 522,869 |
| Mode SS | |||
|---|---|---|---|
| Quadrant | BADHDUFLAG | Total packets | Discarded packets |
| A | 0 | 130 | 0 |
| B | 0 | 130 | 0 |
| C | 0 | 130 | 0 |
| D | 0 | 130 | 0 |
| Mode M0 | |||
|---|---|---|---|
| Quadrant | BADHDUFLAG | Total packets | Discarded packets |
| A | 0 | 13461 | 3 |
| B | 0 | 28356 | 2 |
| C | 0 | 14538 | 2 |
| D | 0 | 23519 | 2 |
| Mode M9 | |||
|---|---|---|---|
| Quadrant | BADHDUFLAG | Total packets | Discarded packets |
| A | 0 | 27 | 0 |
| B | 0 | 27 | 0 |
| C | 0 | 27 | 0 |
| D | 0 | 27 | 0 |
| Quadrant | Total seconds | Saturated seconds | Saturation percentage |
|---|---|---|---|
| A | 6364 | 15 | 0.235701% |
| B | 6364 | 1694 | 26.618479% |
| C | 6364 | 130 | 2.042740% |
| D | 6364 | 557 | 8.752357% |
Noise dominated data is calculated using 1-second bins in cleaned event files. If a bin has >2000 counts, and if more than 50% of those come from <1% of pixels, then it is considered to be noise-dominated and hence unusable.
| Quadrant | # 1 sec bins | Bins with >0 counts | Bins with >2000 counts | High rate bins dominated by noise | Noise dominated (total time) | Noise dominated (detector-on time) | Marked lightcurve |
|---|---|---|---|---|---|---|---|
| A | 9050 | 6366 | 6 | 6 | 0.07% | 0.09% | 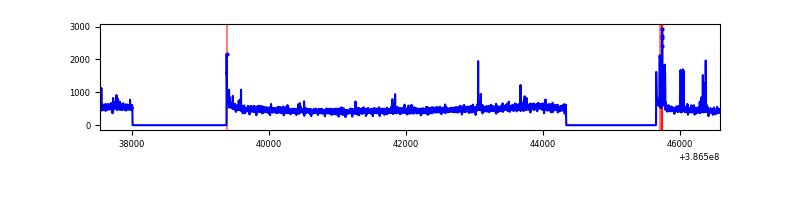 |
| B | 9050 | 6365 | 1077 | 1077 | 11.90% | 16.92% | 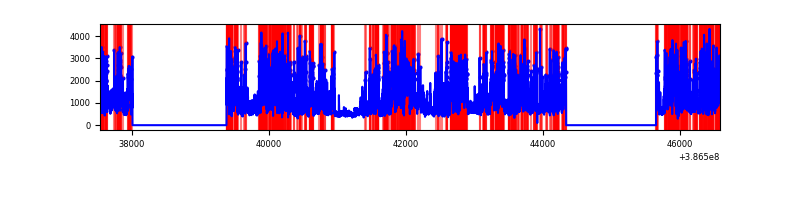 |
| C | 9050 | 6366 | 95 | 95 | 1.05% | 1.49% |  |
| D | 9050 | 6366 | 418 | 418 | 4.62% | 6.57% | 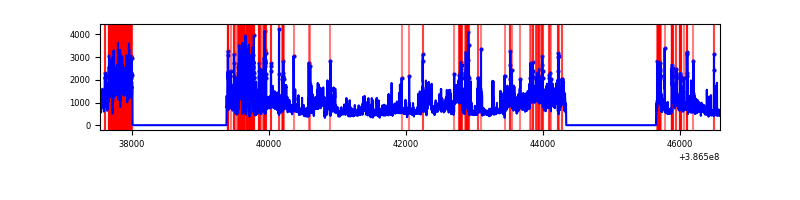 |
Top three noisy pixels from each quadrant. If the there are fewer than three noisy pixels in the level2.evt file, extra rows are filled as -1
| Pixel properties | Quadrant properties | ||||||
|---|---|---|---|---|---|---|---|
| Quadrant | DetID | PixID | Counts | Sigma | Mean | Median | Sigma |
| A | 10 | 83 | 107263 | 707.67 | 750 | 735 | 150.5 |
| A | 15 | 169 | 76402 | 502.66 | 750 | 735 | 150.5 |
| A | 13 | 6 | 23326 | 150.07 | 750 | 735 | 150.5 |
| B | 5 | 236 | 5100358 | 38487.08 | 680 | 662 | 132.5 |
| B | 4 | 232 | 65308 | 487.88 | 680 | 662 | 132.5 |
| B | 0 | 155 | 58521 | 436.66 | 680 | 662 | 132.5 |
| C | 0 | 10 | 439514 | 2600.7 | 724 | 730 | 168.7 |
| C | 15 | 214 | 265840 | 1571.32 | 724 | 730 | 168.7 |
| C | 1 | 23 | 58832 | 344.37 | 724 | 730 | 168.7 |
| D | 8 | 195 | 2352233 | 13450.74 | 710 | 690 | 174.8 |
| D | 10 | 118 | 365692 | 2087.8 | 710 | 690 | 174.8 |
| D | 2 | 250 | 248001 | 1414.61 | 710 | 690 | 174.8 |
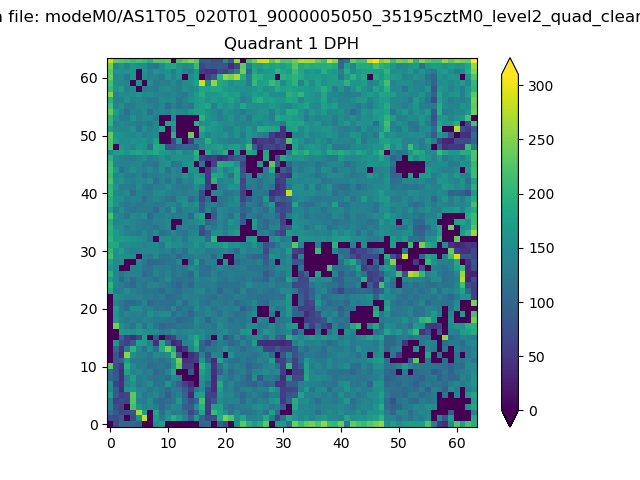
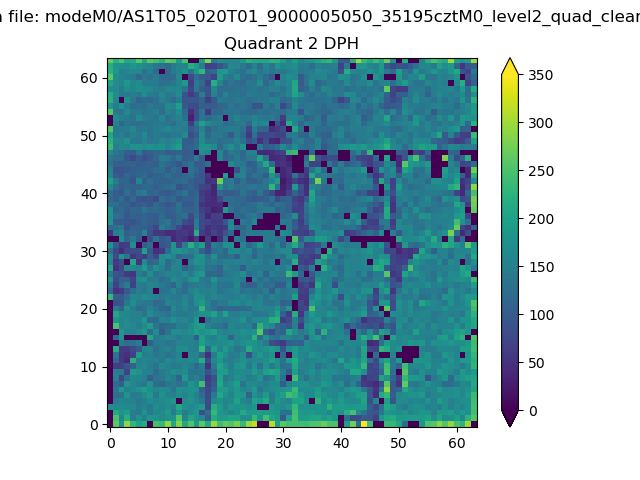
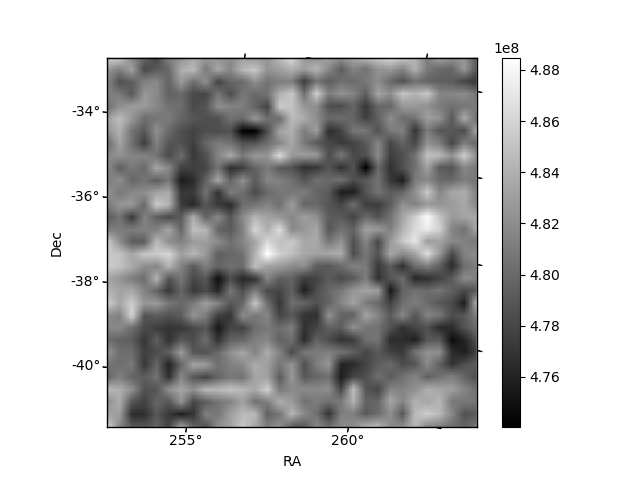
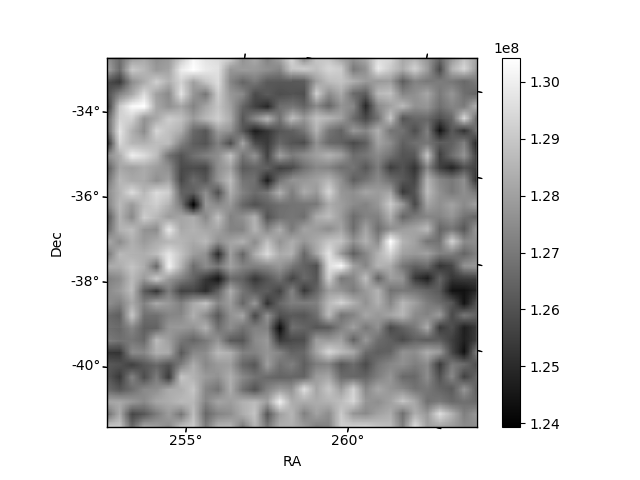
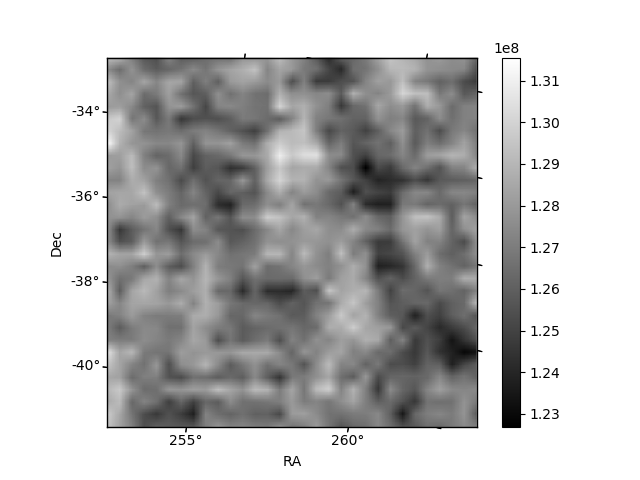
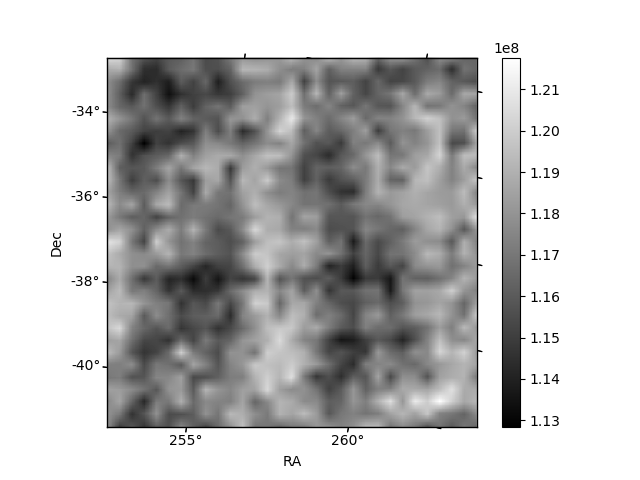
Histogram calculated using DETX and DETY for each event in the final _common_clean file
| Quadrant A | 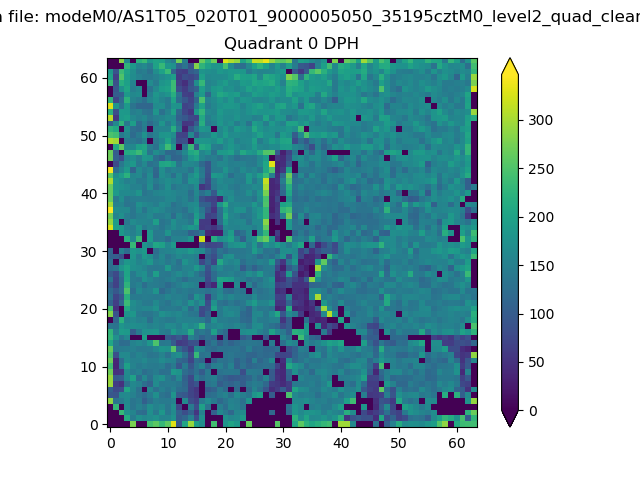 |
 |
Quadrant B |
|---|---|---|---|
| Quadrant D | 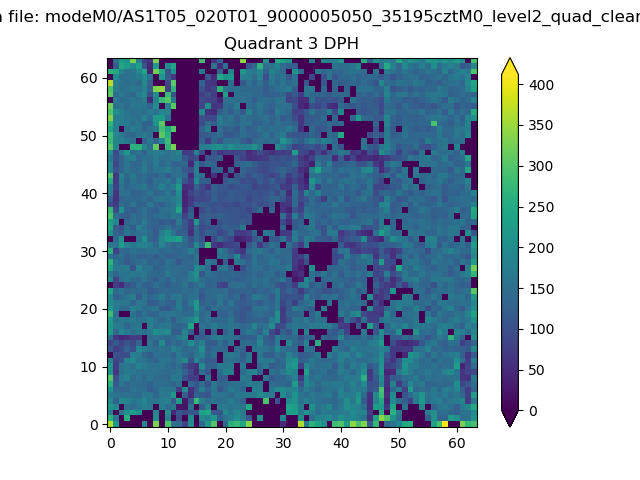 |
 |
Quadrant C |
| Plot type | Count rate plots | Images |
|---|---|---|
| Comparison with Poisson distribution Blue bars denote a histogram of data divided into 1 sec bins. Red curve is a Poisson curve with rate = median count rate of data. |
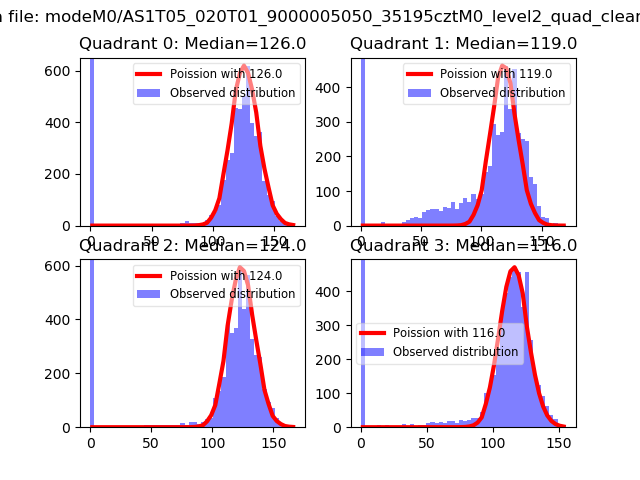 |
 |
| Quadrant-wise count rates Data is divided into 100 sec bins |
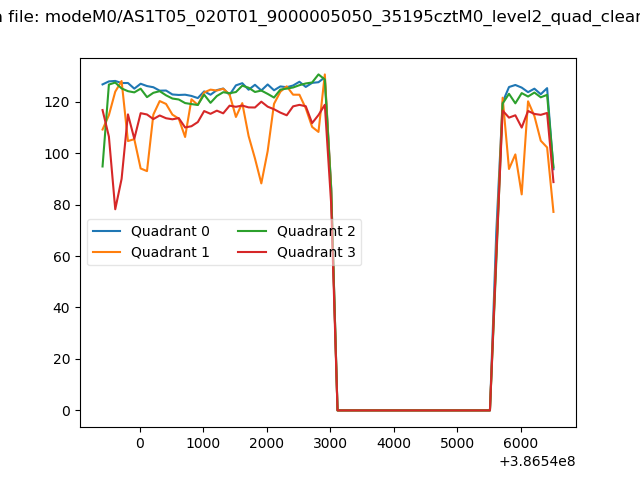 |
|
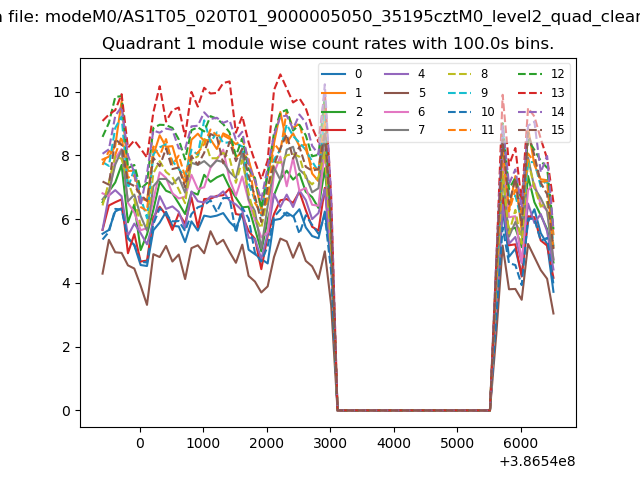
| Module-wise count rates for Quadrant A Data is divided into 100 sec bins |
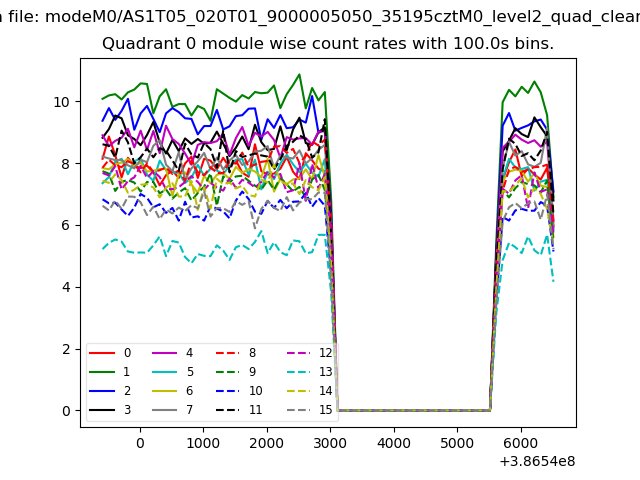 |
 |
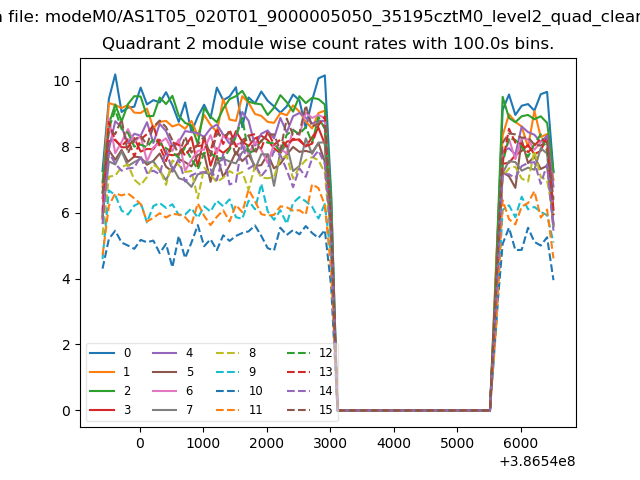
| Module-wise count rates for Quadrant B Data is divided into 100 sec bins |
 |
 |
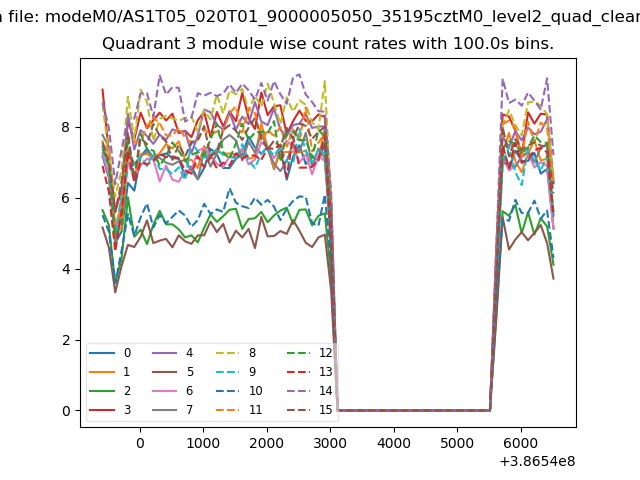
| Module-wise count rates for Quadrant C Data is divided into 100 sec bins |
 |
 |
| Module-wise count rates for Quadrant D Data is divided into 100 sec bins |
 |
 |
| Parameter | Plot |
|---|---|
| CZT HV Monitor | 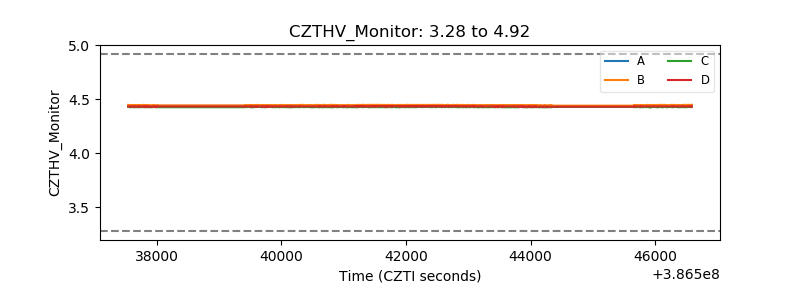 |
| D_VDD | 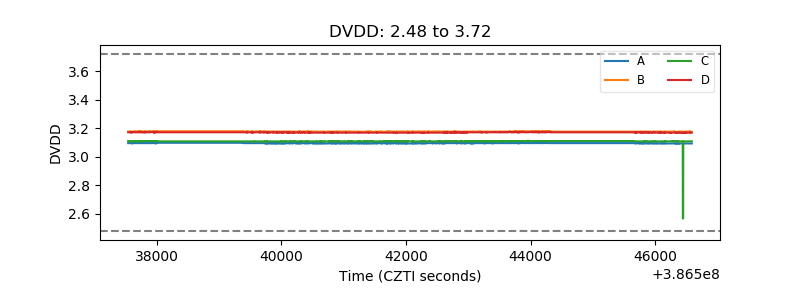 |
| Temperature 1 | 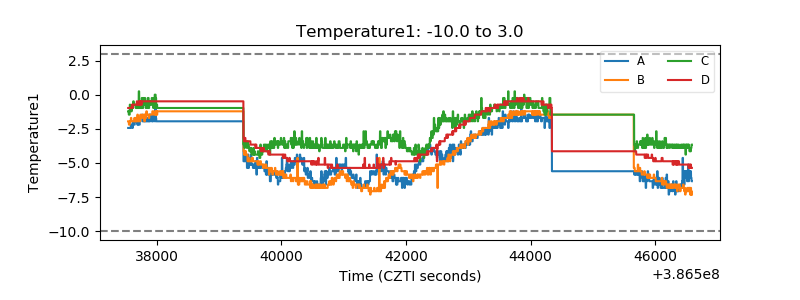 |
| Veto HV Monitor |  |
| Veto LLD | 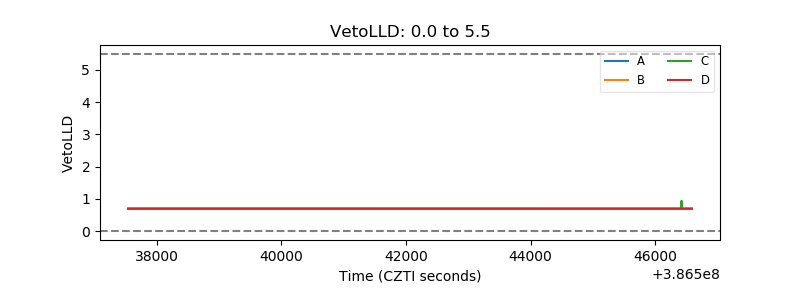 |
| Alpha Counter | 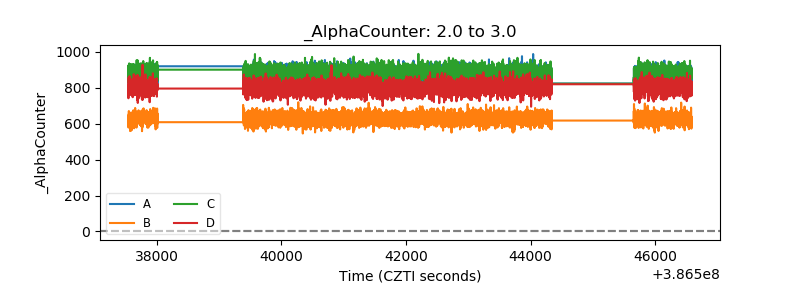 |
| _CPM_Rate | 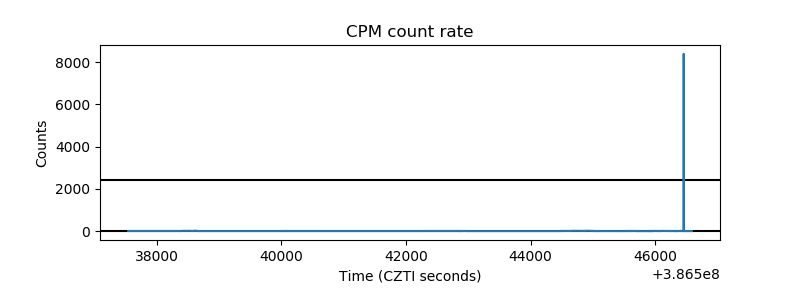 |
| CZT Counter | 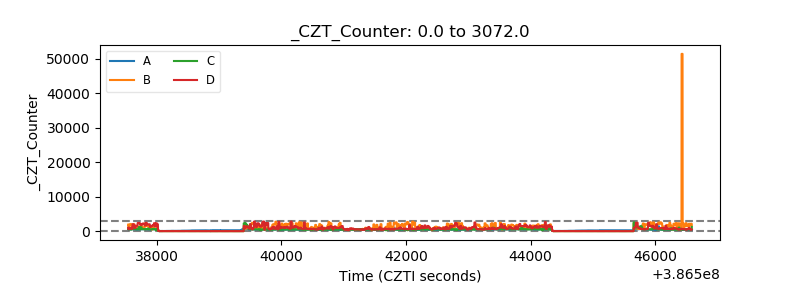 |
| +2.5 Volts monitor | 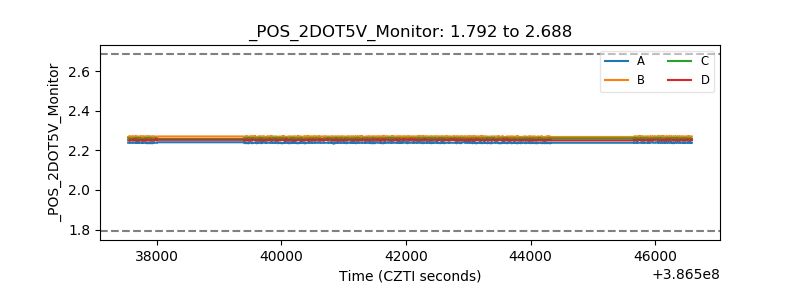 |
| +5 Volts monitor | 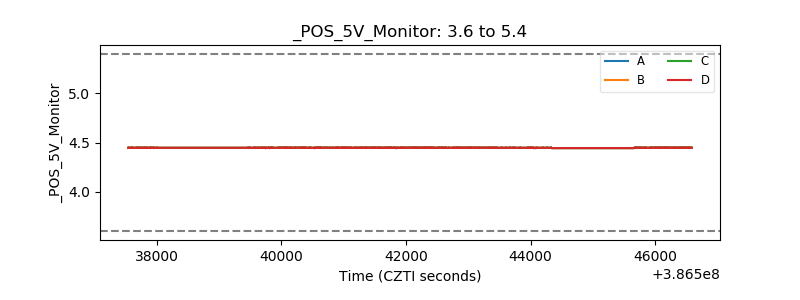 |
| _ROLL_ROT | 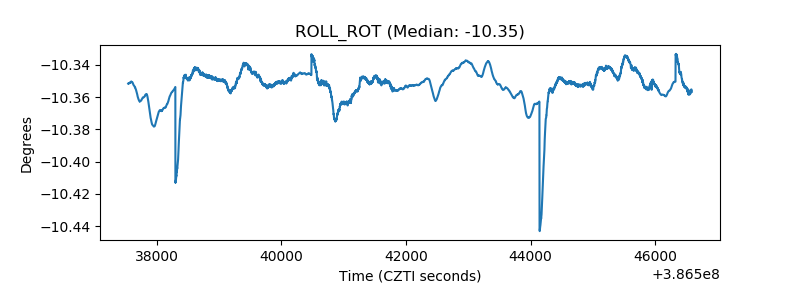 |
| _Roll_DEC | 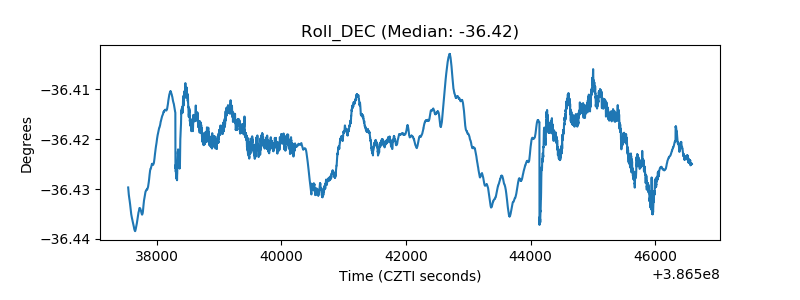 |
| _Roll_RA | 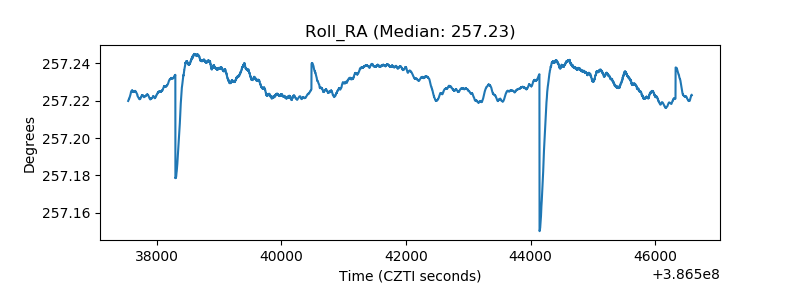 |
| Veto Counter | 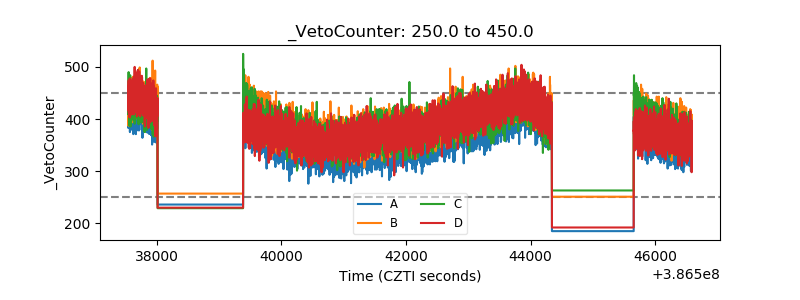 |