| Param | Original file | Final file |
|---|---|---|
| Filename | modeM0/AS1T05_020T01_9000005050_35194cztM0_level2.evt | modeM0/AS1T05_020T01_9000005050_35194cztM0_level2_quad_clean.evt |
| Size (bytes) | 715,619,520 | 84,746,880 |
| Size | 682.5 MB | 80.8 MB |
| Events in quadrant A | 2,801,810 | 578,639 |
| Events in quadrant B | 8,186,799 | 497,473 |
| Events in quadrant C | 3,378,014 | 569,547 |
| Events in quadrant D | 6,915,137 | 514,995 |
| Mode SS | |||
|---|---|---|---|
| Quadrant | BADHDUFLAG | Total packets | Discarded packets |
| A | 0 | 118 | 0 |
| B | 0 | 118 | 0 |
| C | 0 | 118 | 0 |
| D | 0 | 118 | 0 |
| Mode M0 | |||
|---|---|---|---|
| Quadrant | BADHDUFLAG | Total packets | Discarded packets |
| A | 0 | 12029 | 3 |
| B | 0 | 28374 | 2 |
| C | 0 | 13452 | 2 |
| D | 0 | 24675 | 2 |
| Mode M9 | |||
|---|---|---|---|
| Quadrant | BADHDUFLAG | Total packets | Discarded packets |
| A | 0 | 14 | 0 |
| B | 0 | 14 | 0 |
| C | 0 | 14 | 0 |
| D | 0 | 15 | 0 |
| Quadrant | Total seconds | Saturated seconds | Saturation percentage |
|---|---|---|---|
| A | 5791 | 11 | 0.189950% |
| B | 5791 | 1931 | 33.344845% |
| C | 5791 | 142 | 2.452081% |
| D | 5791 | 840 | 14.505267% |
Noise dominated data is calculated using 1-second bins in cleaned event files. If a bin has >2000 counts, and if more than 50% of those come from <1% of pixels, then it is considered to be noise-dominated and hence unusable.
| Quadrant | # 1 sec bins | Bins with >0 counts | Bins with >2000 counts | High rate bins dominated by noise | Noise dominated (total time) | Noise dominated (detector-on time) | Marked lightcurve |
|---|---|---|---|---|---|---|---|
| A | 7164 | 5792 | 3 | 3 | 0.04% | 0.05% | 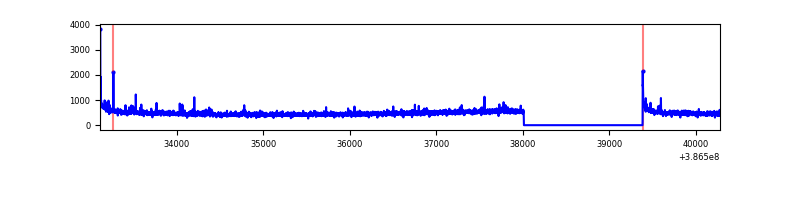 |
| B | 7164 | 5791 | 1293 | 1293 | 18.05% | 22.33% | 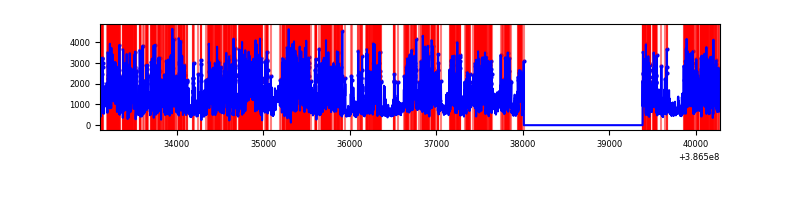 |
| C | 7164 | 5792 | 105 | 105 | 1.47% | 1.81% | 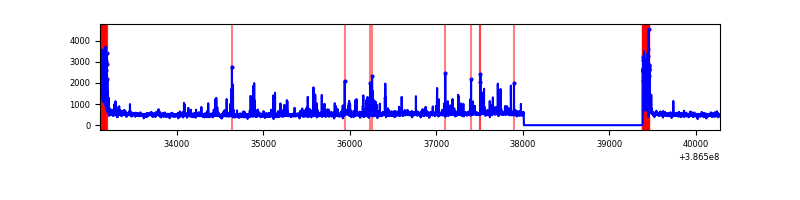 |
| D | 7164 | 5792 | 747 | 747 | 10.43% | 12.90% | 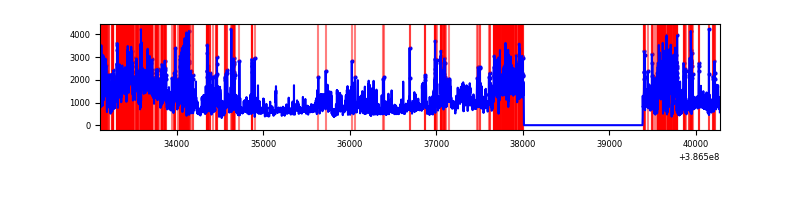 |
Top three noisy pixels from each quadrant. If the there are fewer than three noisy pixels in the level2.evt file, extra rows are filled as -1
| Pixel properties | Quadrant properties | ||||||
|---|---|---|---|---|---|---|---|
| Quadrant | DetID | PixID | Counts | Sigma | Mean | Median | Sigma |
| A | 10 | 83 | 103142 | 743.71 | 678 | 664 | 137.8 |
| A | 7 | 191 | 17089 | 119.2 | 678 | 664 | 137.8 |
| A | 13 | 6 | 16796 | 117.07 | 678 | 664 | 137.8 |
| B | 5 | 236 | 5705353 | 49567.11 | 593 | 577 | 115.1 |
| B | 3 | 112 | 50575 | 434.42 | 593 | 577 | 115.1 |
| B | 0 | 189 | 25673 | 218.05 | 593 | 577 | 115.1 |
| C | 0 | 10 | 542697 | 3584.1 | 654 | 660 | 151.2 |
| C | 15 | 214 | 239984 | 1582.48 | 654 | 660 | 151.2 |
| C | 14 | 67 | 17065 | 108.47 | 654 | 660 | 151.2 |
| D | 8 | 195 | 2810205 | 18147.06 | 627 | 609 | 154.8 |
| D | 10 | 118 | 559353 | 3608.9 | 627 | 609 | 154.8 |
| D | 2 | 249 | 253971 | 1636.45 | 627 | 609 | 154.8 |
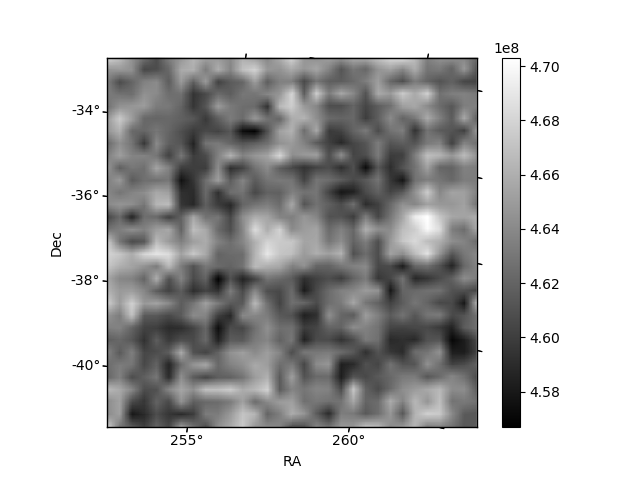
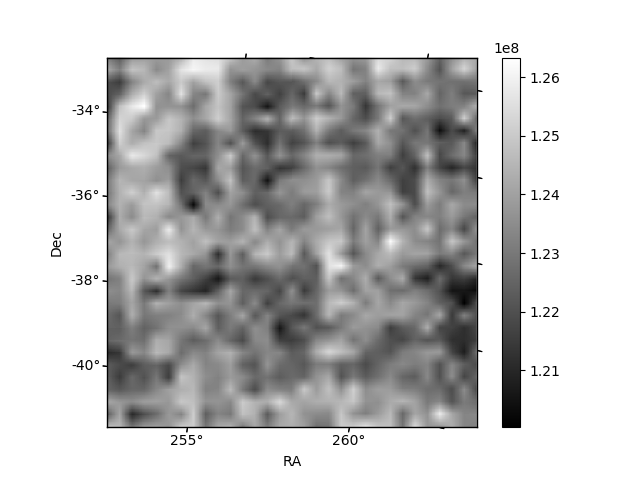
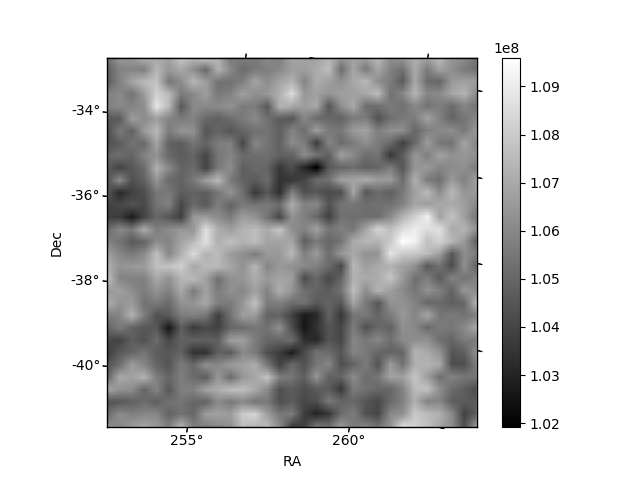
Histogram calculated using DETX and DETY for each event in the final _common_clean file
| Quadrant A | 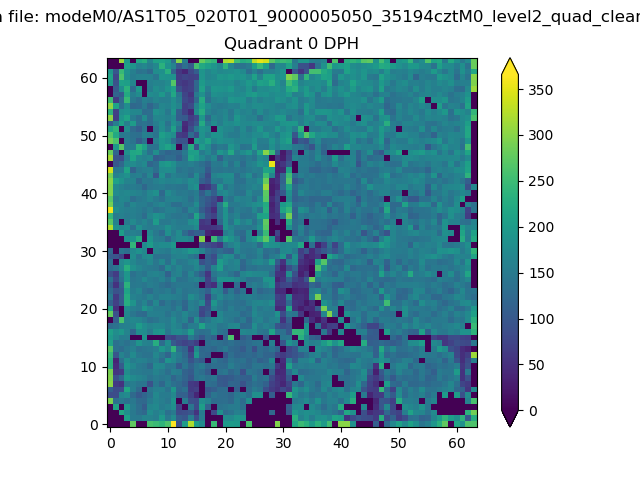 |
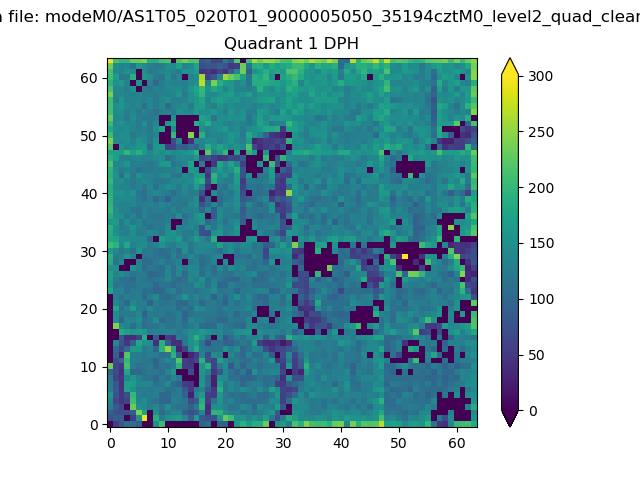 |
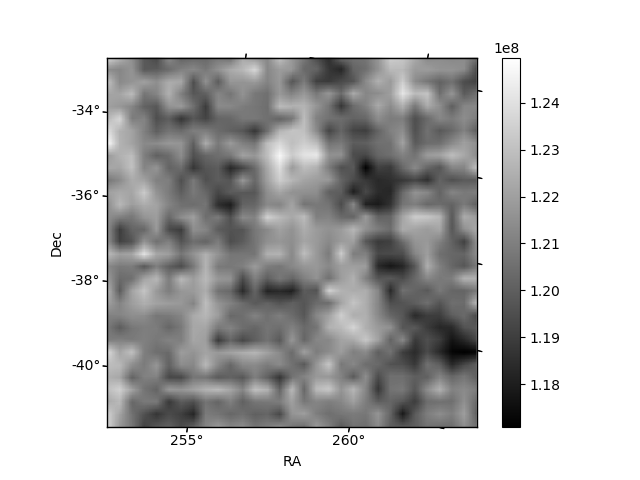
Quadrant B |
|---|---|---|---|
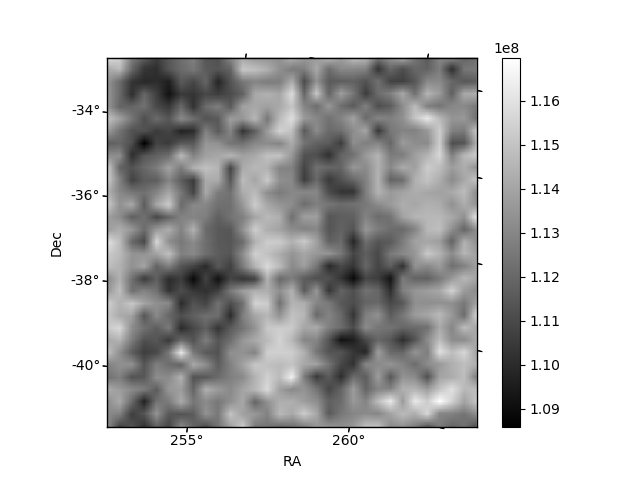
| Quadrant D | 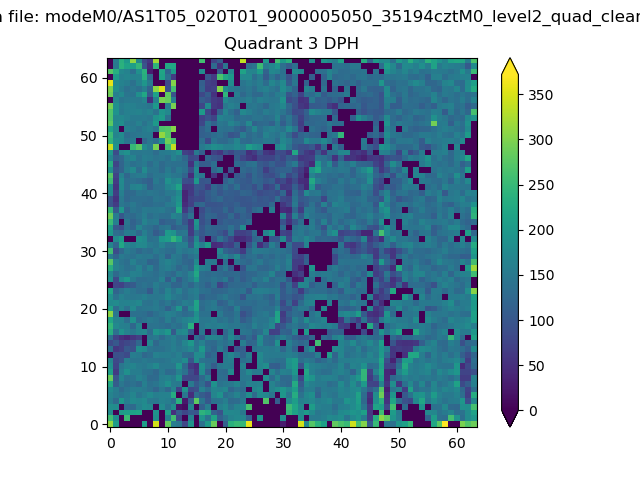 |
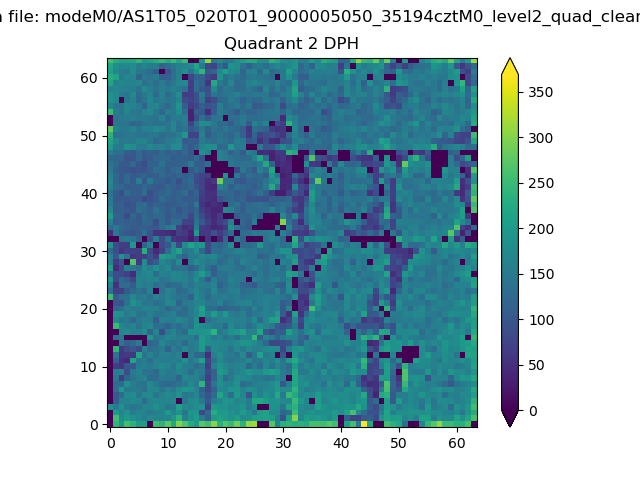 |
Quadrant C |
| Plot type | Count rate plots | Images |
|---|---|---|
| Comparison with Poisson distribution Blue bars denote a histogram of data divided into 1 sec bins. Red curve is a Poisson curve with rate = median count rate of data. |
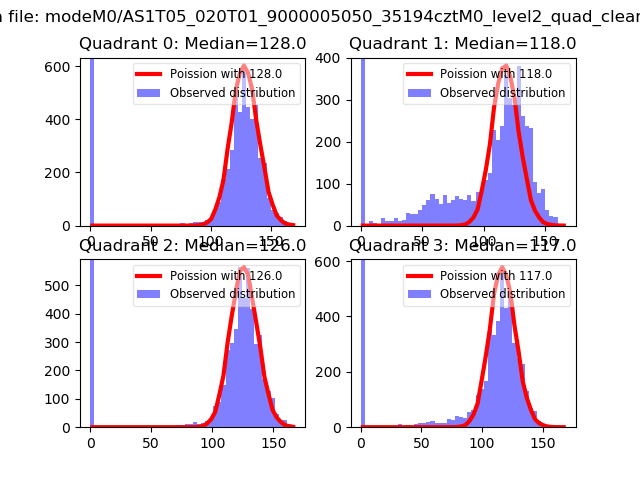 |
 |
| Quadrant-wise count rates Data is divided into 100 sec bins |
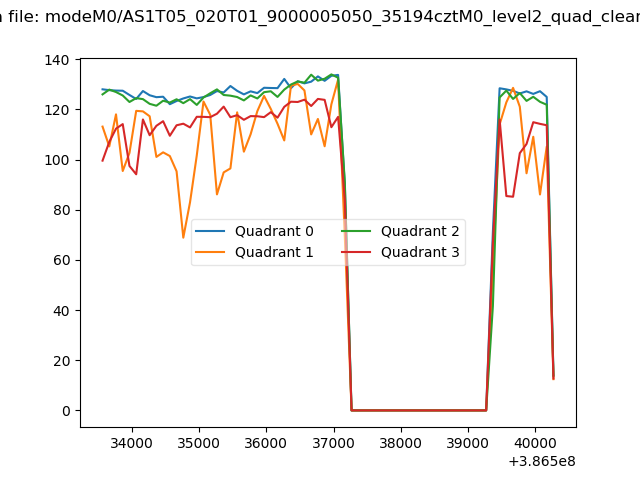 |
|
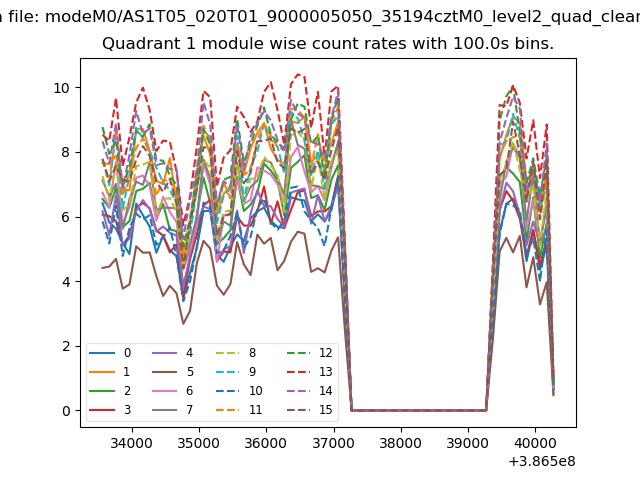
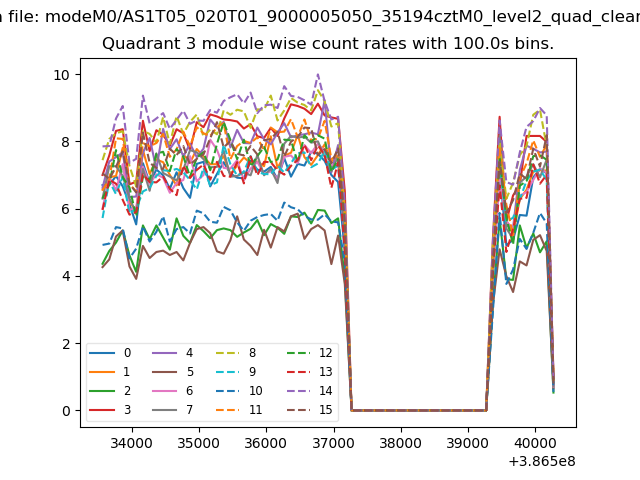
| Module-wise count rates for Quadrant A Data is divided into 100 sec bins |
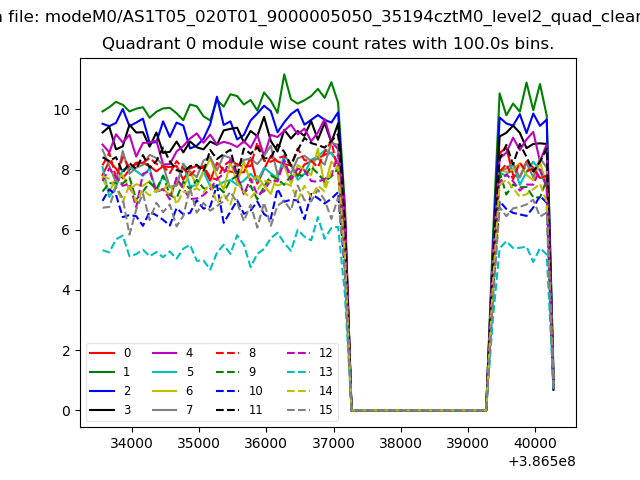 |
 |
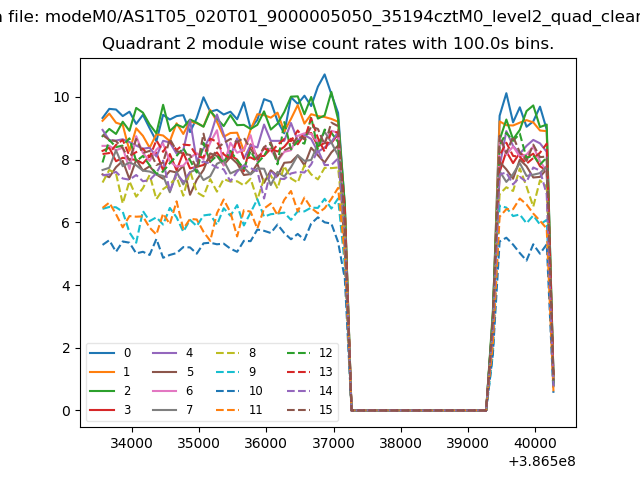
| Module-wise count rates for Quadrant B Data is divided into 100 sec bins |
 |
 |
| Module-wise count rates for Quadrant C Data is divided into 100 sec bins |
 |
 |
| Module-wise count rates for Quadrant D Data is divided into 100 sec bins |
 |
 |
| Parameter | Plot |
|---|---|
| CZT HV Monitor | 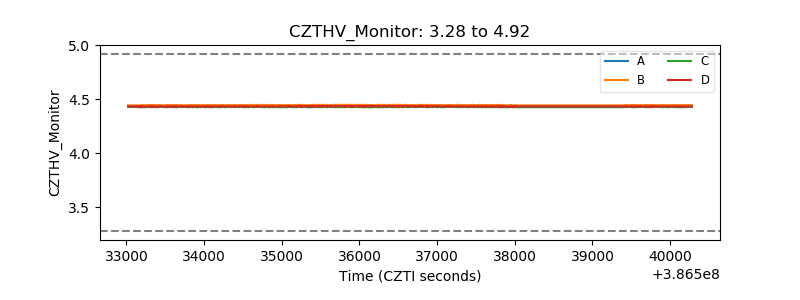 |
| D_VDD | 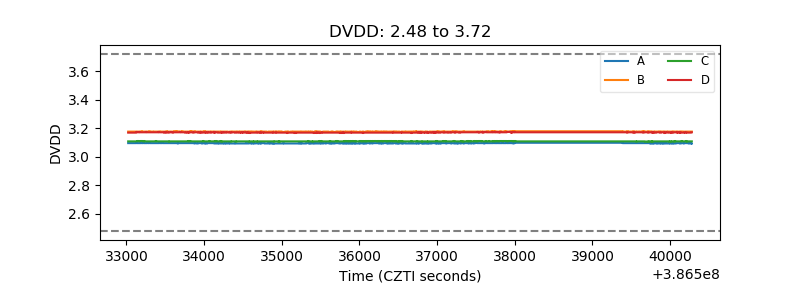 |
| Temperature 1 | 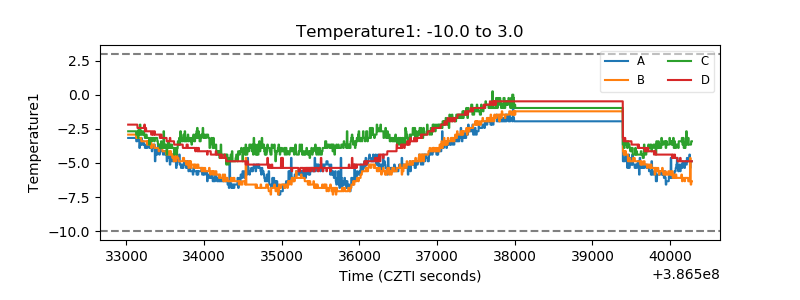 |
| Veto HV Monitor | 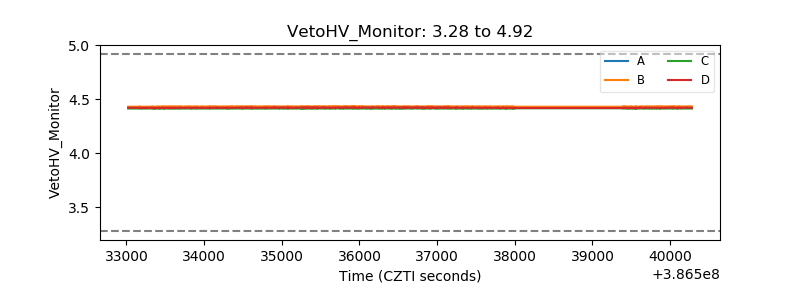 |
| Veto LLD | 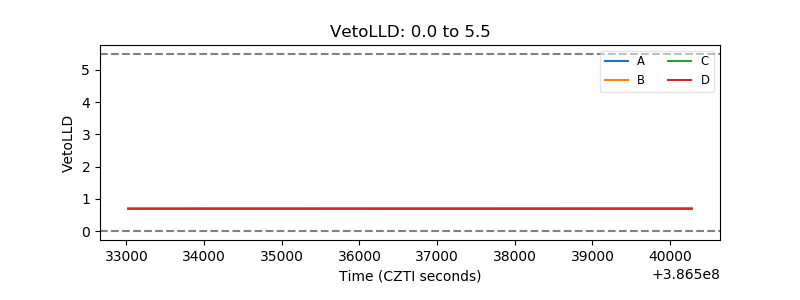 |
| Alpha Counter | 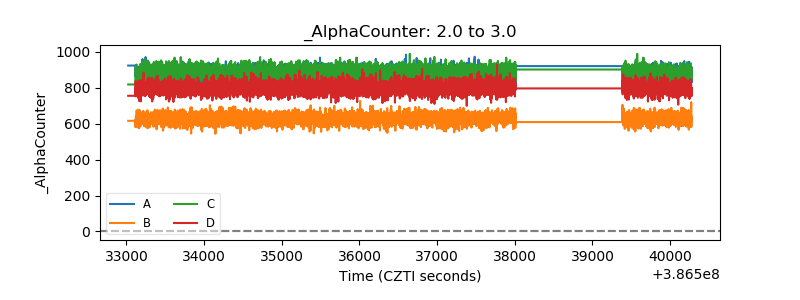 |
| _CPM_Rate | 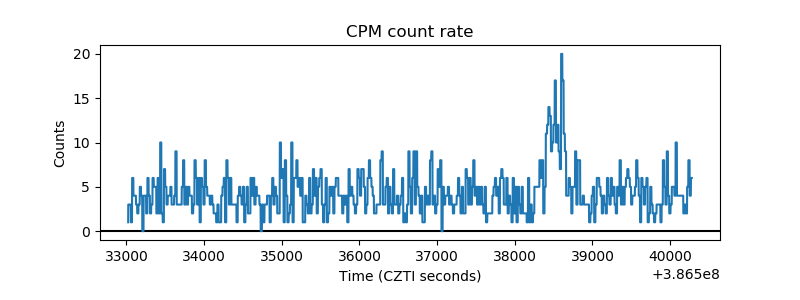 |
| CZT Counter | 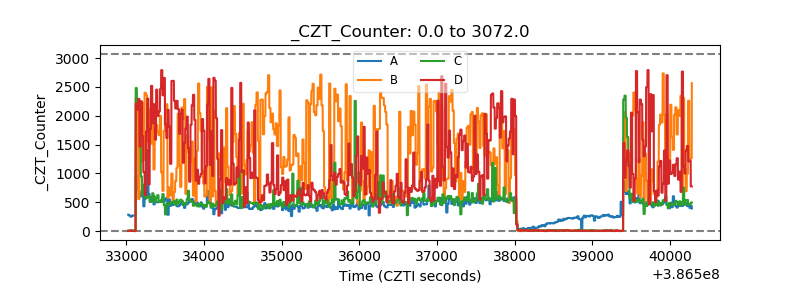 |
| +2.5 Volts monitor | 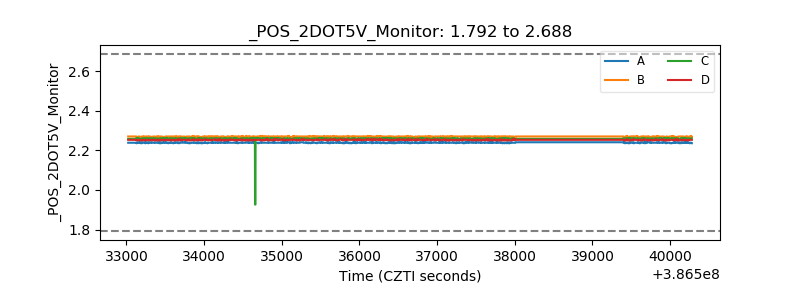 |
| +5 Volts monitor | 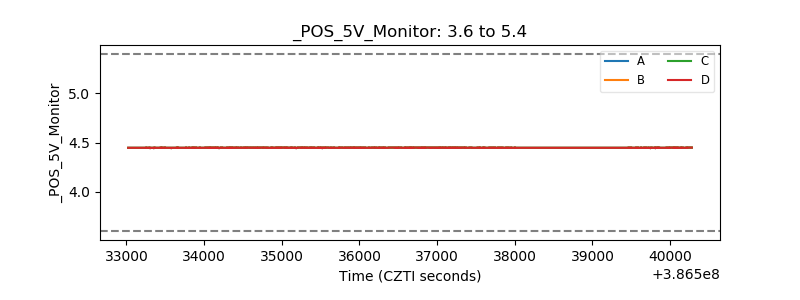 |
| _ROLL_ROT | 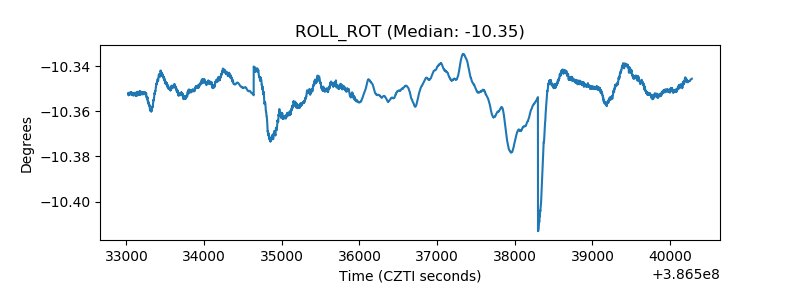 |
| _Roll_DEC | 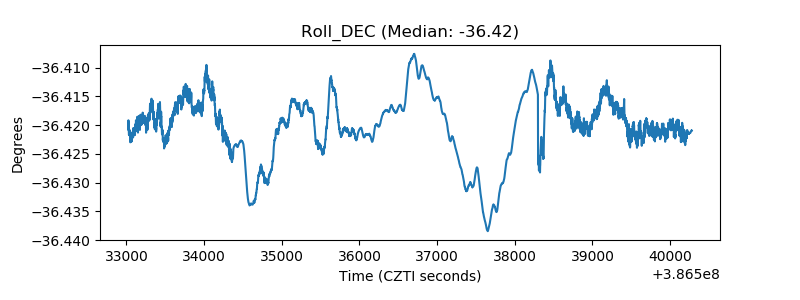 |
| _Roll_RA | 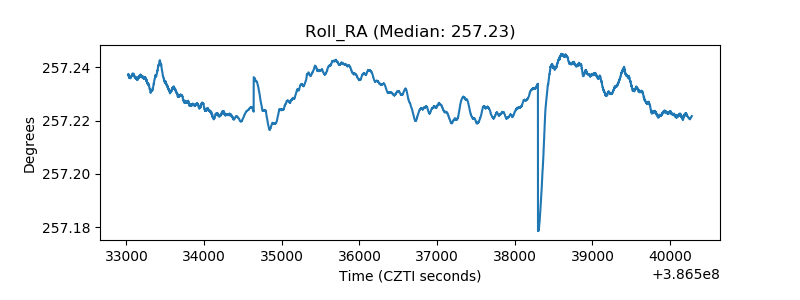 |
| Veto Counter | 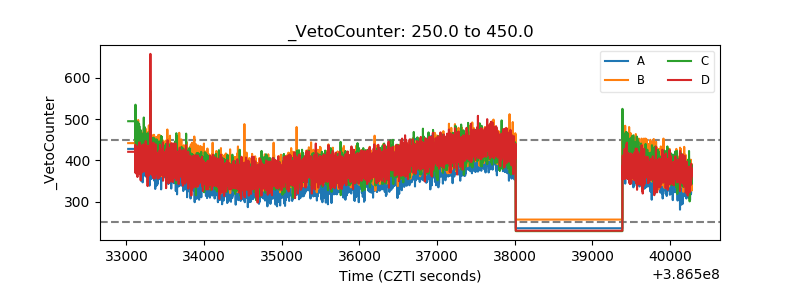 |