| Param | Original file | Final file |
|---|---|---|
| Filename | modeM0/AS1T05_020T01_9000005050_35192cztM0_level2.evt | modeM0/AS1T05_020T01_9000005050_35192cztM0_level2_quad_clean.evt |
| Size (bytes) | 678,919,680 | 63,083,520 |
| Size | 647.5 MB | 60.2 MB |
| Events in quadrant A | 2,602,351 | 412,621 |
| Events in quadrant B | 7,332,528 | 364,021 |
| Events in quadrant C | 3,301,725 | 401,776 |
| Events in quadrant D | 6,978,793 | 371,897 |
| Mode SS | |||
|---|---|---|---|
| Quadrant | BADHDUFLAG | Total packets | Discarded packets |
| A | 0 | 104 | 0 |
| B | 0 | 104 | 0 |
| C | 0 | 104 | 0 |
| D | 0 | 104 | 0 |
| Mode M0 | |||
|---|---|---|---|
| Quadrant | BADHDUFLAG | Total packets | Discarded packets |
| A | 0 | 10871 | 3 |
| B | 0 | 25328 | 2 |
| C | 0 | 12895 | 2 |
| D | 0 | 24316 | 2 |
| Mode M9 | |||
|---|---|---|---|
| Quadrant | BADHDUFLAG | Total packets | Discarded packets |
| A | 0 | 32 | 0 |
| B | 0 | 32 | 0 |
| C | 0 | 32 | 0 |
| D | 0 | 33 | 0 |
| Quadrant | Total seconds | Saturated seconds | Saturation percentage |
|---|---|---|---|
| A | 5129 | 20 | 0.389940% |
| B | 5129 | 1829 | 35.659973% |
| C | 5129 | 183 | 3.567947% |
| D | 5129 | 793 | 15.461104% |
Noise dominated data is calculated using 1-second bins in cleaned event files. If a bin has >2000 counts, and if more than 50% of those come from <1% of pixels, then it is considered to be noise-dominated and hence unusable.
| Quadrant | # 1 sec bins | Bins with >0 counts | Bins with >2000 counts | High rate bins dominated by noise | Noise dominated (total time) | Noise dominated (detector-on time) | Marked lightcurve |
|---|---|---|---|---|---|---|---|
| A | 7102 | 5130 | 7 | 7 | 0.10% | 0.14% | 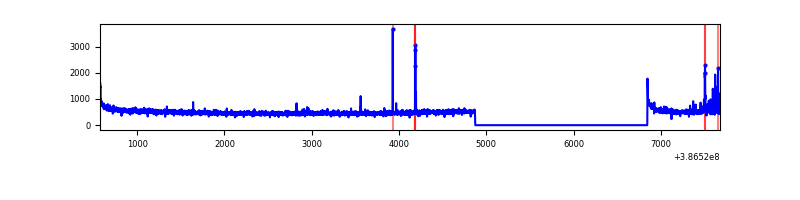 |
| B | 7102 | 5130 | 1243 | 1243 | 17.50% | 24.23% | 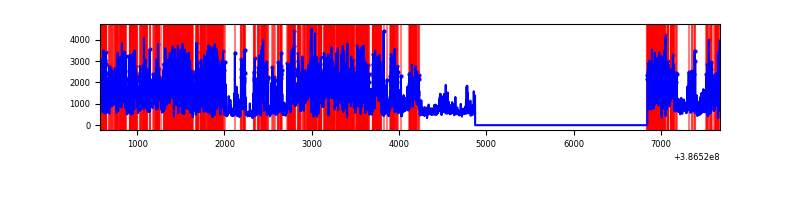 |
| C | 7102 | 5130 | 143 | 143 | 2.01% | 2.79% | 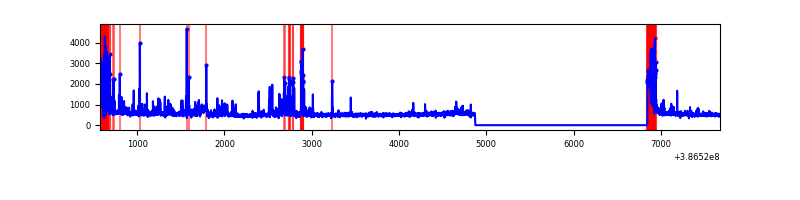 |
| D | 7102 | 5130 | 985 | 985 | 13.87% | 19.20% | 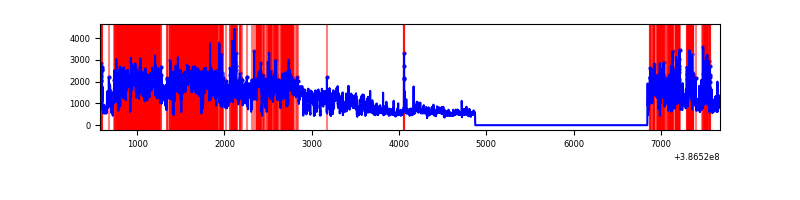 |
Top three noisy pixels from each quadrant. If the there are fewer than three noisy pixels in the level2.evt file, extra rows are filled as -1
| Pixel properties | Quadrant properties | ||||||
|---|---|---|---|---|---|---|---|
| Quadrant | DetID | PixID | Counts | Sigma | Mean | Median | Sigma |
| A | 10 | 83 | 100341 | 789.87 | 623 | 612 | 126.3 |
| A | 10 | 255 | 60035 | 470.64 | 623 | 612 | 126.3 |
| A | 9 | 143 | 22582 | 174.01 | 623 | 612 | 126.3 |
| B | 5 | 236 | 5079196 | 49547.43 | 535 | 523 | 102.5 |
| B | 5 | 172 | 52096 | 503.15 | 535 | 523 | 102.5 |
| B | 4 | 232 | 31217 | 299.45 | 535 | 523 | 102.5 |
| C | 0 | 10 | 386418 | 2804.11 | 591 | 597 | 137.6 |
| C | 1 | 23 | 299350 | 2171.31 | 591 | 597 | 137.6 |
| C | 15 | 214 | 212130 | 1537.4 | 591 | 597 | 137.6 |
| D | 8 | 195 | 4014040 | 27953.86 | 583 | 567 | 143.6 |
| D | 12 | 233 | 242126 | 1682.46 | 583 | 567 | 143.6 |
| D | 10 | 118 | 153852 | 1067.63 | 583 | 567 | 143.6 |
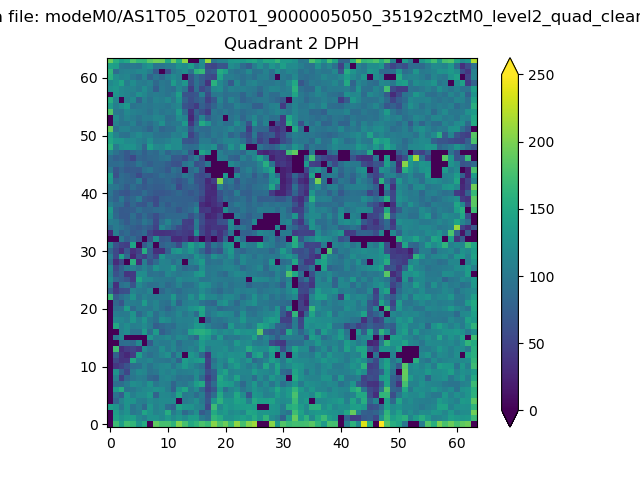
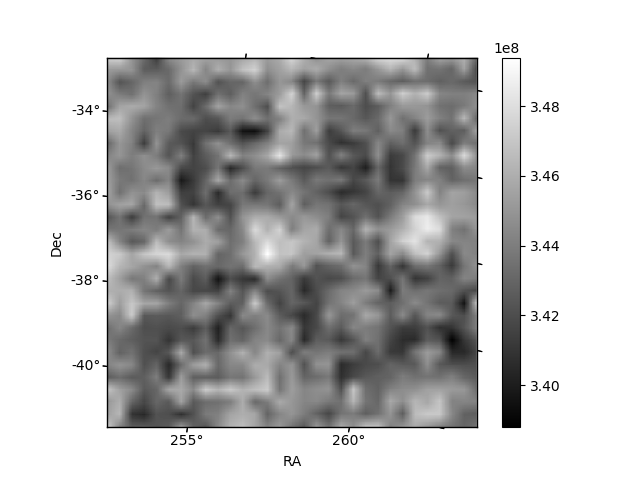
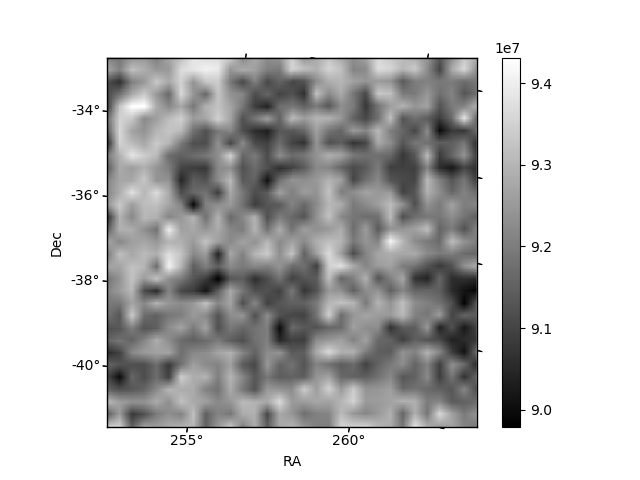
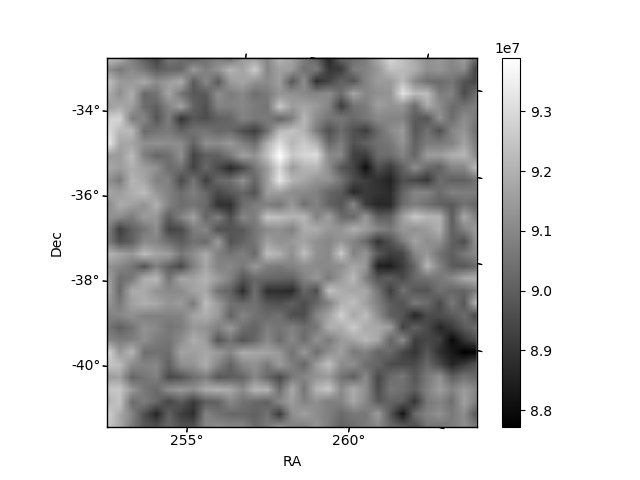
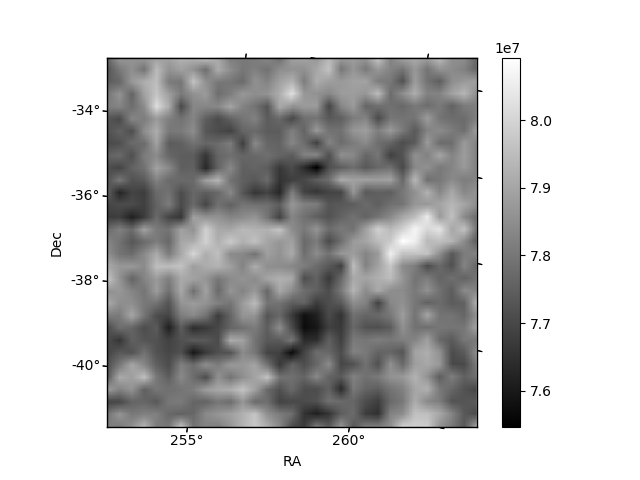
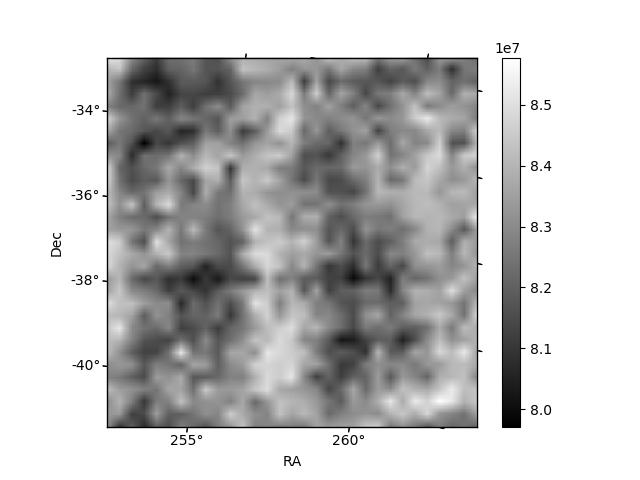
Histogram calculated using DETX and DETY for each event in the final _common_clean file
| Quadrant A | 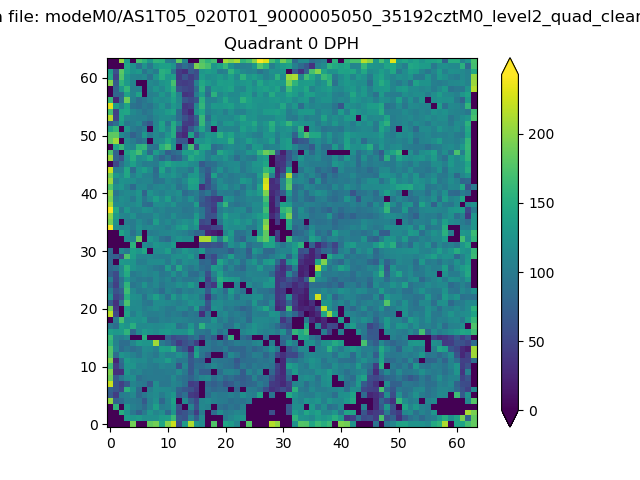 |
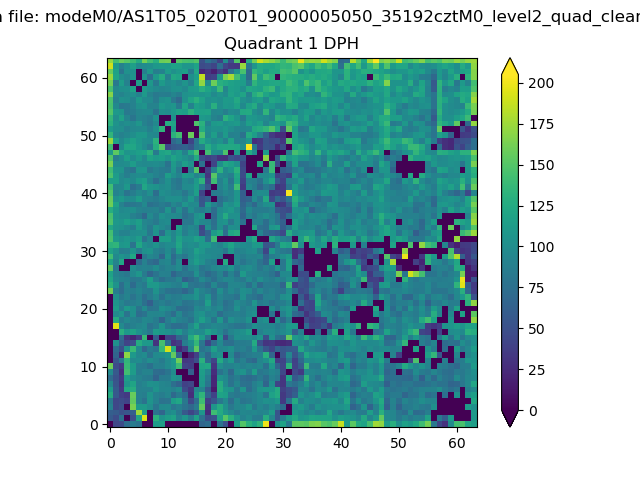 |
Quadrant B |
|---|---|---|---|
| Quadrant D | 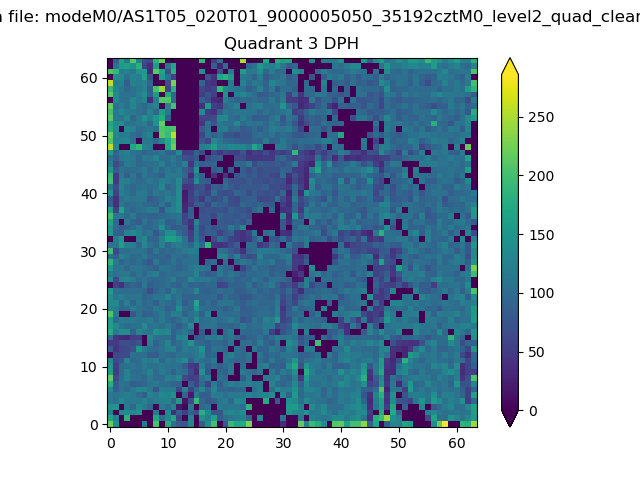 |
 |
Quadrant C |
| Plot type | Count rate plots | Images |
|---|---|---|
| Comparison with Poisson distribution Blue bars denote a histogram of data divided into 1 sec bins. Red curve is a Poisson curve with rate = median count rate of data. |
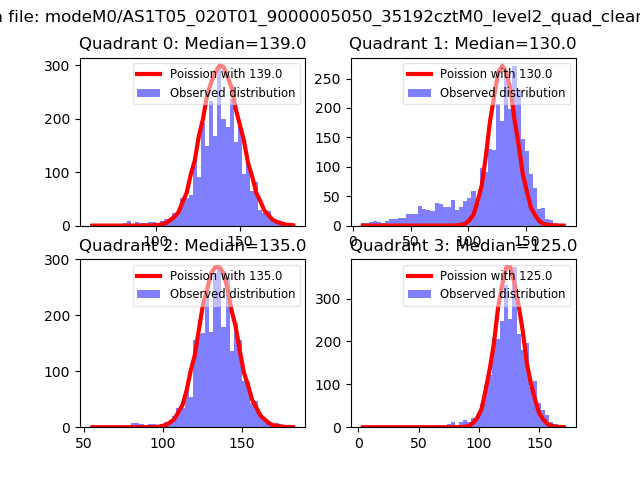 |
 |
| Quadrant-wise count rates Data is divided into 100 sec bins |
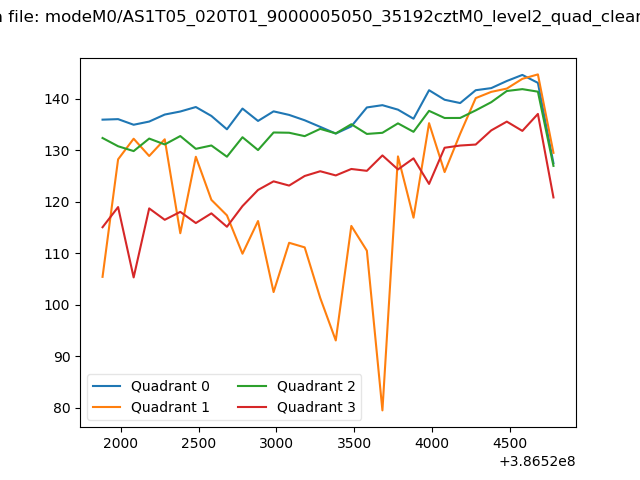 |
|
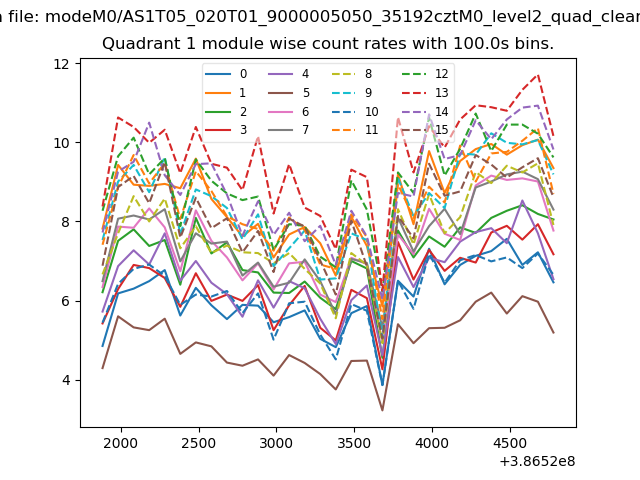
| Module-wise count rates for Quadrant A Data is divided into 100 sec bins |
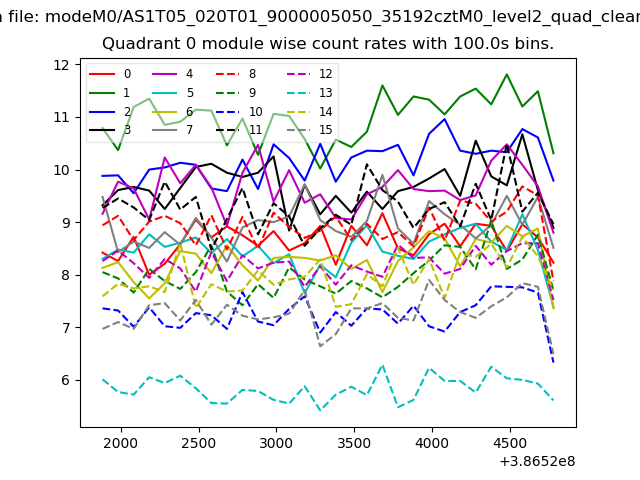 |
 |
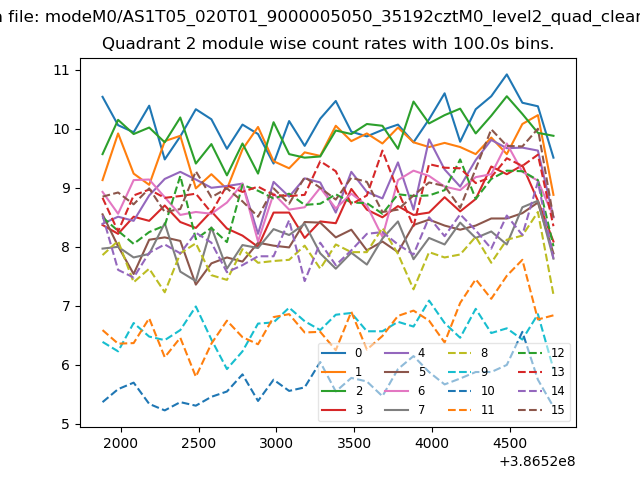
| Module-wise count rates for Quadrant B Data is divided into 100 sec bins |
 |
 |
| Module-wise count rates for Quadrant C Data is divided into 100 sec bins |
 |
 |
| Module-wise count rates for Quadrant D Data is divided into 100 sec bins |
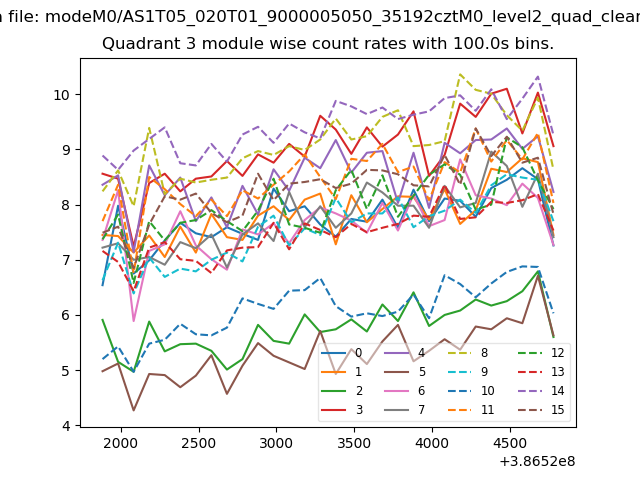 |
 |
| Parameter | Plot |
|---|---|
| CZT HV Monitor |  |
| D_VDD | 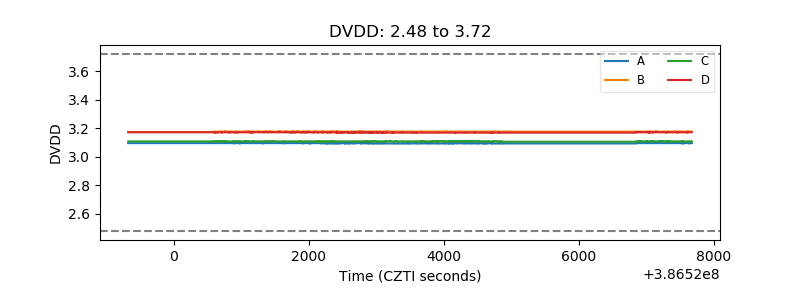 |
| Temperature 1 | 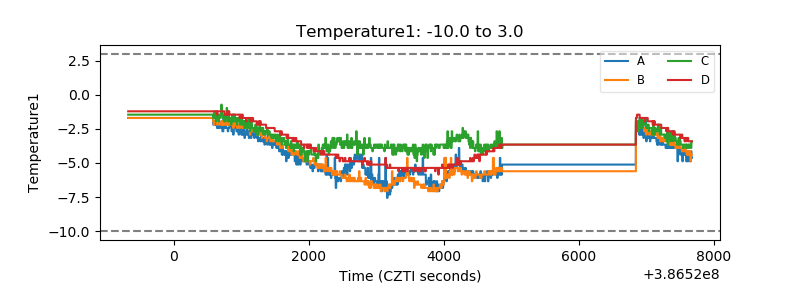 |
| Veto HV Monitor | 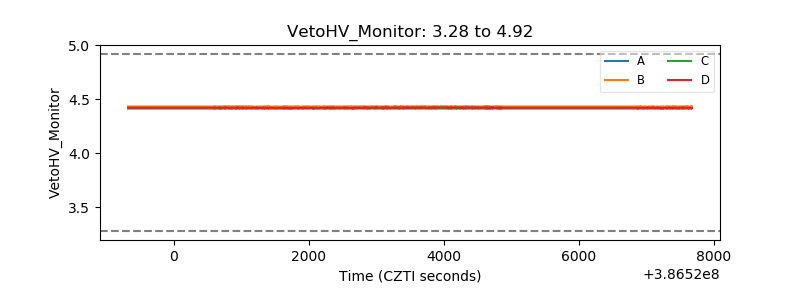 |
| Veto LLD | 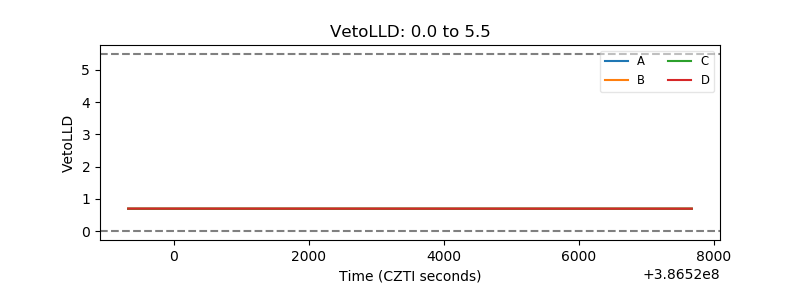 |
| Alpha Counter | 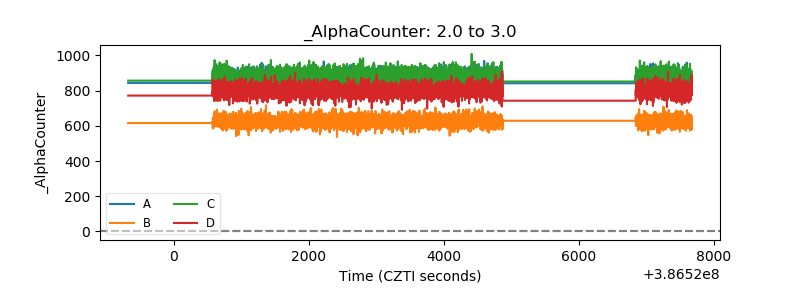 |
| _CPM_Rate | 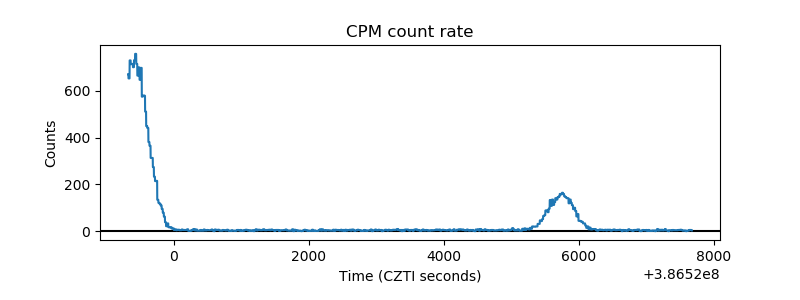 |
| CZT Counter | 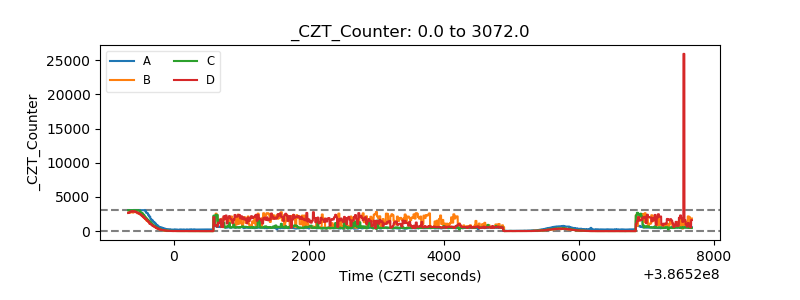 |
| +2.5 Volts monitor | 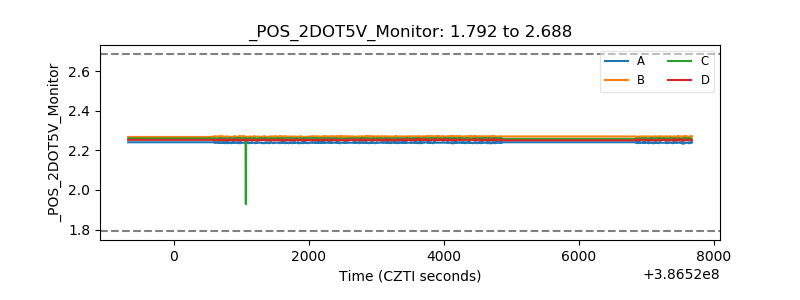 |
| +5 Volts monitor | 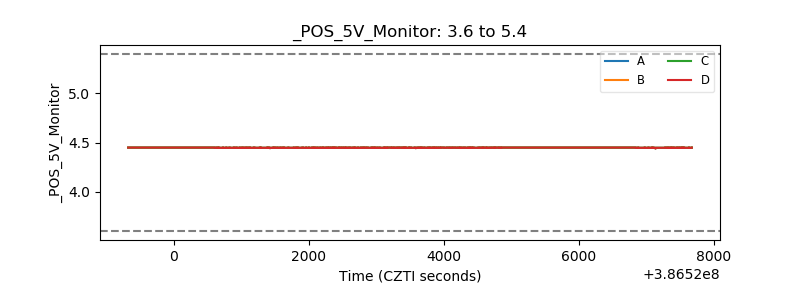 |
| _ROLL_ROT | 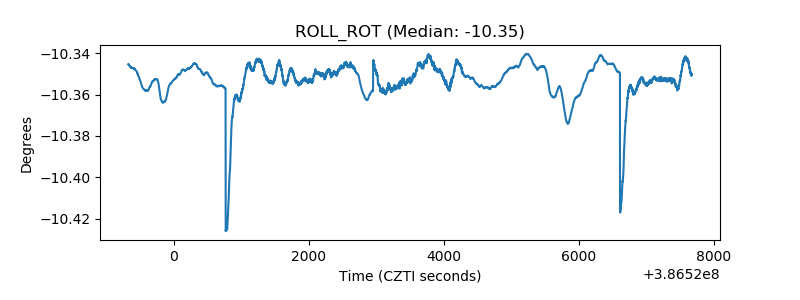 |
| _Roll_DEC | 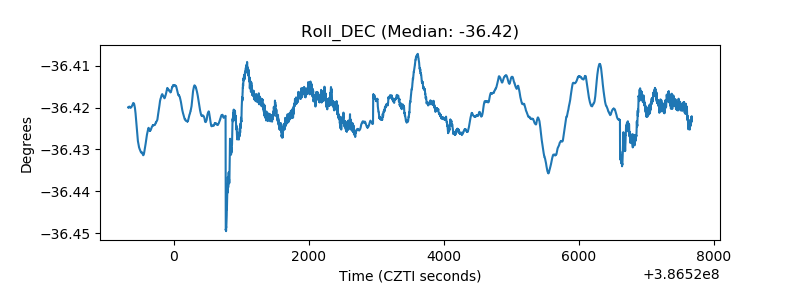 |
| _Roll_RA | 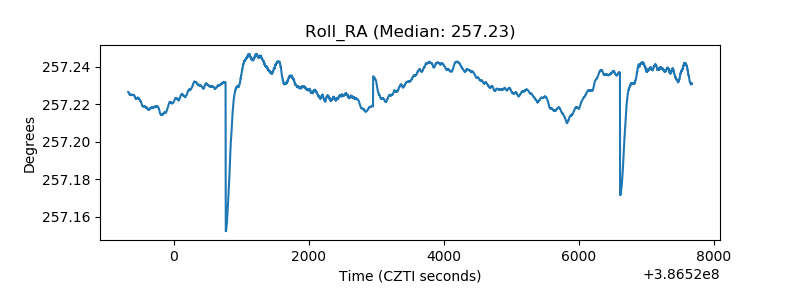 |
| Veto Counter | 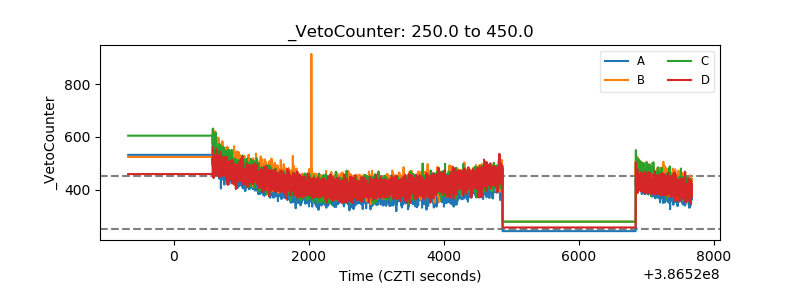 |