| Param | Original file | Final file |
|---|---|---|
| Filename | modeM0/AS1T05_020T01_9000005050_35189cztM0_level2.evt | modeM0/AS1T05_020T01_9000005050_35189cztM0_level2_quad_clean.evt |
| Size (bytes) | 3,128,538,240 | 182,407,680 |
| Size | 2.9 GB | 174.0 MB |
| Events in quadrant A | 9,727,396 | 1,254,474 |
| Events in quadrant B | 32,095,358 | 988,026 |
| Events in quadrant C | 11,189,795 | 1,229,833 |
| Events in quadrant D | 40,486,806 | 758,767 |
| Mode SS | |||
|---|---|---|---|
| Quadrant | BADHDUFLAG | Total packets | Discarded packets |
| A | 0 | 380 | 0 |
| B | 0 | 380 | 0 |
| C | 0 | 380 | 0 |
| D | 0 | 380 | 0 |
| Mode M0 | |||
|---|---|---|---|
| Quadrant | BADHDUFLAG | Total packets | Discarded packets |
| A | 0 | 39793 | 7 |
| B | 0 | 108298 | 9 |
| C | 0 | 44041 | 5 |
| D | 0 | 133131 | 5 |
| Mode M9 | |||
|---|---|---|---|
| Quadrant | BADHDUFLAG | Total packets | Discarded packets |
| A | 0 | 84 | 0 |
| B | 0 | 85 | 0 |
| C | 0 | 85 | 0 |
| D | 0 | 85 | 0 |
| Quadrant | Total seconds | Saturated seconds | Saturation percentage |
|---|---|---|---|
| A | 18703 | 66 | 0.352885% |
| B | 18702 | 9932 | 53.106620% |
| C | 18703 | 297 | 1.587981% |
| D | 18703 | 12601 | 67.374218% |
Noise dominated data is calculated using 1-second bins in cleaned event files. If a bin has >2000 counts, and if more than 50% of those come from <1% of pixels, then it is considered to be noise-dominated and hence unusable.
| Quadrant | # 1 sec bins | Bins with >0 counts | Bins with >2000 counts | High rate bins dominated by noise | Noise dominated (total time) | Noise dominated (detector-on time) | Marked lightcurve |
|---|---|---|---|---|---|---|---|
| A | 26297 | 18708 | 28 | 28 | 0.11% | 0.15% | 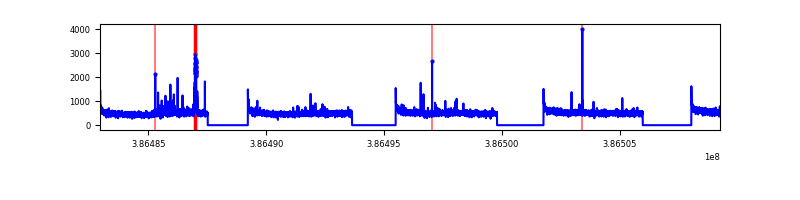 |
| B | 26297 | 18707 | 6912 | 6912 | 26.28% | 36.95% | 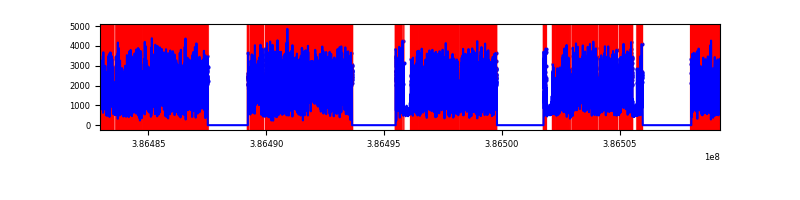 |
| C | 26297 | 18708 | 205 | 205 | 0.78% | 1.10% | 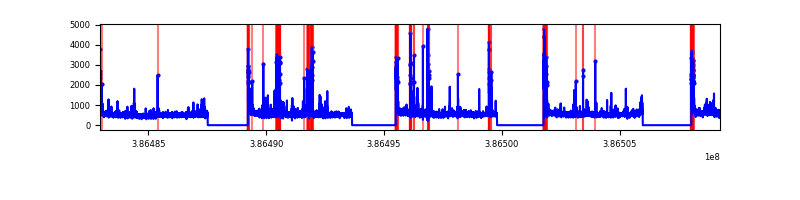 |
| D | 26297 | 18708 | 12517 | 12517 | 47.60% | 66.91% | 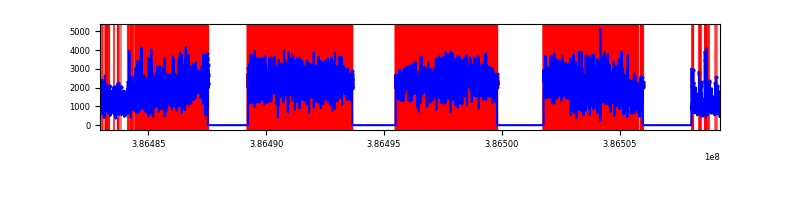 |
Top three noisy pixels from each quadrant. If the there are fewer than three noisy pixels in the level2.evt file, extra rows are filled as -1
| Pixel properties | Quadrant properties | ||||||
|---|---|---|---|---|---|---|---|
| Quadrant | DetID | PixID | Counts | Sigma | Mean | Median | Sigma |
| A | 10 | 83 | 297093 | 633.83 | 2363 | 2323 | 465.1 |
| A | 7 | 16 | 138190 | 292.15 | 2363 | 2323 | 465.1 |
| A | 13 | 6 | 70305 | 146.18 | 2363 | 2323 | 465.1 |
| B | 5 | 236 | 23993606 | 69779.74 | 1839 | 1795 | 343.8 |
| B | 5 | 172 | 484049 | 1402.63 | 1839 | 1795 | 343.8 |
| B | 5 | 200 | 94095 | 268.45 | 1839 | 1795 | 343.8 |
| C | 15 | 214 | 780673 | 1514.1 | 2269 | 2292 | 514.1 |
| C | 0 | 10 | 720080 | 1396.24 | 2269 | 2292 | 514.1 |
| C | 1 | 23 | 414769 | 802.35 | 2269 | 2292 | 514.1 |
| D | 7 | 80 | 15566122 | 38665.26 | 1661 | 1616 | 402.5 |
| D | 8 | 195 | 15537949 | 38595.27 | 1661 | 1616 | 402.5 |
| D | 10 | 118 | 698407 | 1730.96 | 1661 | 1616 | 402.5 |
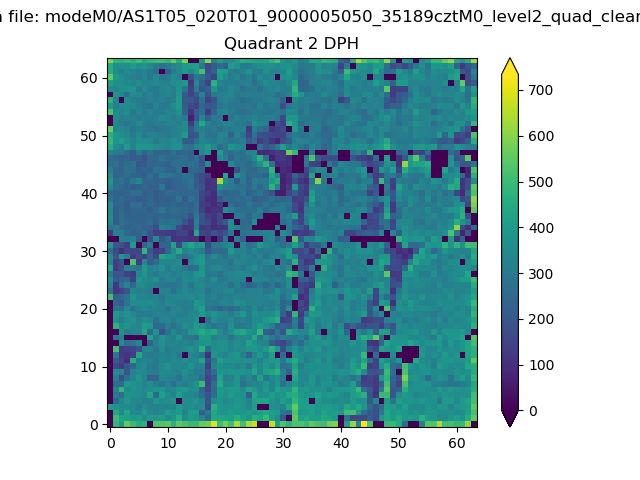
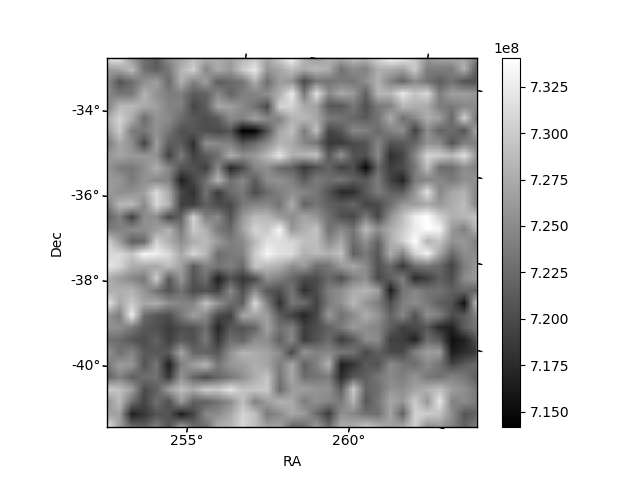
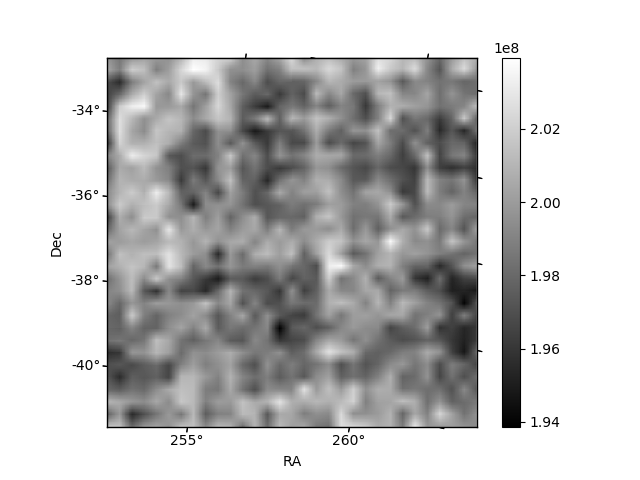
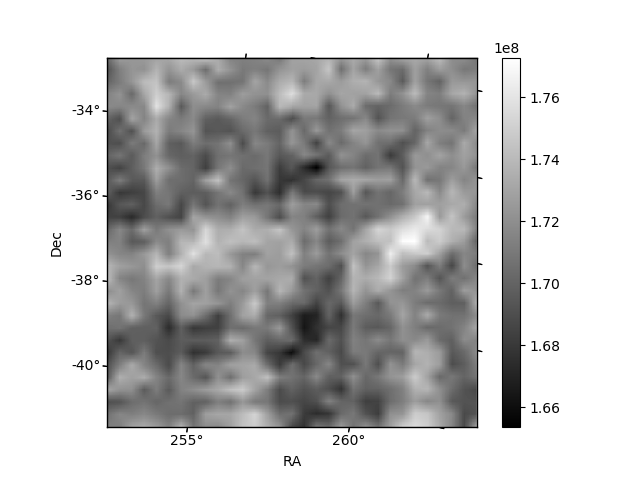
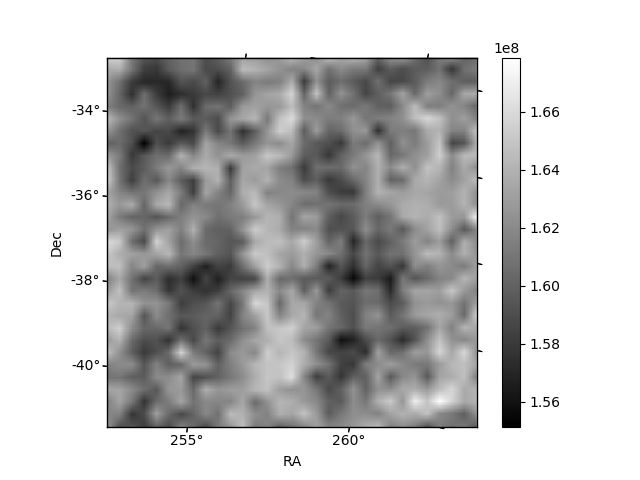
Histogram calculated using DETX and DETY for each event in the final _common_clean file
| Quadrant A | 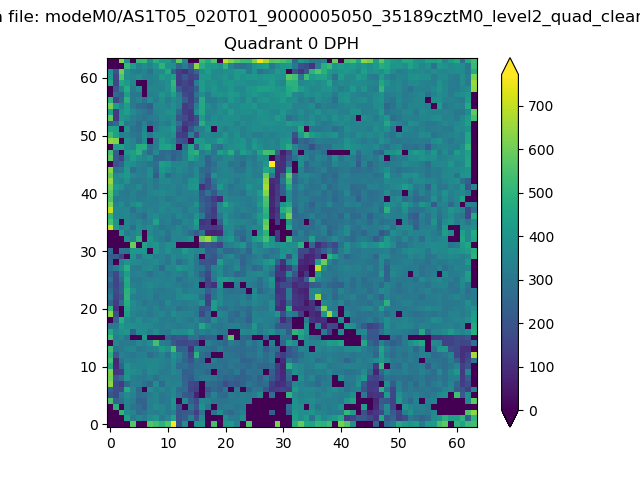 |
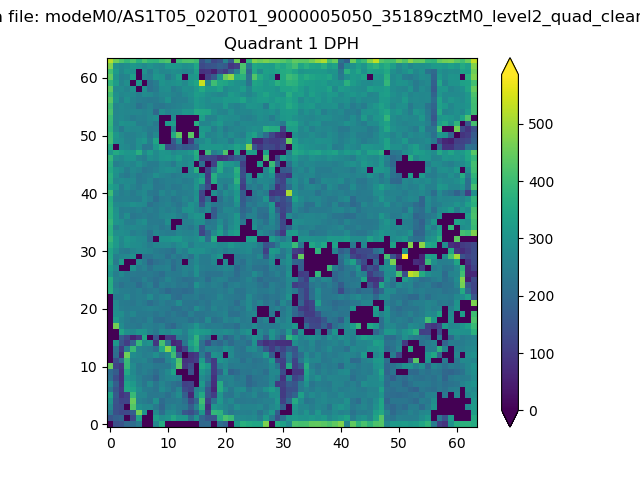 |
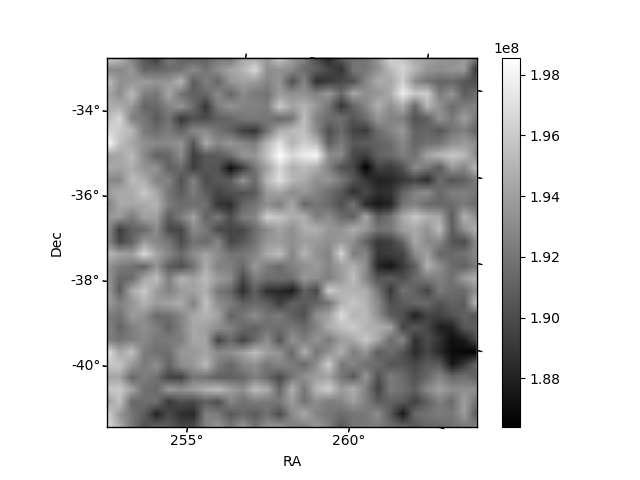
Quadrant B |
|---|---|---|---|
| Quadrant D | 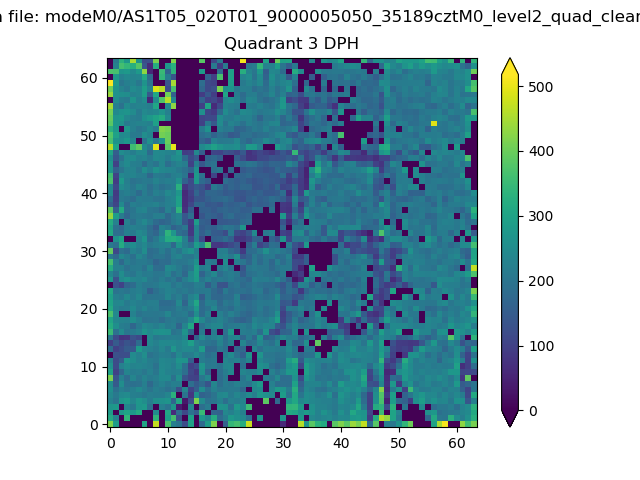 |
 |
Quadrant C |
| Plot type | Count rate plots | Images |
|---|---|---|
| Comparison with Poisson distribution Blue bars denote a histogram of data divided into 1 sec bins. Red curve is a Poisson curve with rate = median count rate of data. |
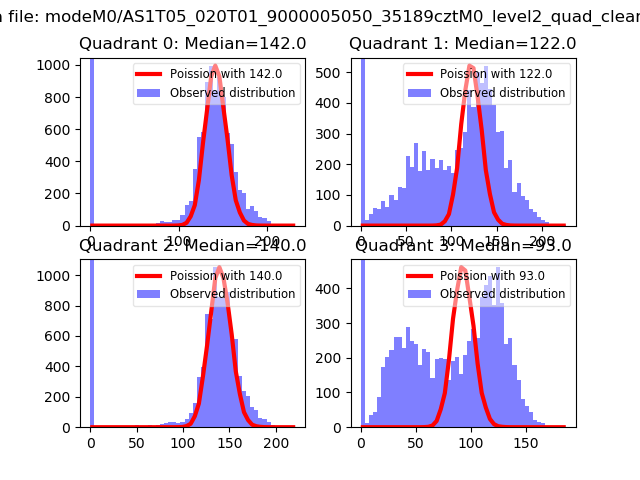 |
 |
| Quadrant-wise count rates Data is divided into 100 sec bins |
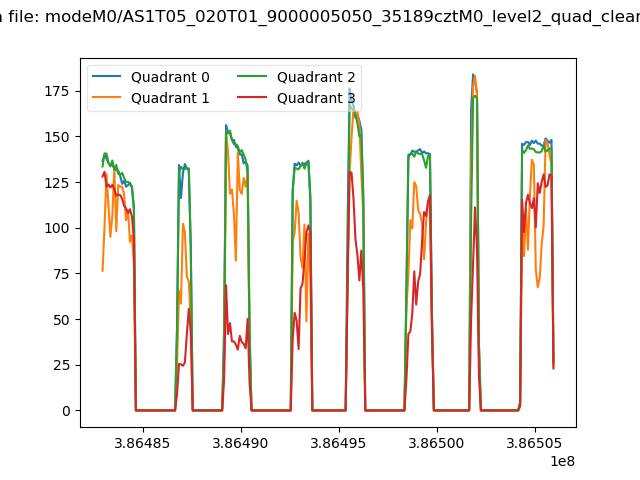 |
|
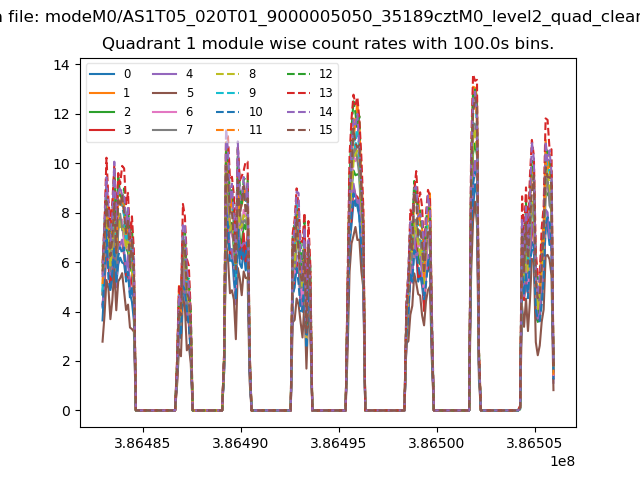
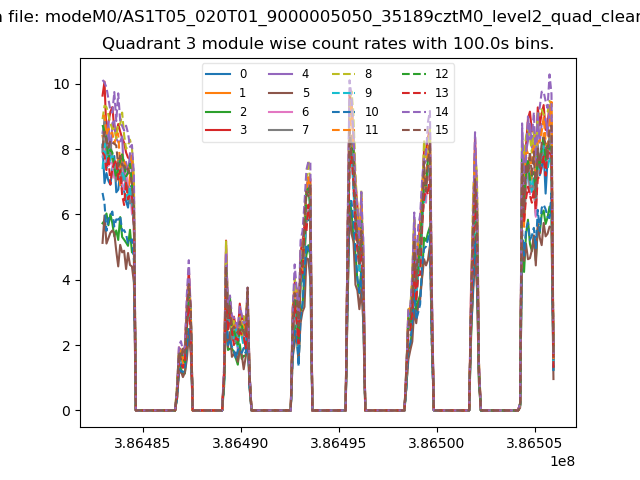
| Module-wise count rates for Quadrant A Data is divided into 100 sec bins |
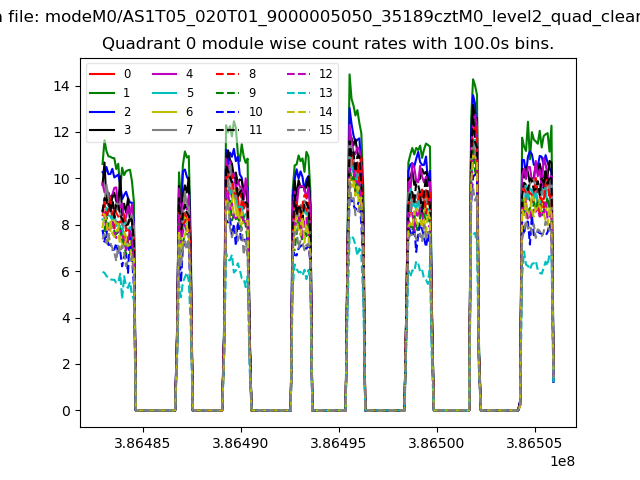 |
 |
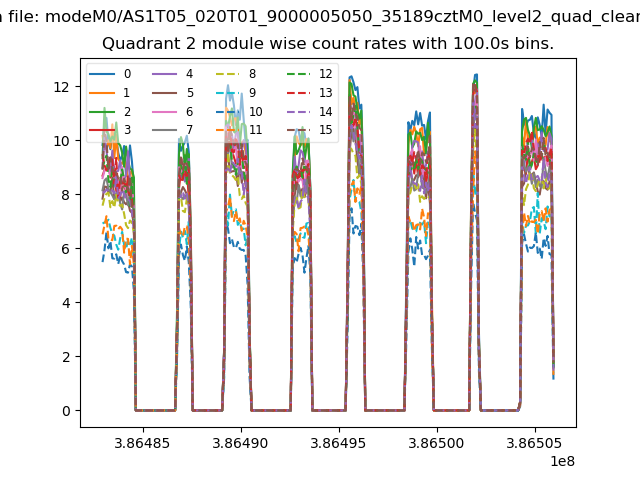
| Module-wise count rates for Quadrant B Data is divided into 100 sec bins |
 |
 |
| Module-wise count rates for Quadrant C Data is divided into 100 sec bins |
 |
 |
| Module-wise count rates for Quadrant D Data is divided into 100 sec bins |
 |
 |
| Parameter | Plot |
|---|---|
| CZT HV Monitor | 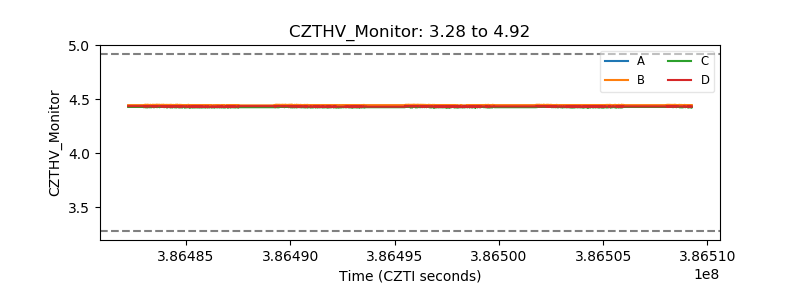 |
| D_VDD | 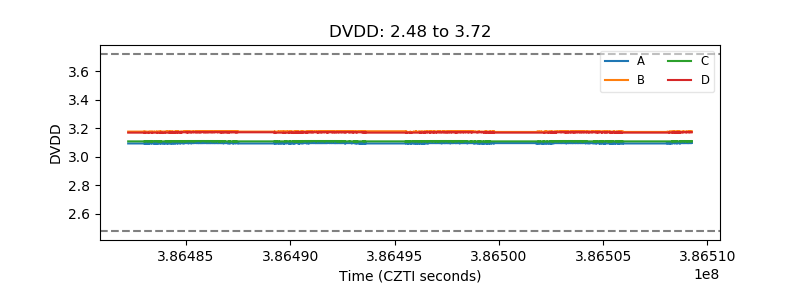 |
| Temperature 1 | 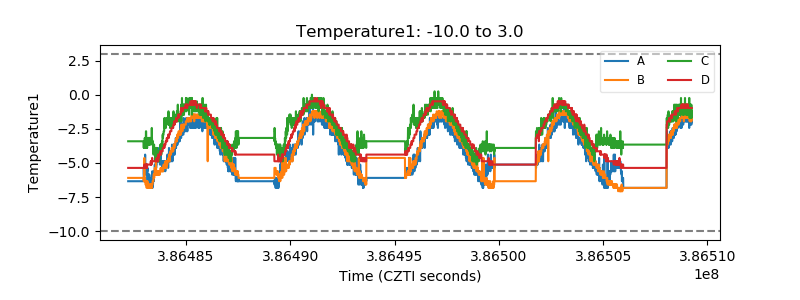 |
| Veto HV Monitor | 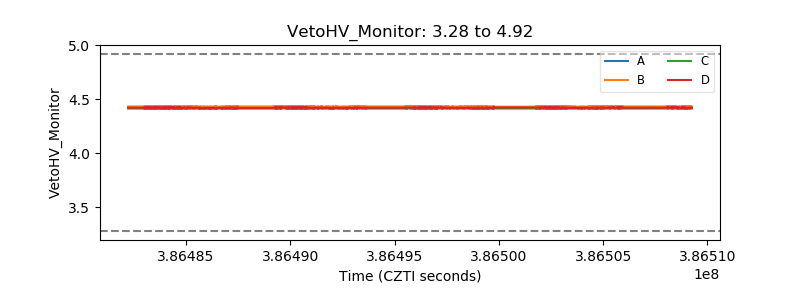 |
| Veto LLD | 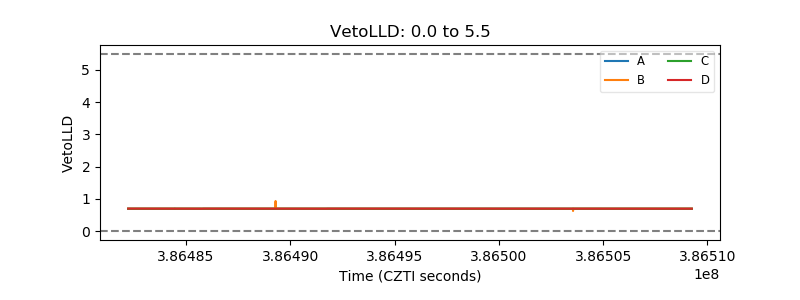 |
| Alpha Counter | 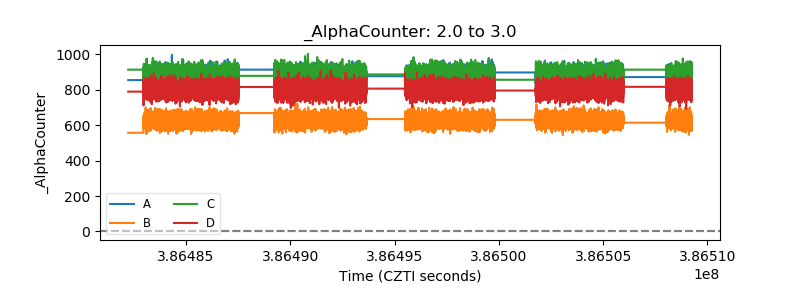 |
| _CPM_Rate | 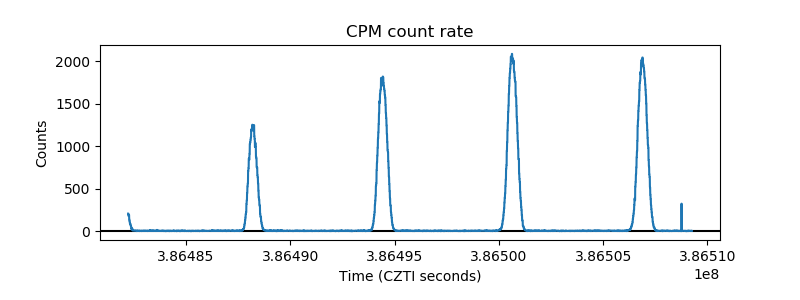 |
| CZT Counter | 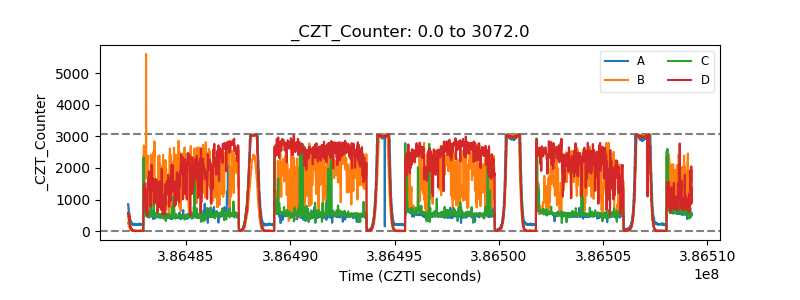 |
| +2.5 Volts monitor | 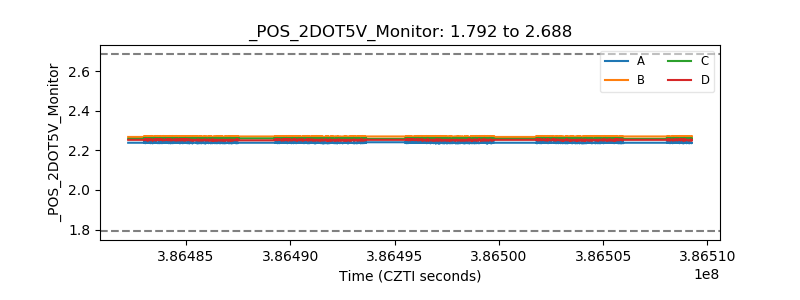 |
| +5 Volts monitor | 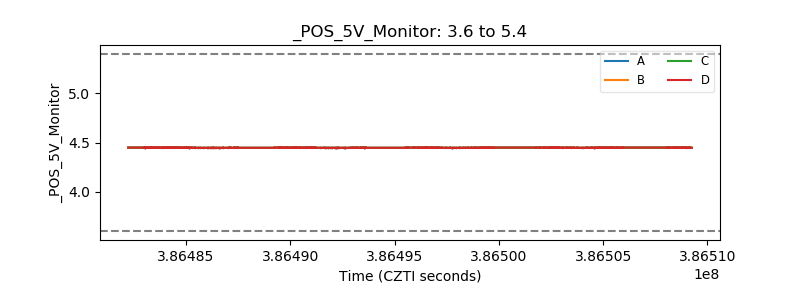 |
| _ROLL_ROT | 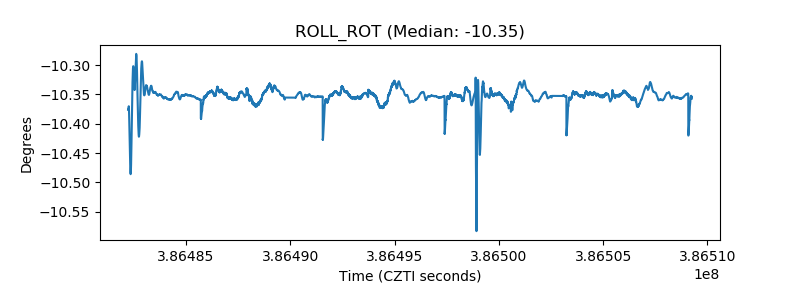 |
| _Roll_DEC | 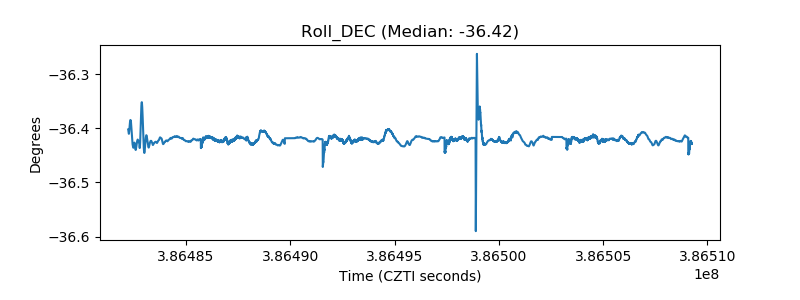 |
| _Roll_RA | 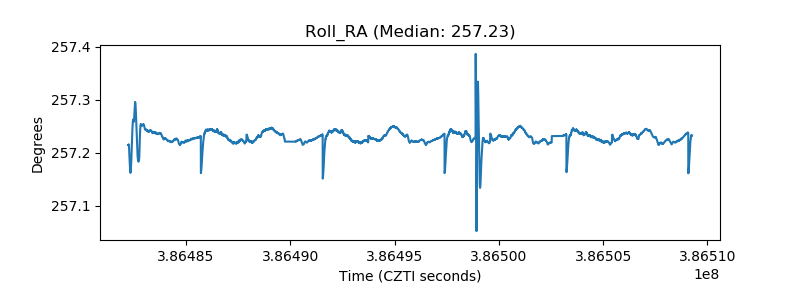 |
| Veto Counter | 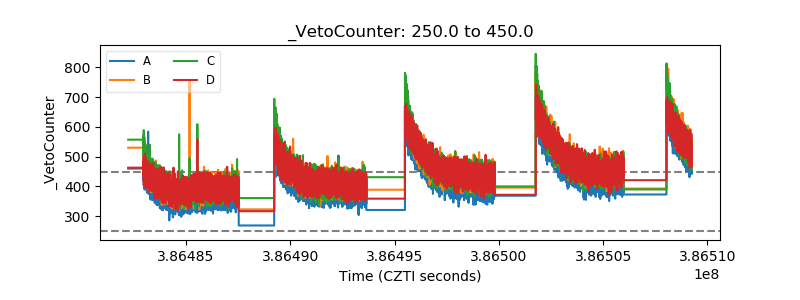 |