| Param | Original file | Final file |
|---|---|---|
| Filename | modeM0/AS1T05_020T01_9000005050_35187cztM0_level2.evt | modeM0/AS1T05_020T01_9000005050_35187cztM0_level2_quad_clean.evt |
| Size (bytes) | 932,690,880 | 58,507,200 |
| Size | 889.5 MB | 55.8 MB |
| Events in quadrant A | 2,607,443 | 432,315 |
| Events in quadrant B | 8,980,102 | 350,535 |
| Events in quadrant C | 3,291,196 | 424,531 |
| Events in quadrant D | 13,020,927 | 200,671 |
| Mode SS | |||
|---|---|---|---|
| Quadrant | BADHDUFLAG | Total packets | Discarded packets |
| A | 0 | 106 | 0 |
| B | 0 | 106 | 0 |
| C | 0 | 106 | 0 |
| D | 0 | 106 | 0 |
| Mode M0 | |||
|---|---|---|---|
| Quadrant | BADHDUFLAG | Total packets | Discarded packets |
| A | 0 | 10729 | 3 |
| B | 0 | 30267 | 1 |
| C | 0 | 12873 | 1 |
| D | 0 | 42172 | 1 |
| Mode M9 | |||
|---|---|---|---|
| Quadrant | BADHDUFLAG | Total packets | Discarded packets |
| A | 0 | 18 | 0 |
| B | 0 | 18 | 0 |
| C | 0 | 18 | 0 |
| D | 0 | 18 | 0 |
| Quadrant | Total seconds | Saturated seconds | Saturation percentage |
|---|---|---|---|
| A | 5153 | 7 | 0.135843% |
| B | 5153 | 2905 | 56.374927% |
| C | 5153 | 118 | 2.289928% |
| D | 5153 | 4885 | 94.799146% |
Noise dominated data is calculated using 1-second bins in cleaned event files. If a bin has >2000 counts, and if more than 50% of those come from <1% of pixels, then it is considered to be noise-dominated and hence unusable.
| Quadrant | # 1 sec bins | Bins with >0 counts | Bins with >2000 counts | High rate bins dominated by noise | Noise dominated (total time) | Noise dominated (detector-on time) | Marked lightcurve |
|---|---|---|---|---|---|---|---|
| A | 7007 | 5155 | 0 | 0 | 0.00% | 0.00% | 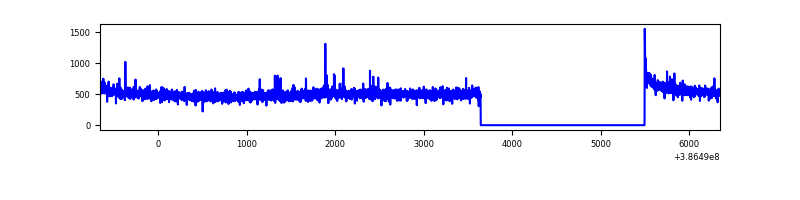 |
| B | 7007 | 5154 | 2014 | 2014 | 28.74% | 39.08% | 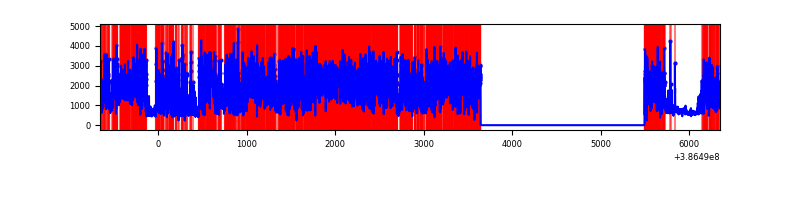 |
| C | 7007 | 5155 | 89 | 89 | 1.27% | 1.73% | 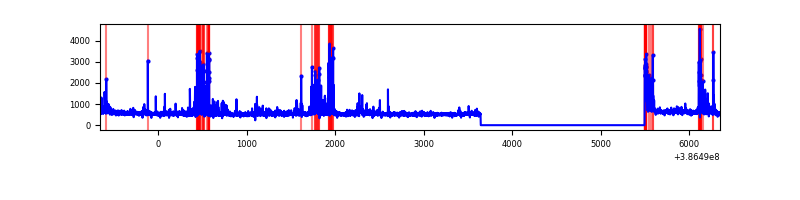 |
| D | 7007 | 5155 | 4747 | 4747 | 67.75% | 92.09% | 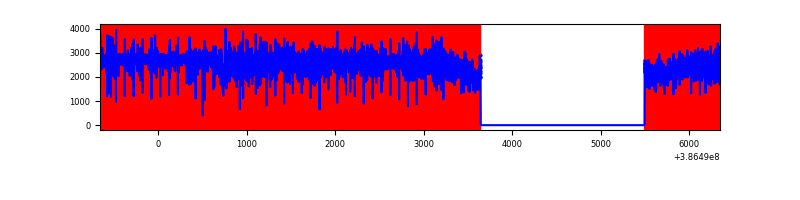 |
Top three noisy pixels from each quadrant. If the there are fewer than three noisy pixels in the level2.evt file, extra rows are filled as -1
| Pixel properties | Quadrant properties | ||||||
|---|---|---|---|---|---|---|---|
| Quadrant | DetID | PixID | Counts | Sigma | Mean | Median | Sigma |
| A | 10 | 83 | 79892 | 620.06 | 644 | 632 | 127.8 |
| A | 13 | 6 | 19033 | 143.95 | 644 | 632 | 127.8 |
| A | 9 | 143 | 10244 | 75.2 | 644 | 632 | 127.8 |
| B | 5 | 236 | 6750977 | 72716.31 | 490 | 479 | 92.8 |
| B | 5 | 172 | 178941 | 1922.39 | 490 | 479 | 92.8 |
| B | 3 | 112 | 56799 | 606.68 | 490 | 479 | 92.8 |
| C | 1 | 23 | 250201 | 1750.55 | 620 | 625 | 142.6 |
| C | 15 | 214 | 217190 | 1519.01 | 620 | 625 | 142.6 |
| C | 0 | 10 | 149451 | 1043.88 | 620 | 625 | 142.6 |
| D | 7 | 80 | 7592476 | 88124.44 | 352 | 342 | 86.2 |
| D | 8 | 195 | 3410671 | 39584.83 | 352 | 342 | 86.2 |
| D | 10 | 118 | 216519 | 2509.24 | 352 | 342 | 86.2 |
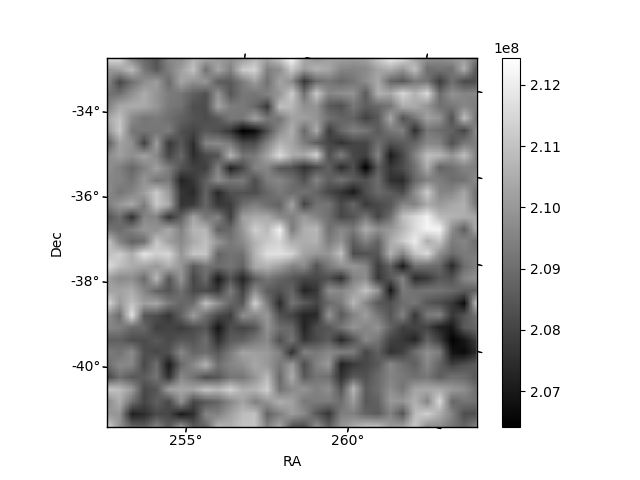
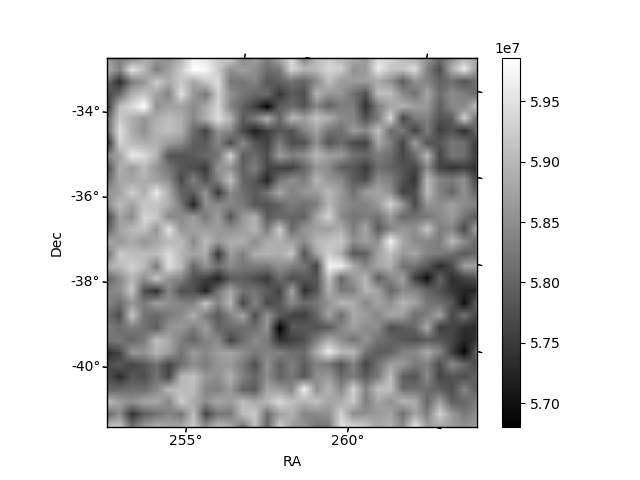
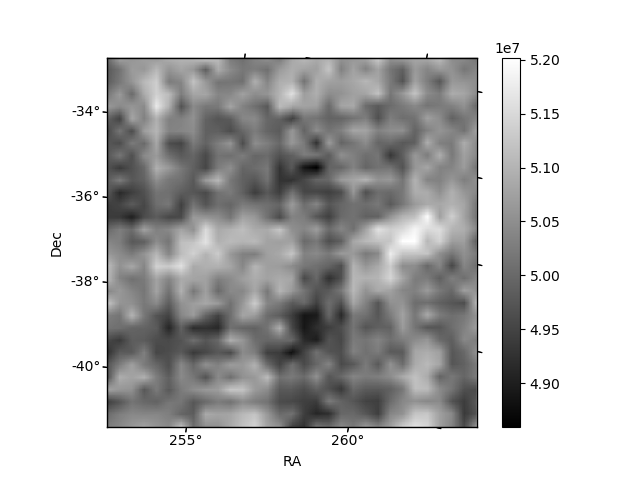
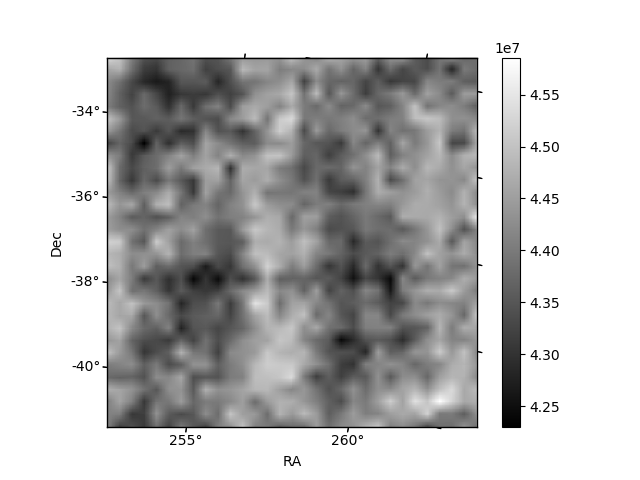
Histogram calculated using DETX and DETY for each event in the final _common_clean file
| Quadrant A | 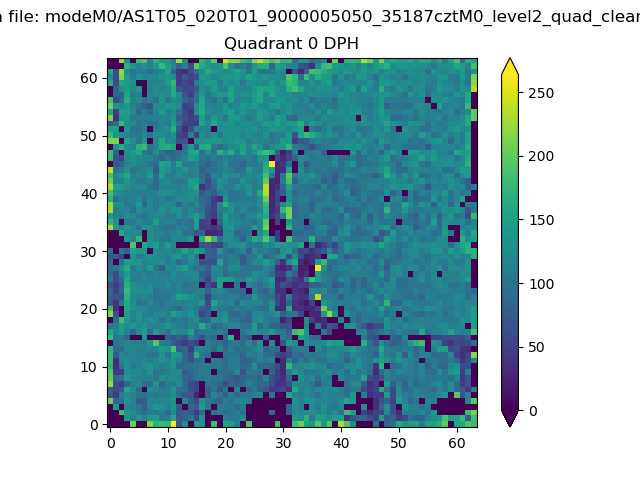 |
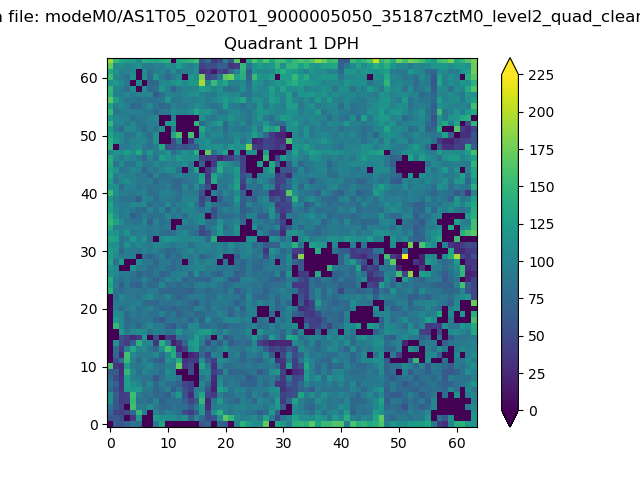 |
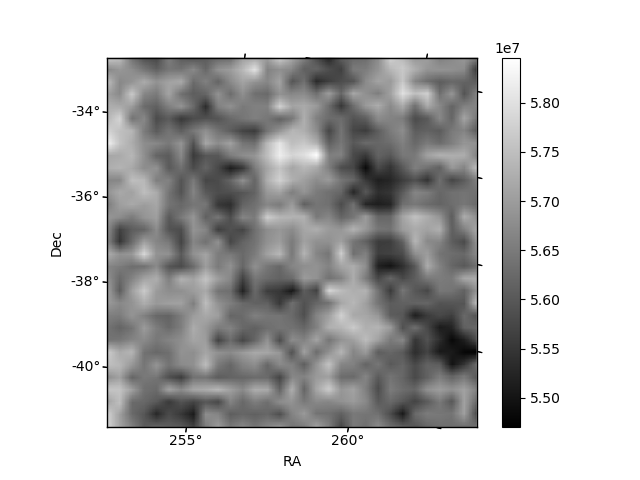
Quadrant B |
|---|---|---|---|
| Quadrant D | 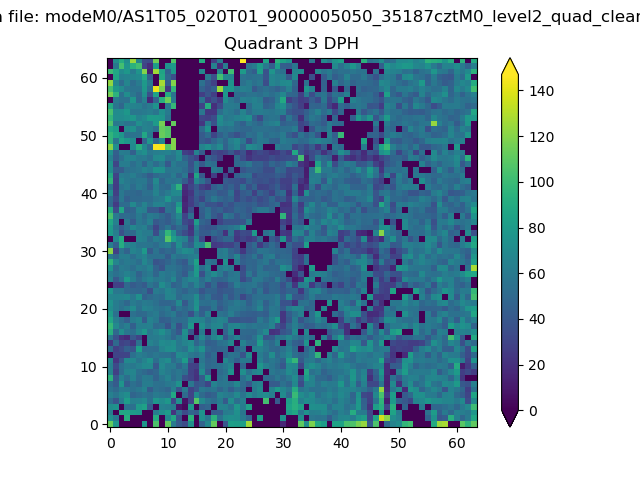 |
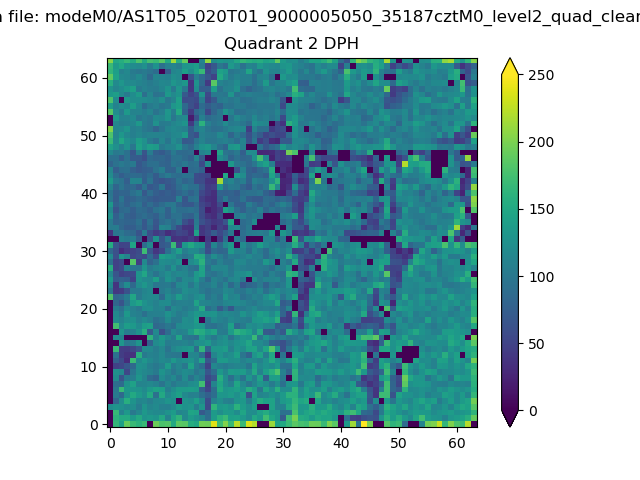 |
Quadrant C |
| Plot type | Count rate plots | Images |
|---|---|---|
| Comparison with Poisson distribution Blue bars denote a histogram of data divided into 1 sec bins. Red curve is a Poisson curve with rate = median count rate of data. |
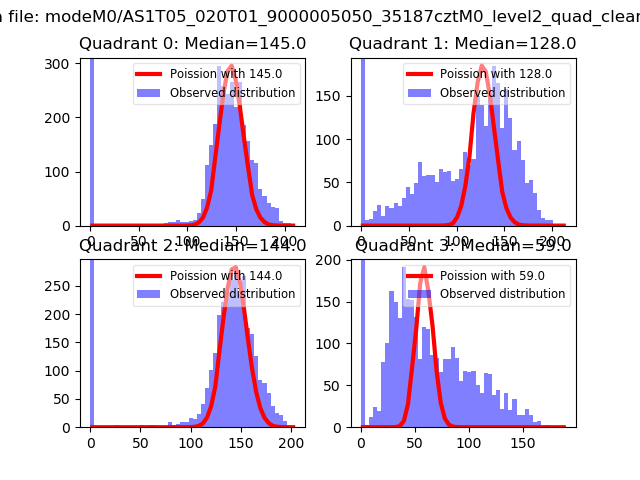 |
 |
| Quadrant-wise count rates Data is divided into 100 sec bins |
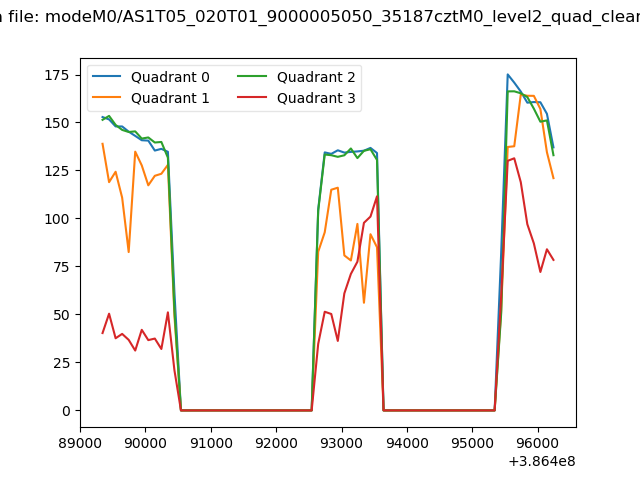 |
|
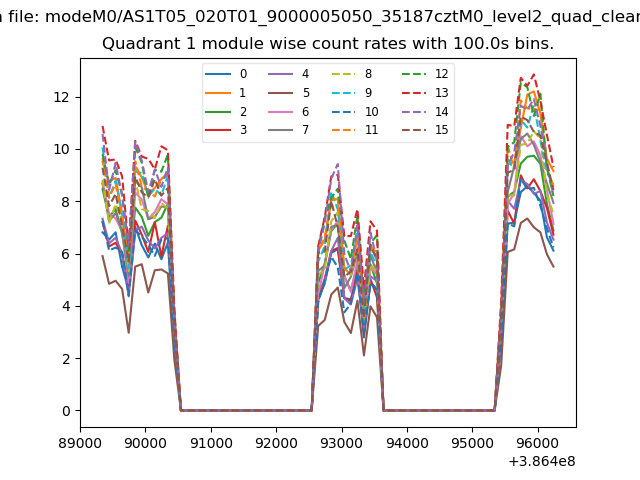
| Module-wise count rates for Quadrant A Data is divided into 100 sec bins |
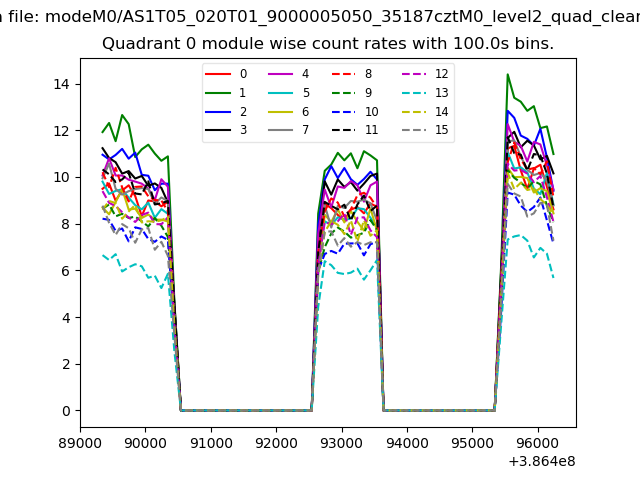 |
 |
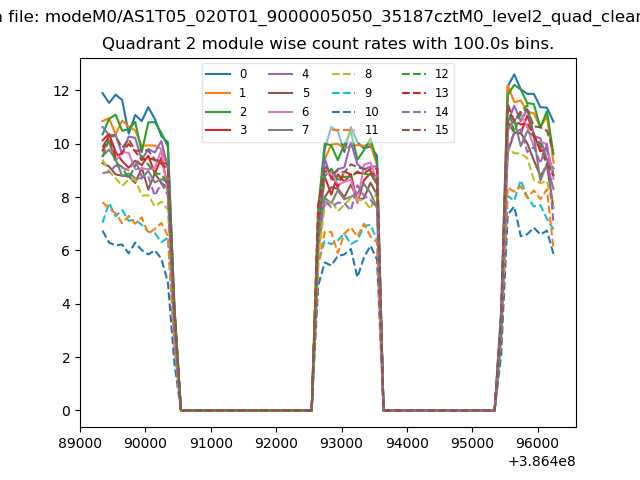
| Module-wise count rates for Quadrant B Data is divided into 100 sec bins |
 |
 |
| Module-wise count rates for Quadrant C Data is divided into 100 sec bins |
 |
 |
| Module-wise count rates for Quadrant D Data is divided into 100 sec bins |
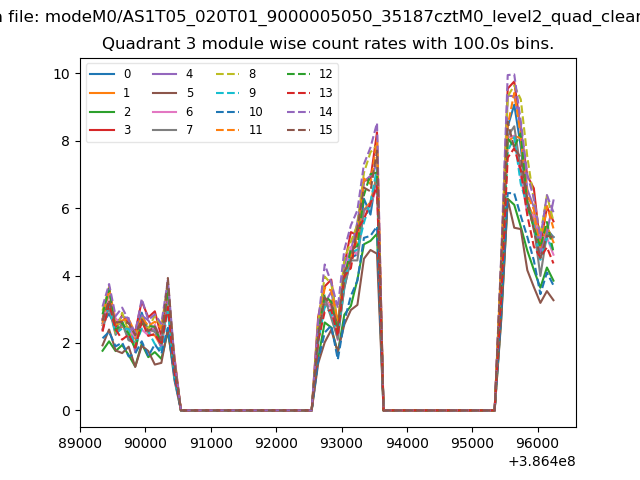 |
 |
| Parameter | Plot |
|---|---|
| CZT HV Monitor |  |
| D_VDD | 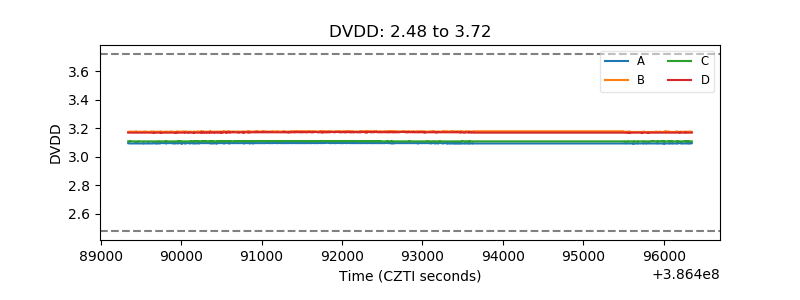 |
| Temperature 1 | 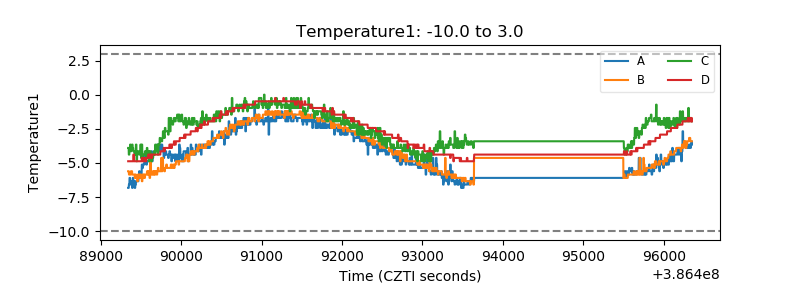 |
| Veto HV Monitor | 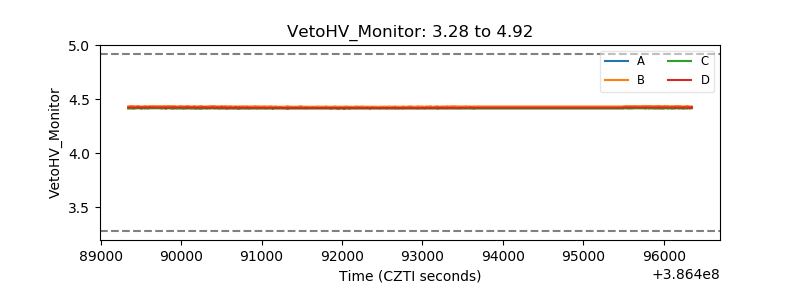 |
| Veto LLD | 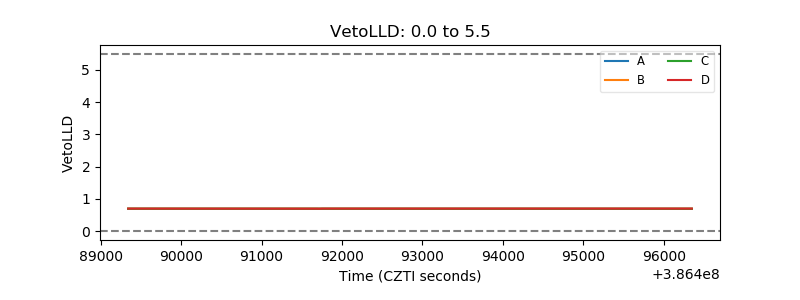 |
| Alpha Counter | 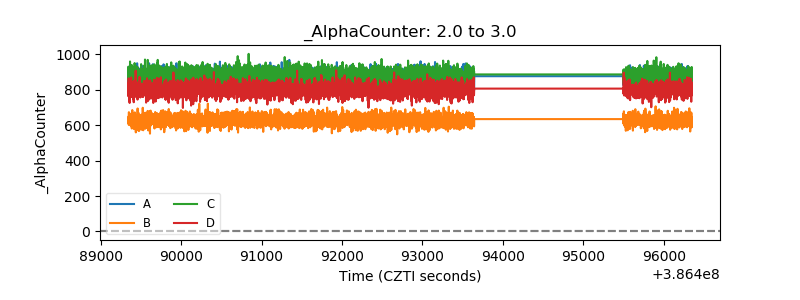 |
| _CPM_Rate | 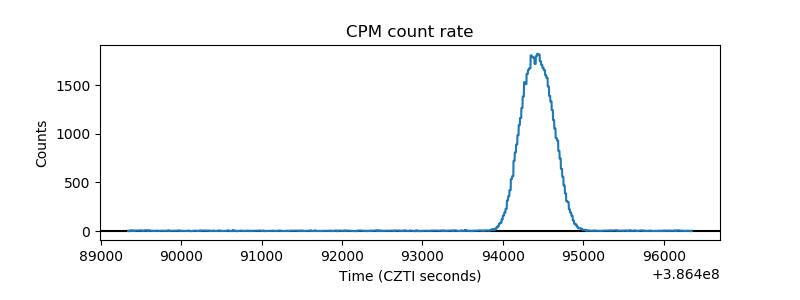 |
| CZT Counter | 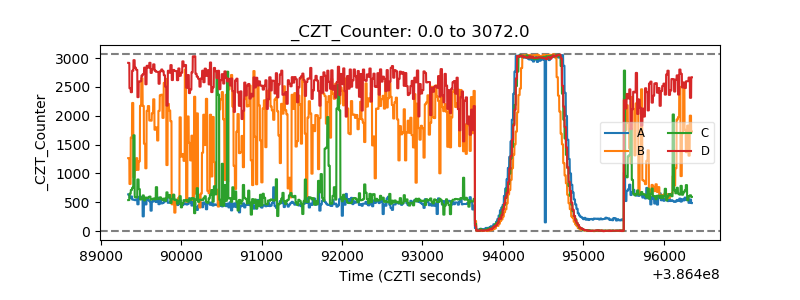 |
| +2.5 Volts monitor | 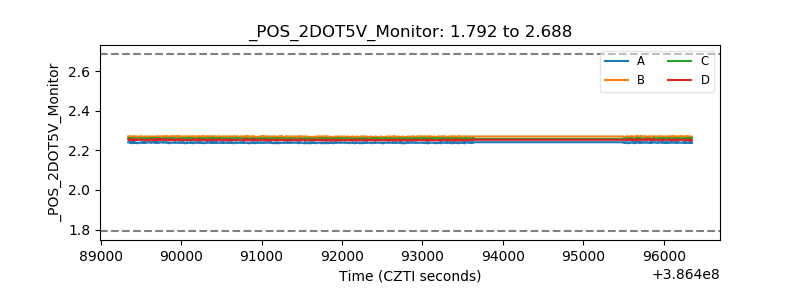 |
| +5 Volts monitor |  |
| _ROLL_ROT | 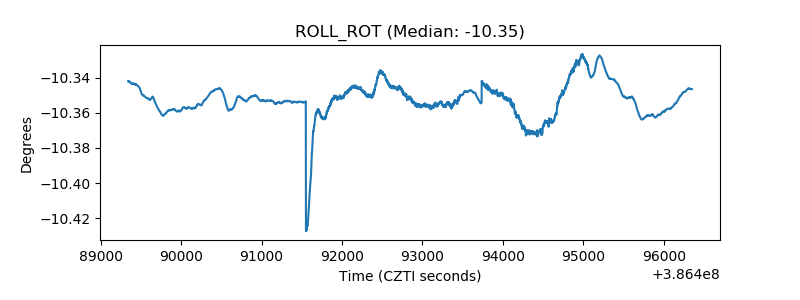 |
| _Roll_DEC | 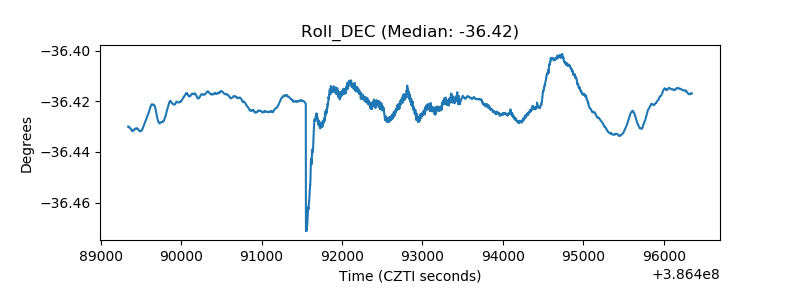 |
| _Roll_RA | 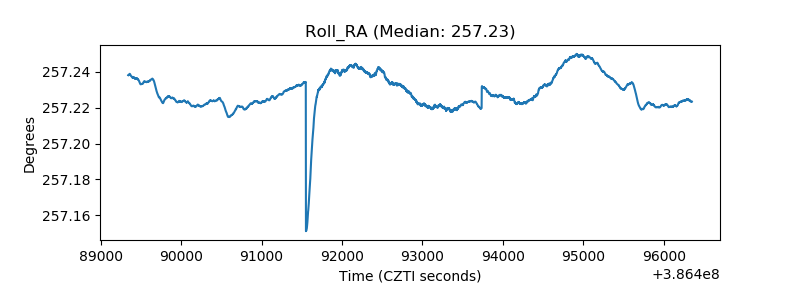 |
| Veto Counter | 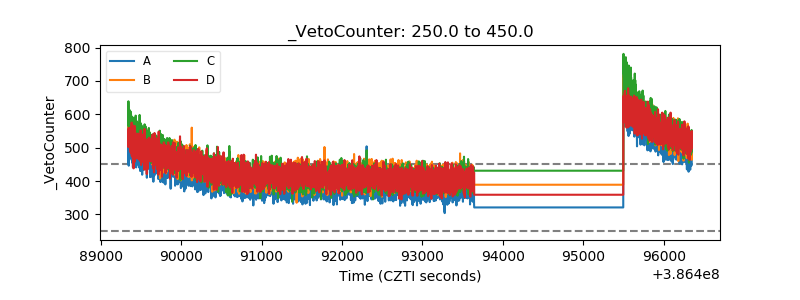 |