| Param | Original file | Final file |
|---|---|---|
| Filename | modeM0/AS1T05_020T01_9000005050cztM0_level2_bc.evt | modeM0/AS1T05_020T01_9000005050cztM0_level2_quad_clean.evt |
| Size (bytes) | 5,600,246,400 | 810,158,400 |
| Size | 5.2 GB | 772.6 MB |
| Events in quadrant A | 15,813,147 | 5,387,676 |
| Events in quadrant B | 54,428,356 | 4,668,967 |
| Events in quadrant C | 21,068,828 | 5,291,759 |
| Events in quadrant D | 73,677,247 | 4,510,871 |
| Mode SS | |||
|---|---|---|---|
| Quadrant | BADHDUFLAG | Total packets | Discarded packets |
| A | 0 | 1386 | 0 |
| B | 0 | 1386 | 0 |
| C | 0 | 1386 | 0 |
| D | 0 | 1386 | 0 |
| Mode M0 | |||
|---|---|---|---|
| Quadrant | BADHDUFLAG | Total packets | Discarded packets |
| A | 0 | 141856 | 0 |
| B | 0 | 329431 | 0 |
| C | 0 | 156966 | 0 |
| D | 0 | 328869 | 0 |
| Mode M9 | |||
|---|---|---|---|
| Quadrant | BADHDUFLAG | Total packets | Discarded packets |
| A | 0 | 249 | 0 |
| B | 0 | 250 | 0 |
| C | 0 | 250 | 0 |
| D | 0 | 250 | 0 |
| Quadrant | Total seconds | Saturated seconds | Saturation percentage |
|---|---|---|---|
| A | 68130 | 145 | 0.212828% |
| B | 68129 | 23214 | 34.073596% |
| C | 68130 | 1027 | 1.507412% |
| D | 68130 | 16904 | 24.811390% |
Noise dominated data is calculated using 1-second bins in cleaned event files. If a bin has >2000 counts, and if more than 50% of those come from <1% of pixels, then it is considered to be noise-dominated and hence unusable.
| Quadrant | # 1 sec bins | Bins with >0 counts | Bins with >2000 counts | High rate bins dominated by noise | Noise dominated (total time) | Noise dominated (detector-on time) | Marked lightcurve |
|---|---|---|---|---|---|---|---|
| A | 92154 | 68145 | 26 | 26 | 0.03% | 0.04% | 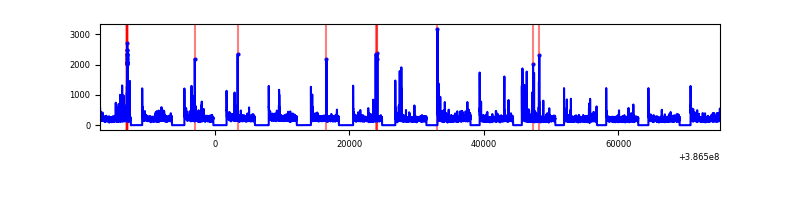 |
| B | 92153 | 68119 | 721 | 721 | 0.78% | 1.06% | 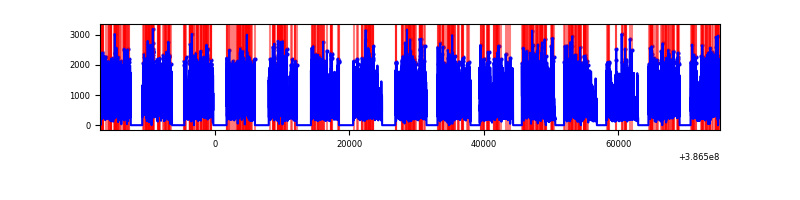 |
| C | 92153 | 68131 | 173 | 173 | 0.19% | 0.25% | 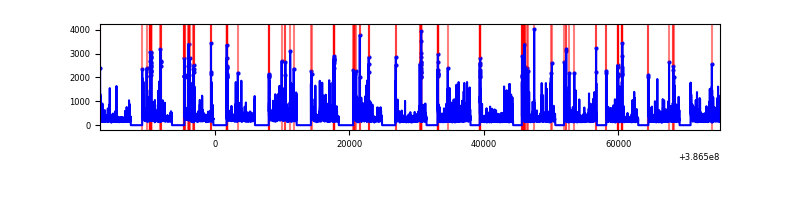 |
| D | 92153 | 68128 | 10225 | 10225 | 11.10% | 15.01% | 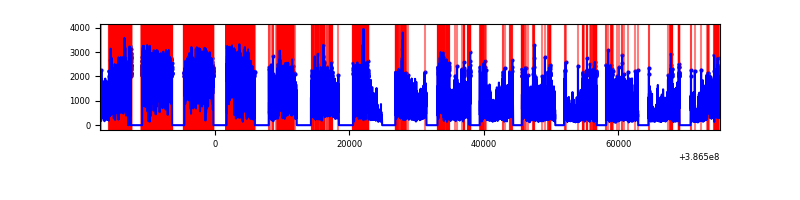 |
Top three noisy pixels from each quadrant. If the there are fewer than three noisy pixels in the level2.evt file, extra rows are filled as -1
| Pixel properties | Quadrant properties | ||||||
|---|---|---|---|---|---|---|---|
| Quadrant | DetID | PixID | Counts | Sigma | Mean | Median | Sigma |
| A | 10 | 83 | 923405 | 1153.75 | 3657 | 3612 | 797.2 |
| A | 13 | 6 | 188025 | 231.32 | 3657 | 3612 | 797.2 |
| A | 9 | 143 | 149924 | 183.53 | 3657 | 3612 | 797.2 |
| B | 5 | 236 | 40445276 | 65253.46 | 3125 | 3062 | 619.8 |
| B | 5 | 172 | 577988 | 927.64 | 3125 | 3062 | 619.8 |
| B | 3 | 112 | 481482 | 771.93 | 3125 | 3062 | 619.8 |
| C | 15 | 214 | 2678760 | 3316.98 | 3543 | 3530 | 806.5 |
| C | 0 | 10 | 2143907 | 2653.83 | 3543 | 3530 | 806.5 |
| C | 1 | 23 | 1294735 | 1600.95 | 3543 | 3530 | 806.5 |
| D | 8 | 195 | 38859104 | 50605.45 | 3209 | 3112 | 767.8 |
| D | 7 | 80 | 14606663 | 19019.44 | 3209 | 3112 | 767.8 |
| D | 2 | 250 | 1296124 | 1684.0 | 3209 | 3112 | 767.8 |
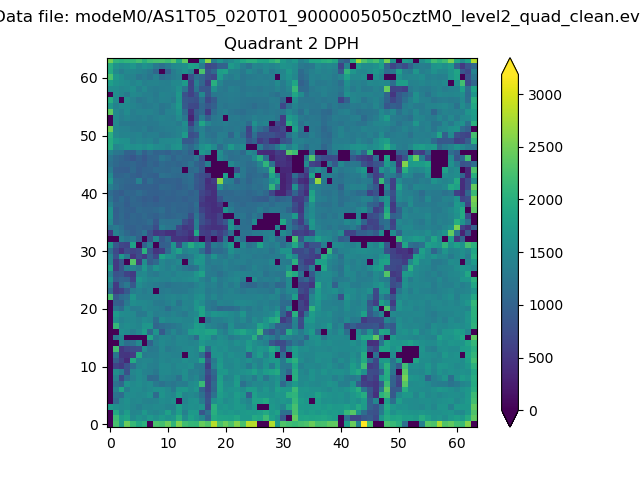
Histogram calculated using DETX and DETY for each event in the final _common_clean file
| Quadrant A | 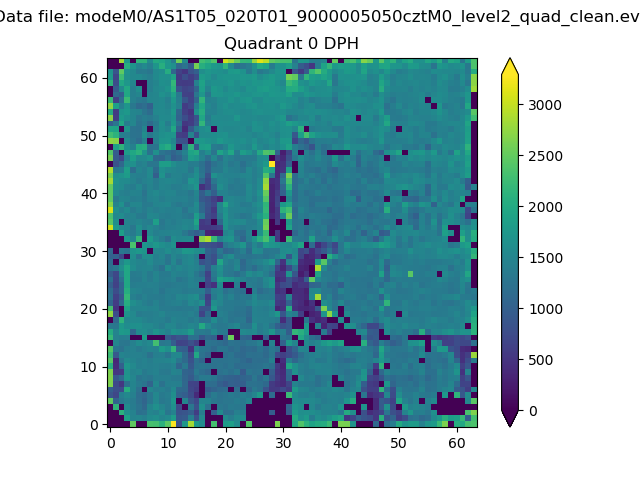 |
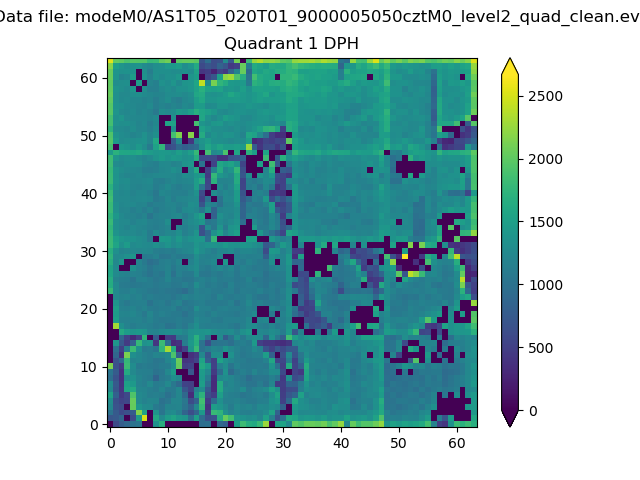 |
Quadrant B |
|---|---|---|---|
| Quadrant D | 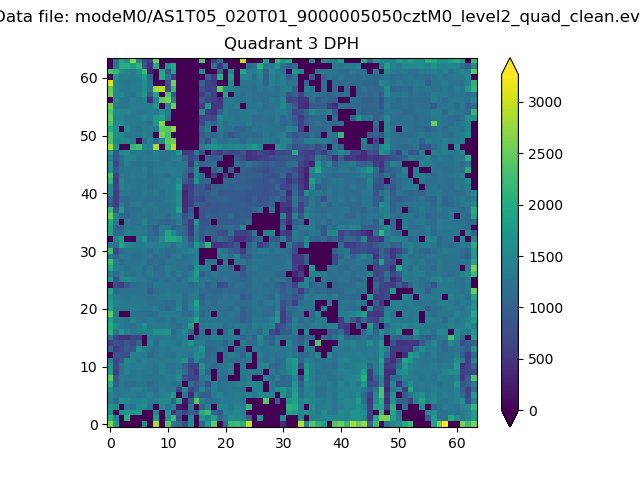 |
 |
Quadrant C |
| Plot type | Count rate plots | Images |
|---|---|---|
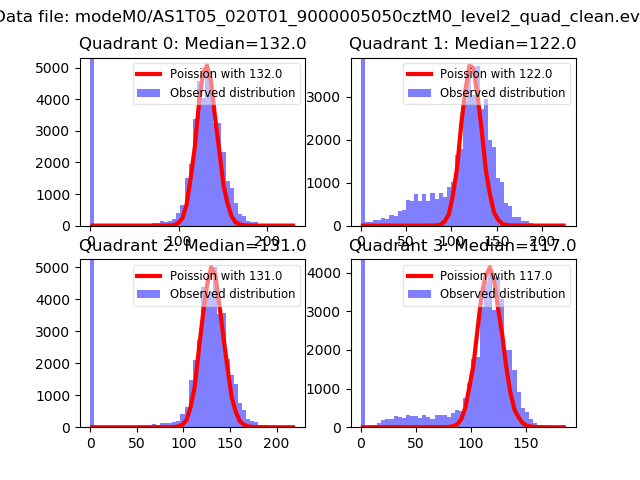
| Comparison with Poisson distribution Blue bars denote a histogram of data divided into 1 sec bins. Red curve is a Poisson curve with rate = median count rate of data. |
 |
 |
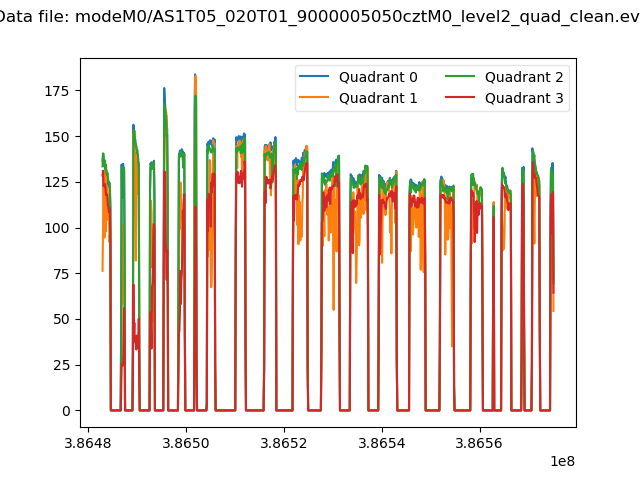
| Quadrant-wise count rates Data is divided into 100 sec bins |
 |
|
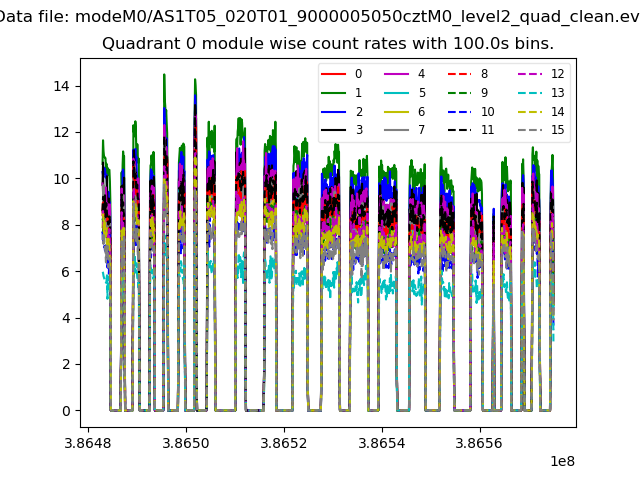
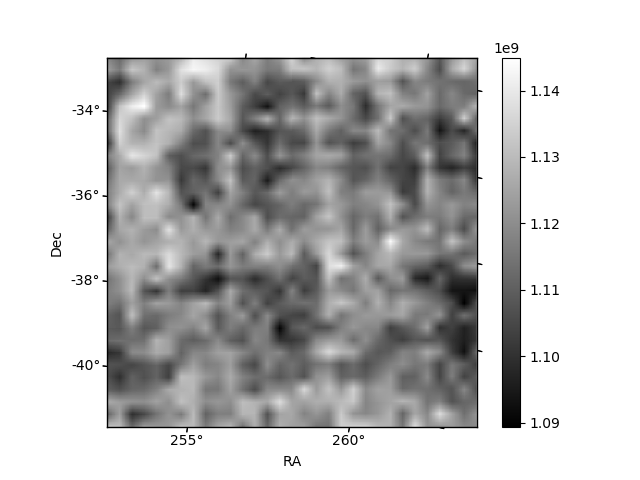
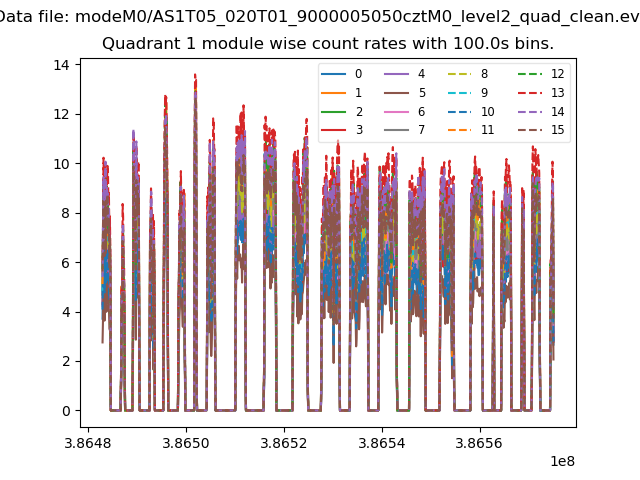
| Module-wise count rates for Quadrant A Data is divided into 100 sec bins |
 |
 |
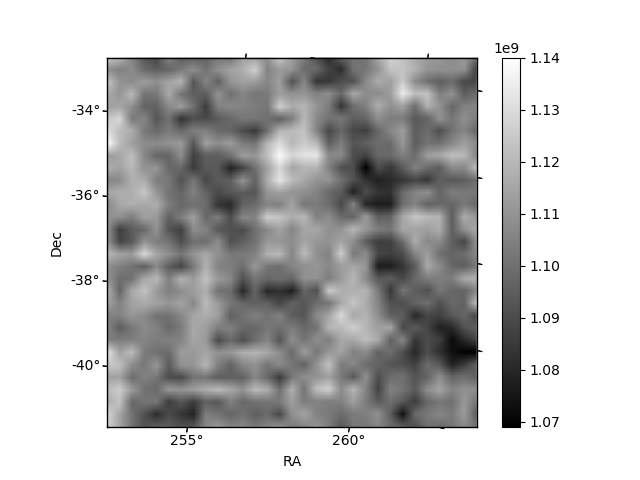
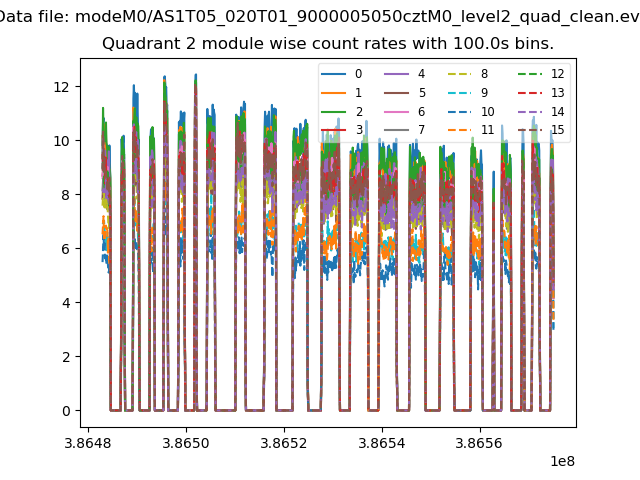
| Module-wise count rates for Quadrant B Data is divided into 100 sec bins |
 |
 |
| Module-wise count rates for Quadrant C Data is divided into 100 sec bins |
 |
 |
| Module-wise count rates for Quadrant D Data is divided into 100 sec bins |
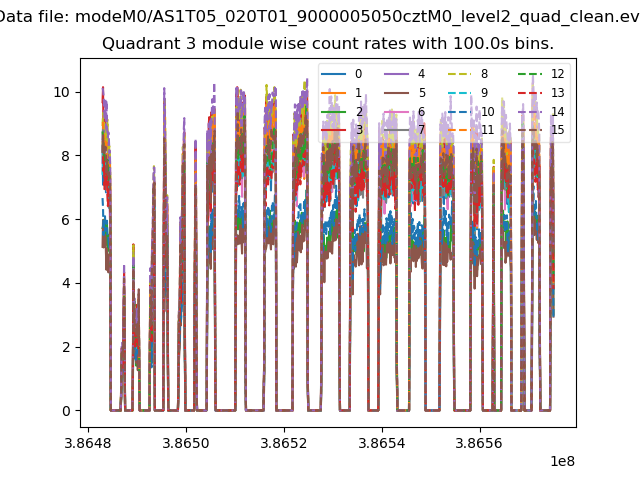 |
 |
| Parameter | Plot |
|---|---|
| CZT HV Monitor | 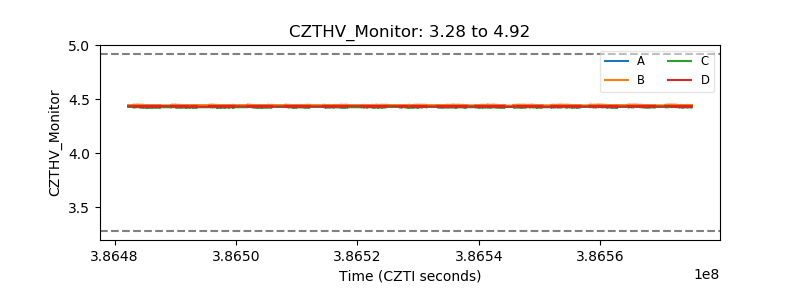 |
| D_VDD | 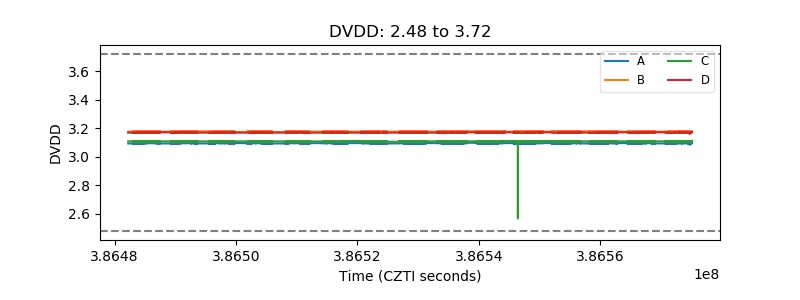 |
| Temperature 1 | 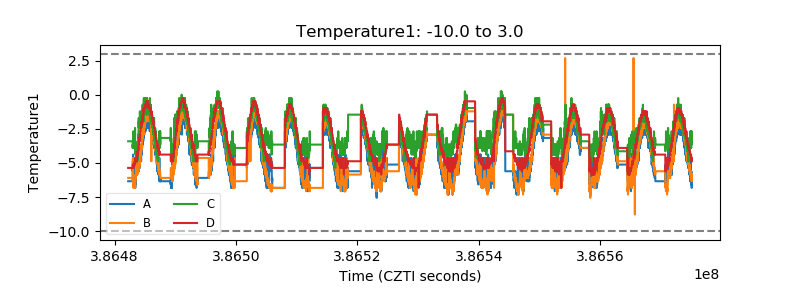 |
| Veto HV Monitor | 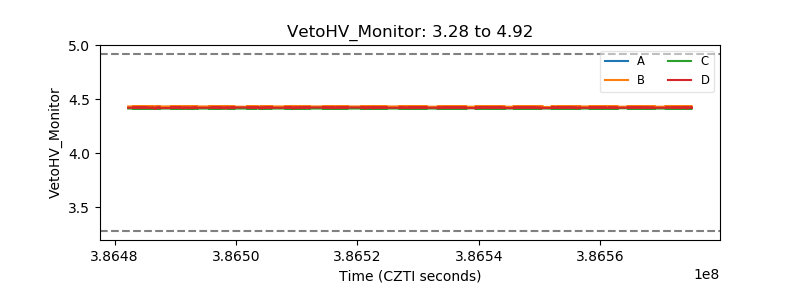 |
| Veto LLD | 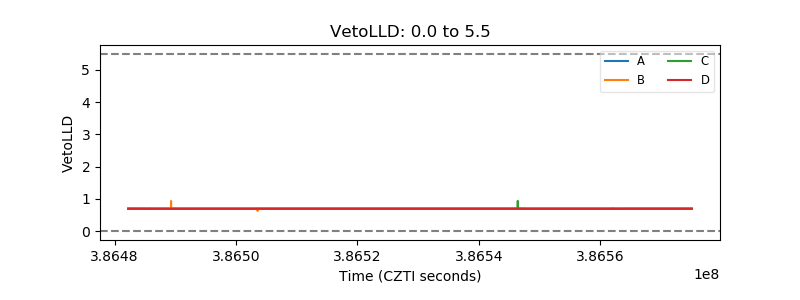 |
| Alpha Counter | 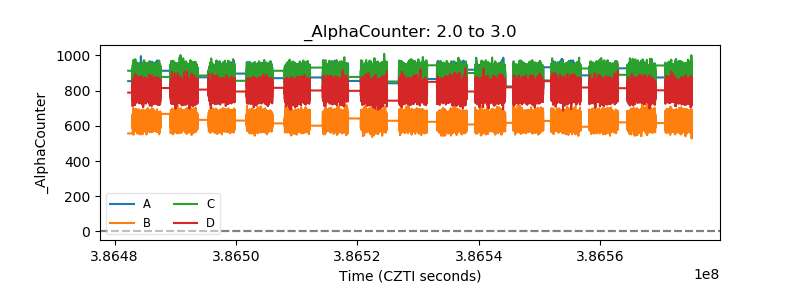 |
| _CPM_Rate | 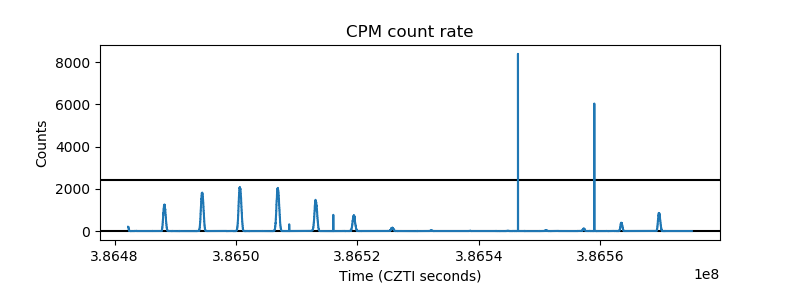 |
| CZT Counter | 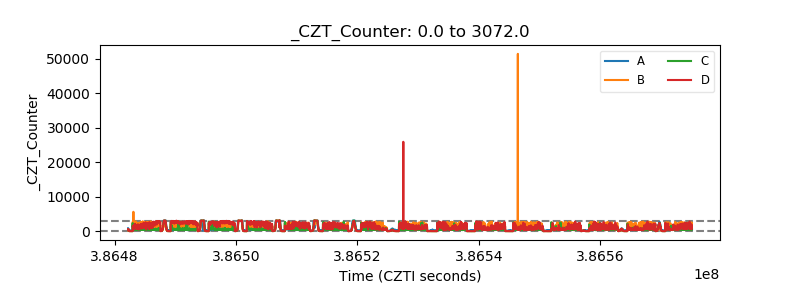 |
| +2.5 Volts monitor | 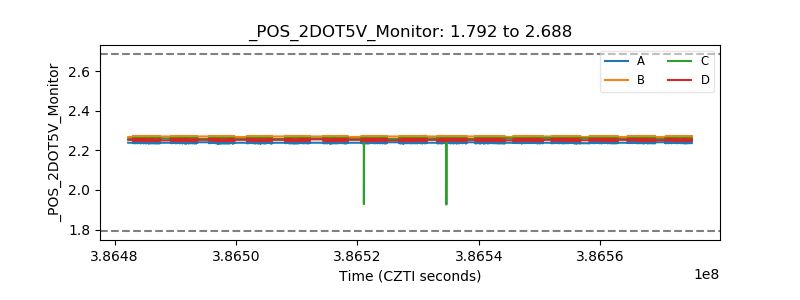 |
| +5 Volts monitor | 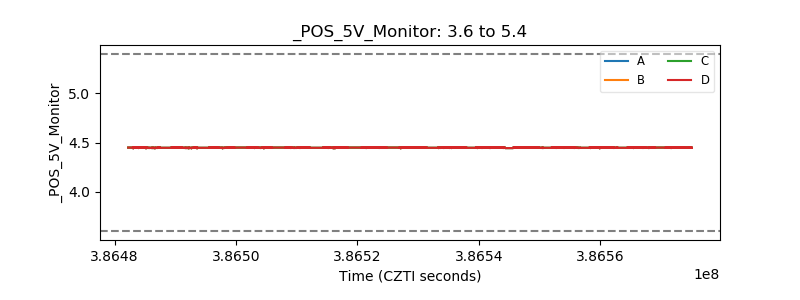 |
| _ROLL_ROT | 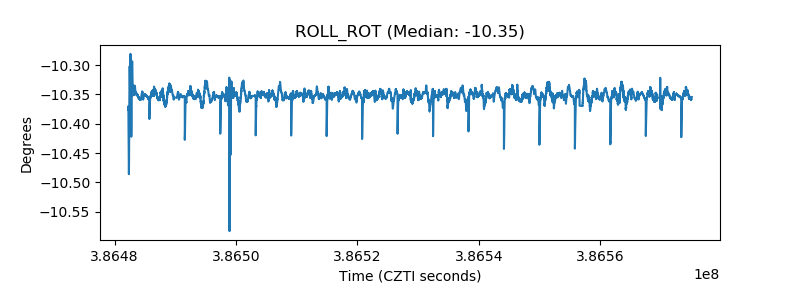 |
| _Roll_DEC | 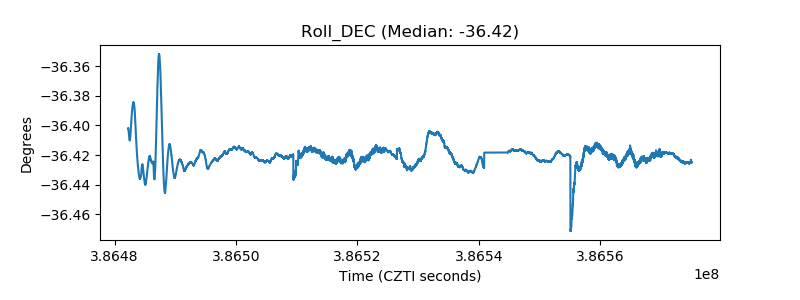 |
| _Roll_RA |  |
| Veto Counter | 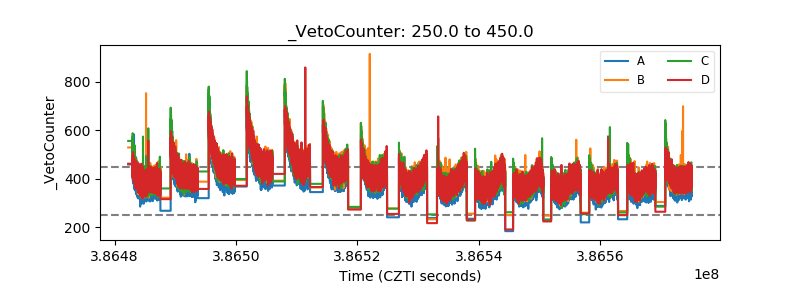 |