| Param | Original file | Final file |
|---|---|---|
| Filename | modeM0/AS1T05_016T01_9000005048_35189cztM0_level2.evt | modeM0/AS1T05_016T01_9000005048_35189cztM0_level2_quad_clean.evt |
| Size (bytes) | 560,482,560 | 65,073,600 |
| Size | 534.5 MB | 62.1 MB |
| Events in quadrant A | 1,765,429 | 476,172 |
| Events in quadrant B | 6,073,231 | 370,715 |
| Events in quadrant C | 1,874,606 | 473,900 |
| Events in quadrant D | 6,999,530 | 375,193 |
| Mode SS | |||
|---|---|---|---|
| Quadrant | BADHDUFLAG | Total packets | Discarded packets |
| A | 0 | 76 | 0 |
| B | 0 | 76 | 0 |
| C | 0 | 76 | 0 |
| D | 0 | 76 | 0 |
| Mode M0 | |||
|---|---|---|---|
| Quadrant | BADHDUFLAG | Total packets | Discarded packets |
| A | 0 | 7784 | 0 |
| B | 0 | 20702 | 0 |
| C | 0 | 7894 | 0 |
| D | 0 | 23456 | 0 |
| Quadrant | Total seconds | Saturated seconds | Saturation percentage |
|---|---|---|---|
| A | 3869 | 1 | 0.025846% |
| B | 3869 | 1718 | 44.404239% |
| C | 3869 | 3 | 0.077539% |
| D | 3869 | 1425 | 36.831223% |
Noise dominated data is calculated using 1-second bins in cleaned event files. If a bin has >2000 counts, and if more than 50% of those come from <1% of pixels, then it is considered to be noise-dominated and hence unusable.
| Quadrant | # 1 sec bins | Bins with >0 counts | Bins with >2000 counts | High rate bins dominated by noise | Noise dominated (total time) | Noise dominated (detector-on time) | Marked lightcurve |
|---|---|---|---|---|---|---|---|
| A | 3869 | 3869 | 1 | 1 | 0.03% | 0.03% | 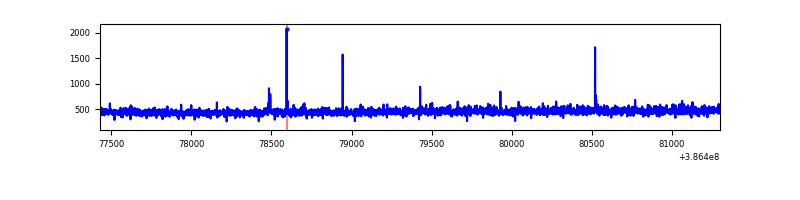 |
| B | 3869 | 3869 | 1230 | 1230 | 31.79% | 31.79% | 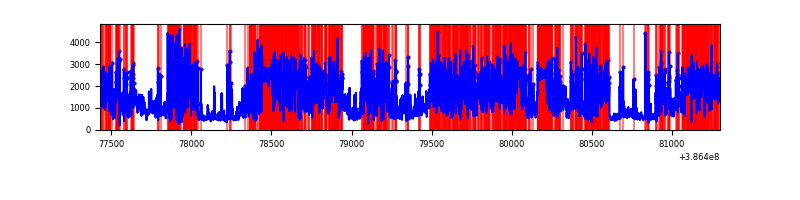 |
| C | 3869 | 3869 | 4 | 4 | 0.10% | 0.10% | 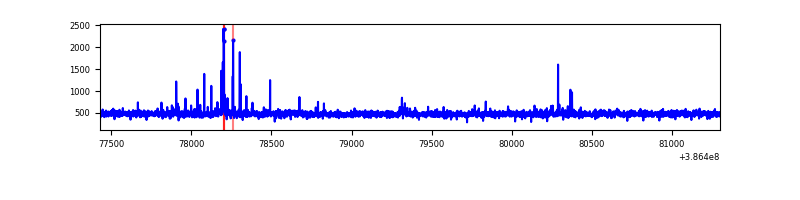 |
| D | 3869 | 3869 | 1408 | 1408 | 36.39% | 36.39% | 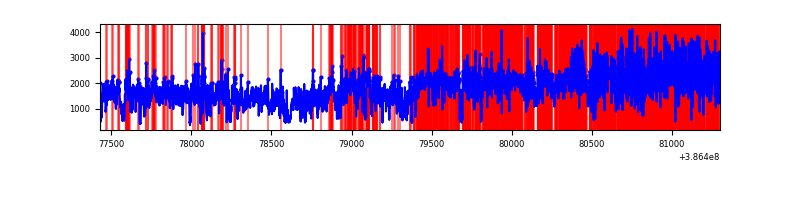 |
Top three noisy pixels from each quadrant. If the there are fewer than three noisy pixels in the level2.evt file, extra rows are filled as -1
| Pixel properties | Quadrant properties | ||||||
|---|---|---|---|---|---|---|---|
| Quadrant | DetID | PixID | Counts | Sigma | Mean | Median | Sigma |
| A | 10 | 83 | 29731 | 325.54 | 441 | 431 | 90.0 |
| A | 7 | 16 | 10506 | 111.94 | 441 | 431 | 90.0 |
| A | 13 | 6 | 10424 | 111.03 | 441 | 431 | 90.0 |
| B | 5 | 236 | 4387104 | 63867.13 | 352 | 344 | 68.7 |
| B | 5 | 172 | 257633 | 3745.89 | 352 | 344 | 68.7 |
| B | 5 | 200 | 19154 | 273.86 | 352 | 344 | 68.7 |
| C | 15 | 214 | 154025 | 1547.29 | 424 | 427 | 99.3 |
| C | 1 | 23 | 24204 | 239.52 | 424 | 427 | 99.3 |
| C | 0 | 10 | 18843 | 185.52 | 424 | 427 | 99.3 |
| D | 8 | 195 | 4071913 | 42882.97 | 380 | 367 | 94.9 |
| D | 2 | 120 | 864402 | 9100.32 | 380 | 367 | 94.9 |
| D | 12 | 233 | 161860 | 1700.9 | 380 | 367 | 94.9 |
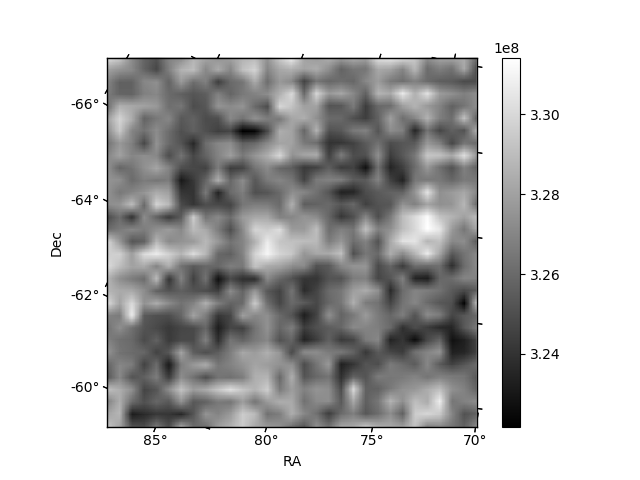
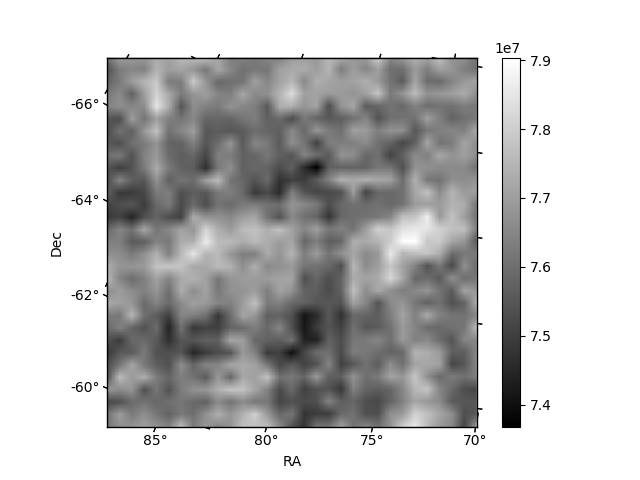
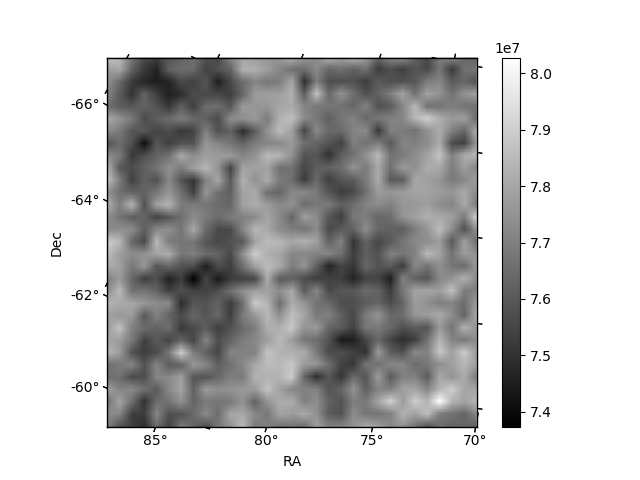
Histogram calculated using DETX and DETY for each event in the final _common_clean file
| Quadrant A | 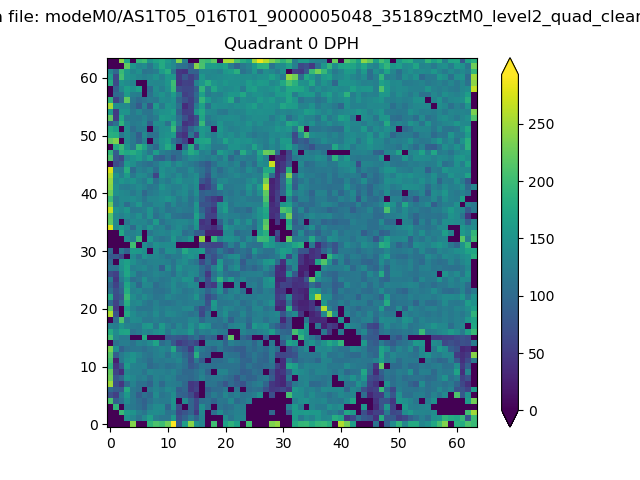 |
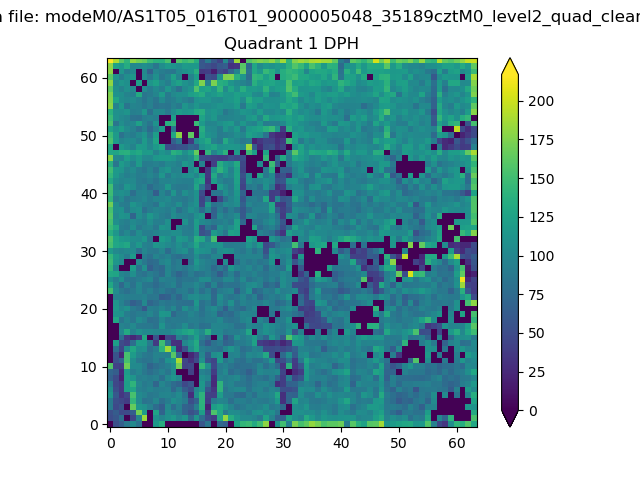 |
Quadrant B |
|---|---|---|---|
| Quadrant D | 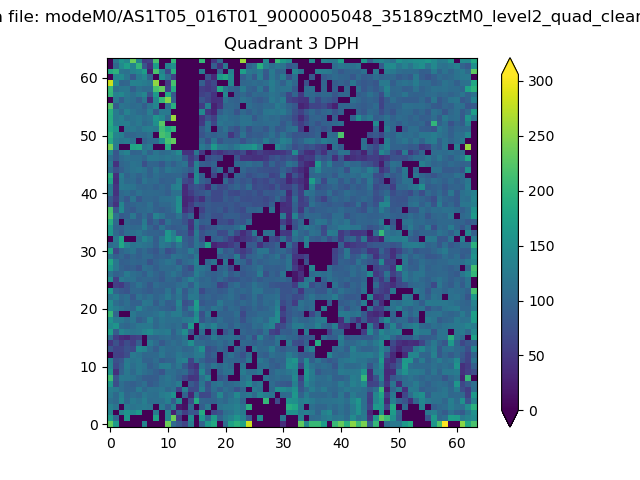 |
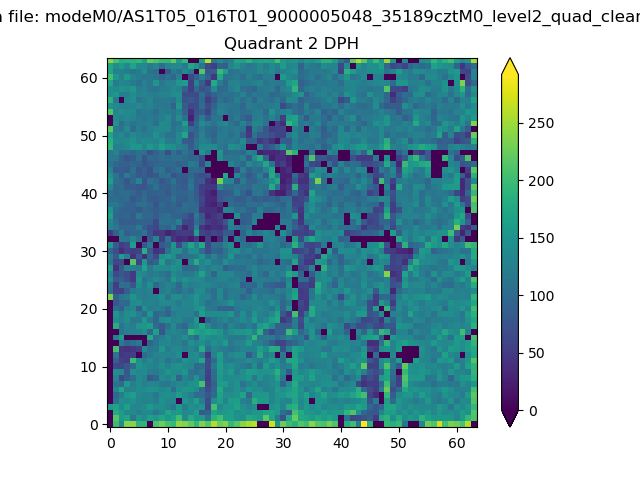 |
Quadrant C |
| Plot type | Count rate plots | Images |
|---|---|---|
| Comparison with Poisson distribution Blue bars denote a histogram of data divided into 1 sec bins. Red curve is a Poisson curve with rate = median count rate of data. |
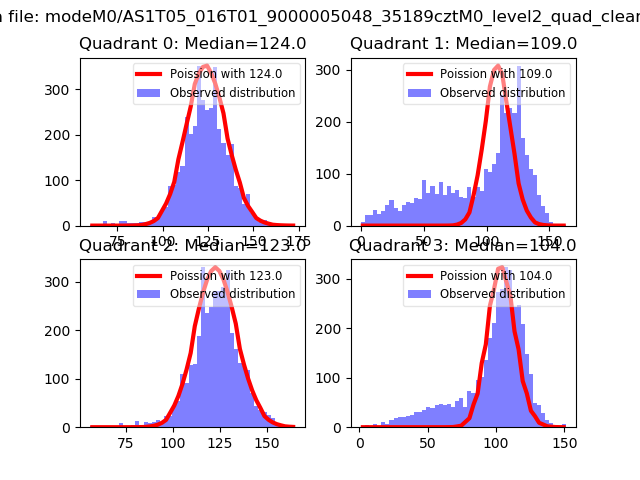 |
 |
| Quadrant-wise count rates Data is divided into 100 sec bins |
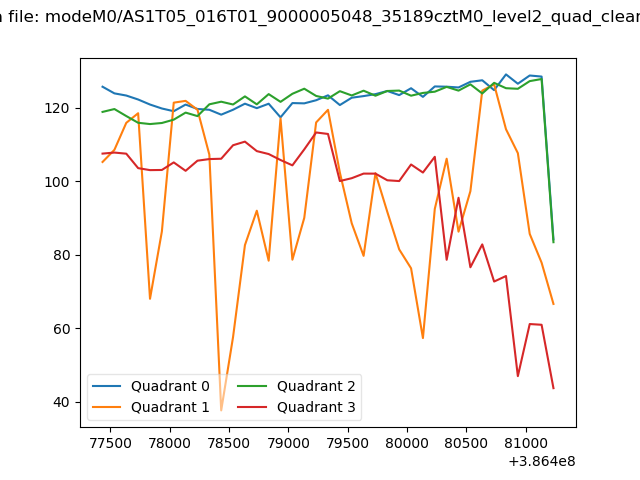 |
|
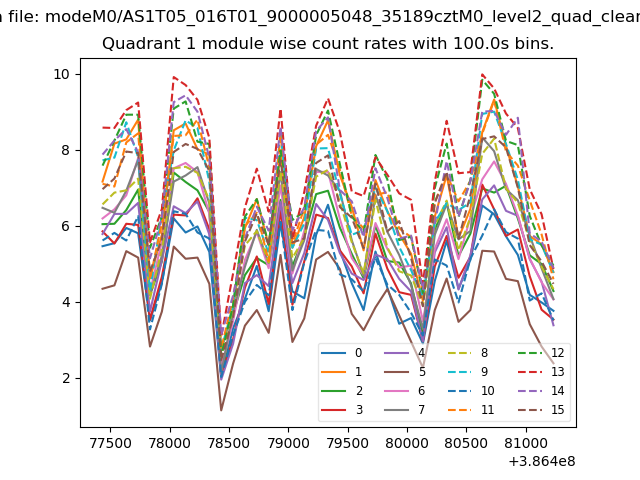
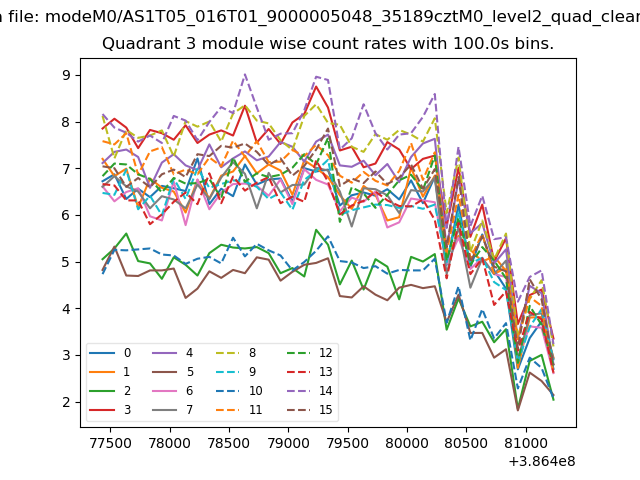
| Module-wise count rates for Quadrant A Data is divided into 100 sec bins |
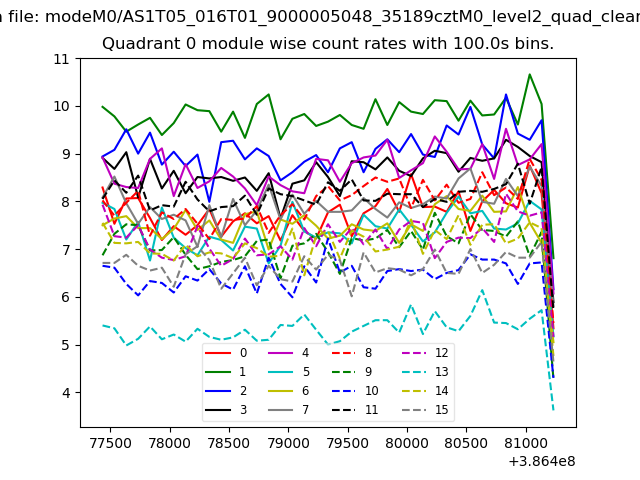 |
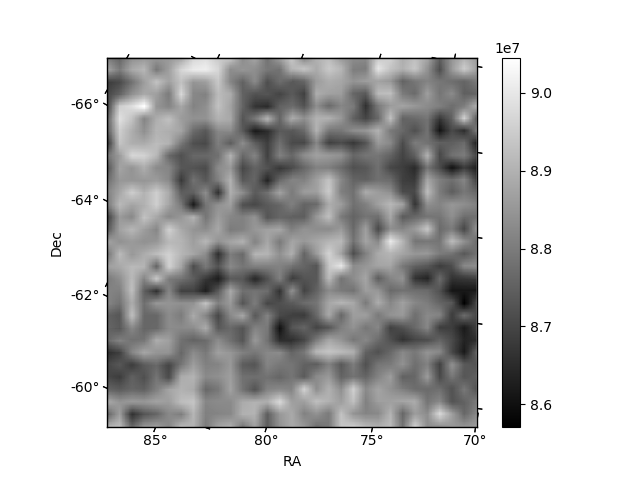 |
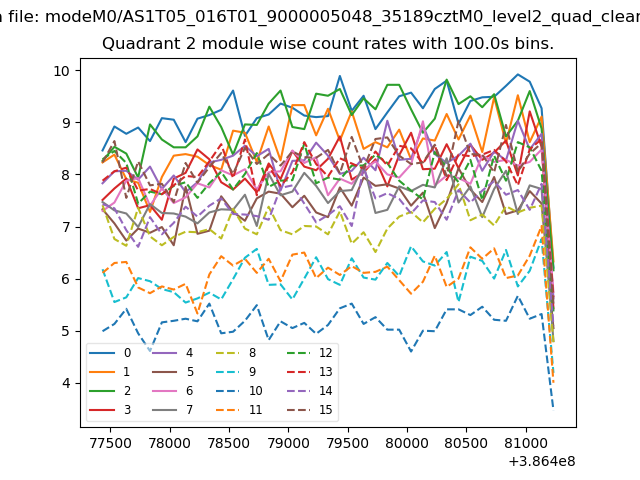
| Module-wise count rates for Quadrant B Data is divided into 100 sec bins |
 |
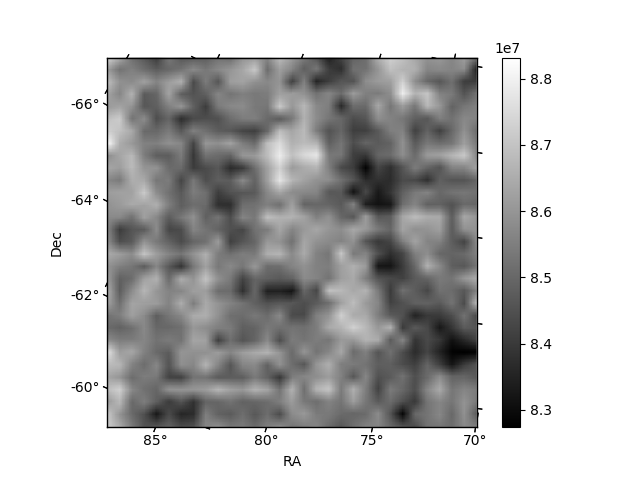 |
| Module-wise count rates for Quadrant C Data is divided into 100 sec bins |
 |
 |
| Module-wise count rates for Quadrant D Data is divided into 100 sec bins |
 |
 |
| Parameter | Plot |
|---|---|
| CZT HV Monitor | 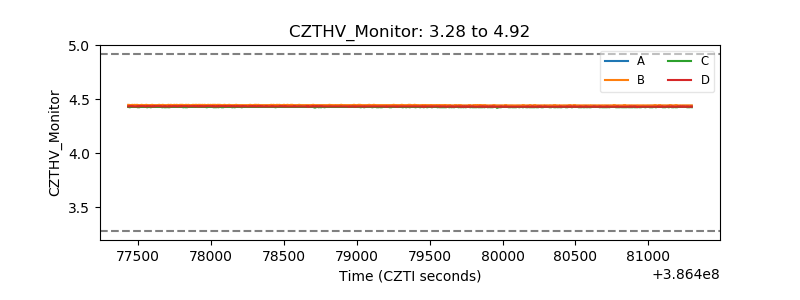 |
| D_VDD | 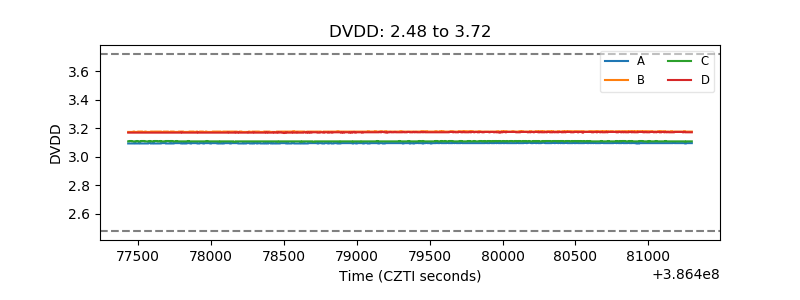 |
| Temperature 1 | 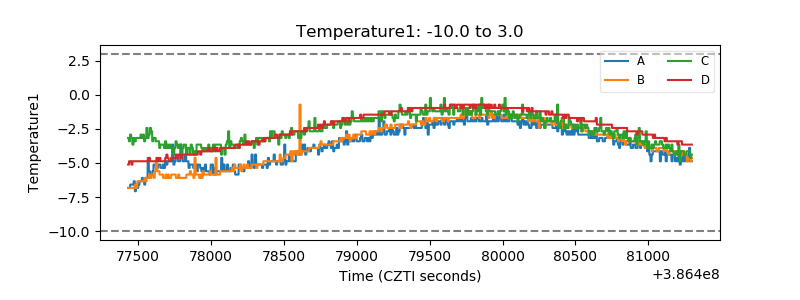 |
| Veto HV Monitor | 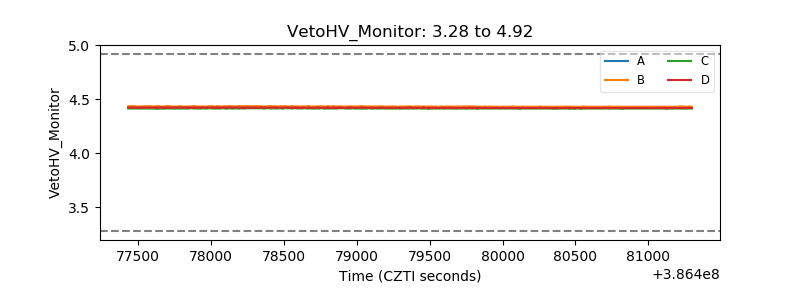 |
| Veto LLD | 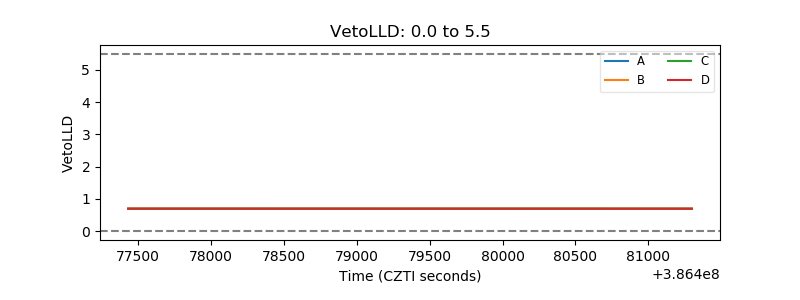 |
| Alpha Counter | 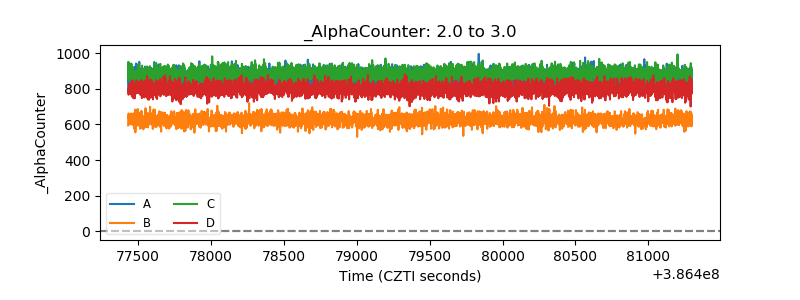 |
| _CPM_Rate | 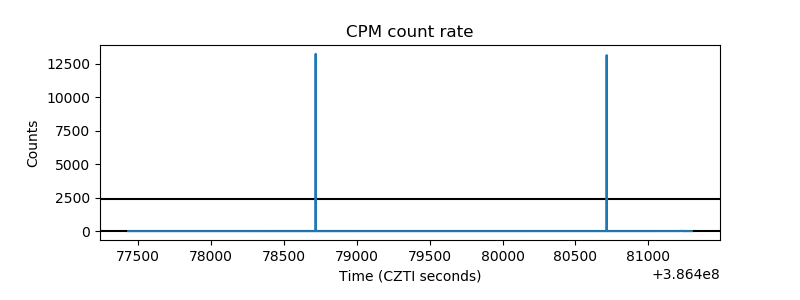 |
| CZT Counter | 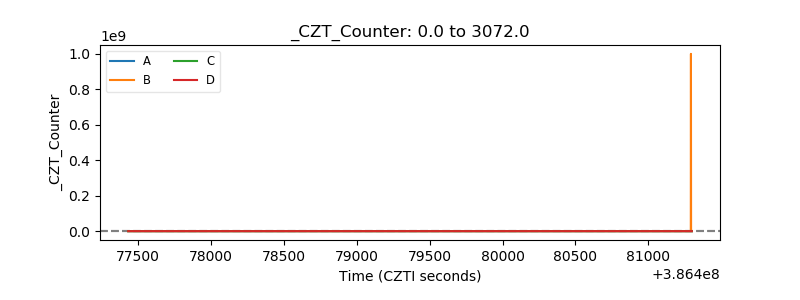 |
| +2.5 Volts monitor | 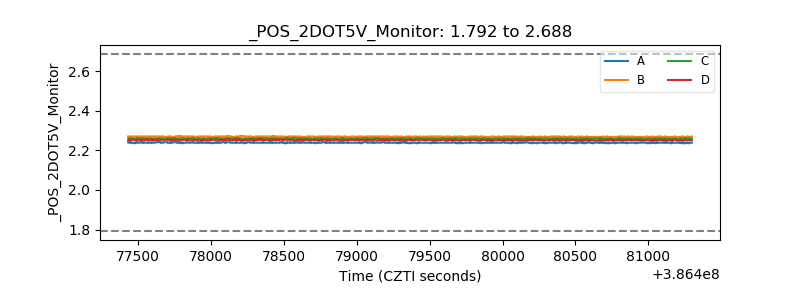 |
| +5 Volts monitor | 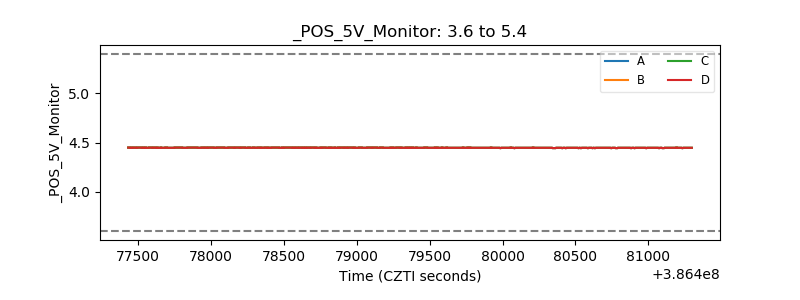 |
| _ROLL_ROT | 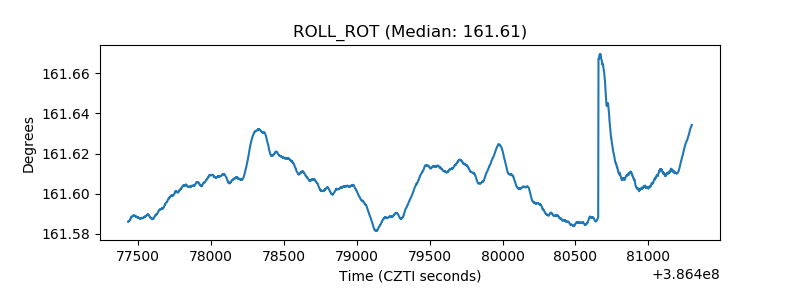 |
| _Roll_DEC | 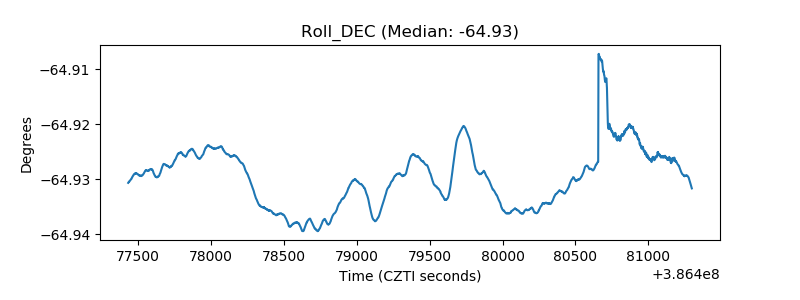 |
| _Roll_RA | 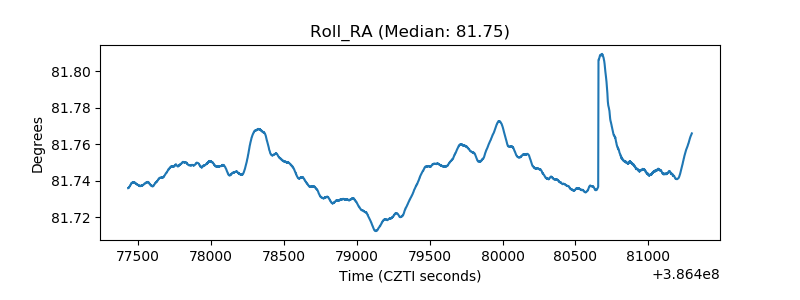 |
| Veto Counter | 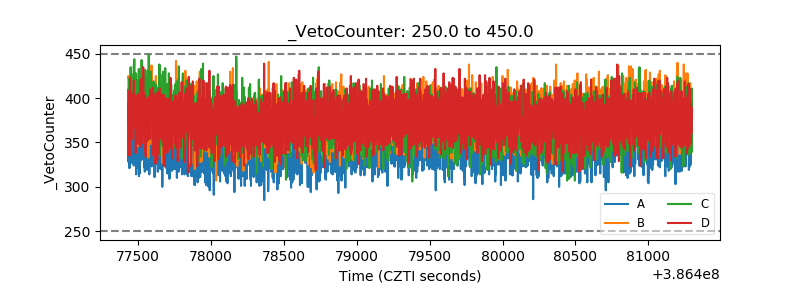 |