| Param | Original file | Final file |
|---|---|---|
| Filename | modeM0/AS1T05_016T01_9000005048cztM0_level2_bc.evt | modeM0/AS1T05_016T01_9000005048cztM0_level2_quad_clean.evt |
| Size (bytes) | 836,640,000 | 150,828,480 |
| Size | 797.9 MB | 143.8 MB |
| Events in quadrant A | 1,871,418 | 1,109,619 |
| Events in quadrant B | 8,053,001 | 852,869 |
| Events in quadrant C | 2,317,700 | 1,092,841 |
| Events in quadrant D | 12,479,508 | 886,389 |
| Mode SS | |||
|---|---|---|---|
| Quadrant | BADHDUFLAG | Total packets | Discarded packets |
| A | 0 | 180 | 0 |
| B | 0 | 180 | 0 |
| C | 0 | 180 | 0 |
| D | 0 | 180 | 0 |
| Mode M9 | |||
|---|---|---|---|
| Quadrant | BADHDUFLAG | Total packets | Discarded packets |
| A | 0 | 14 | 0 |
| B | 0 | 14 | 0 |
| C | 0 | 14 | 0 |
| D | 0 | 14 | 0 |
| Mode M0 | |||
|---|---|---|---|
| Quadrant | BADHDUFLAG | Total packets | Discarded packets |
| A | 0 | 18150 | 0 |
| B | 0 | 49719 | 0 |
| C | 0 | 18828 | 0 |
| D | 0 | 52976 | 0 |
| Quadrant | Total seconds | Saturated seconds | Saturation percentage |
|---|---|---|---|
| A | 8980 | 11 | 0.122494% |
| B | 8980 | 4439 | 49.432071% |
| C | 8980 | 46 | 0.512249% |
| D | 8980 | 3036 | 33.808463% |
Noise dominated data is calculated using 1-second bins in cleaned event files. If a bin has >2000 counts, and if more than 50% of those come from <1% of pixels, then it is considered to be noise-dominated and hence unusable.
| Quadrant | # 1 sec bins | Bins with >0 counts | Bins with >2000 counts | High rate bins dominated by noise | Noise dominated (total time) | Noise dominated (detector-on time) | Marked lightcurve |
|---|---|---|---|---|---|---|---|
| A | 10443 | 8981 | 0 | 0 | 0.00% | 0.00% | 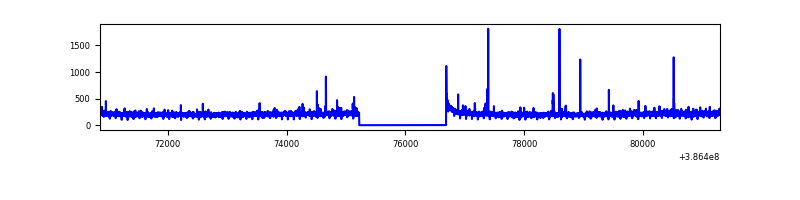 |
| B | 10443 | 8977 | 79 | 79 | 0.76% | 0.88% | 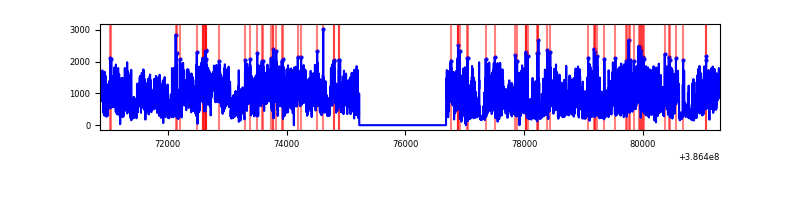 |
| C | 10443 | 8980 | 13 | 13 | 0.12% | 0.14% | 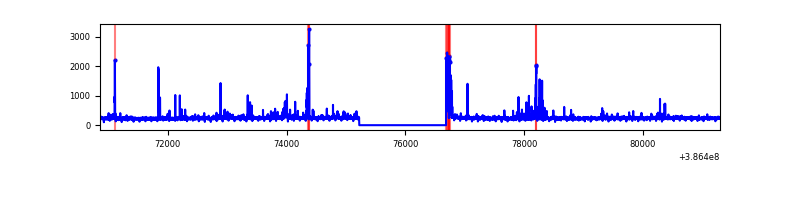 |
| D | 10443 | 8980 | 981 | 981 | 9.39% | 10.92% | 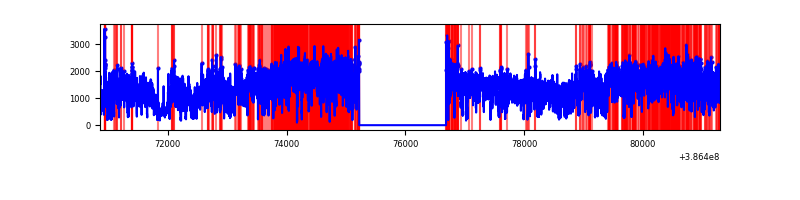 |
Top three noisy pixels from each quadrant. If the there are fewer than three noisy pixels in the level2.evt file, extra rows are filled as -1
| Pixel properties | Quadrant properties | ||||||
|---|---|---|---|---|---|---|---|
| Quadrant | DetID | PixID | Counts | Sigma | Mean | Median | Sigma |
| A | 10 | 83 | 92920 | 917.62 | 444 | 435 | 100.8 |
| A | 13 | 6 | 21919 | 213.16 | 444 | 435 | 100.8 |
| A | 13 | 254 | 15389 | 148.37 | 444 | 435 | 100.8 |
| B | 5 | 236 | 6403783 | 87434.81 | 347 | 341 | 73.2 |
| B | 5 | 172 | 234835 | 3201.86 | 347 | 341 | 73.2 |
| B | 4 | 232 | 24877 | 335.02 | 347 | 341 | 73.2 |
| C | 15 | 214 | 348909 | 3428.16 | 432 | 428 | 101.7 |
| C | 0 | 10 | 133663 | 1310.69 | 432 | 428 | 101.7 |
| C | 1 | 23 | 66550 | 650.47 | 432 | 428 | 101.7 |
| D | 8 | 195 | 9336583 | 95456.42 | 386 | 371 | 97.8 |
| D | 2 | 120 | 477112 | 4874.35 | 386 | 371 | 97.8 |
| D | 7 | 80 | 294902 | 3011.38 | 386 | 371 | 97.8 |
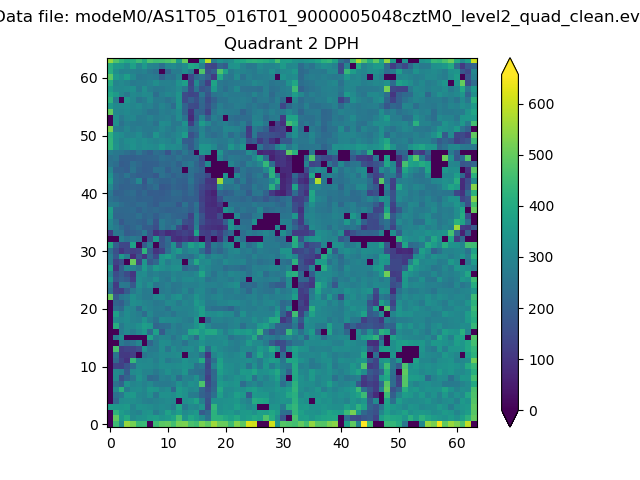
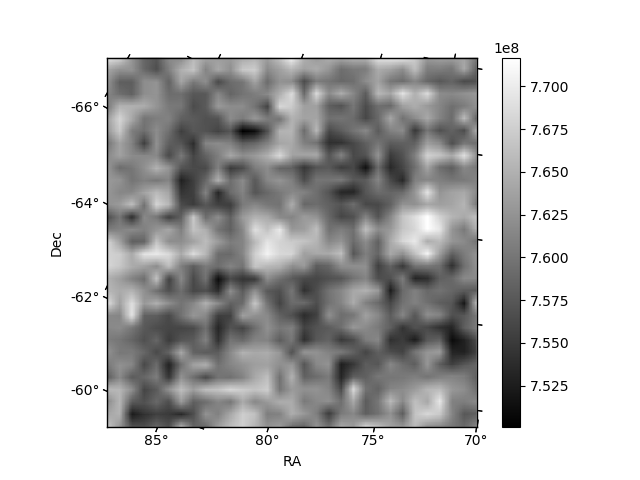
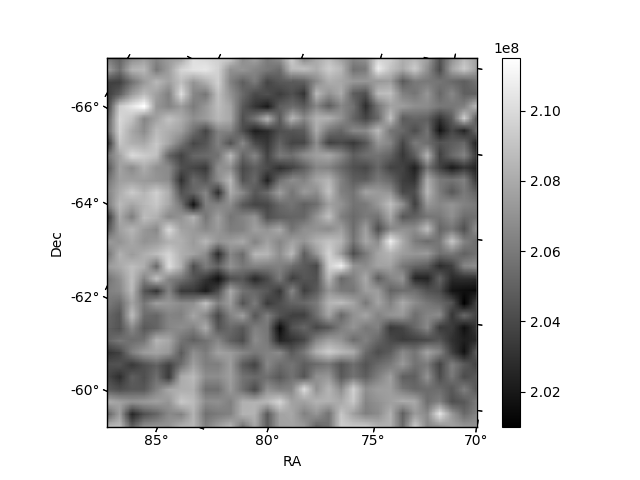
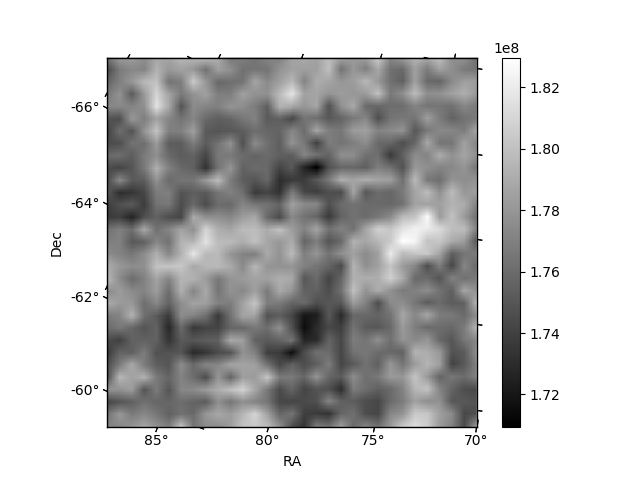
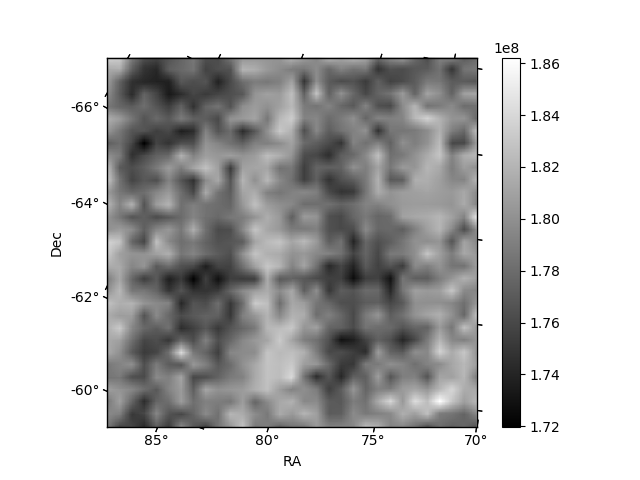
Histogram calculated using DETX and DETY for each event in the final _common_clean file
| Quadrant A | 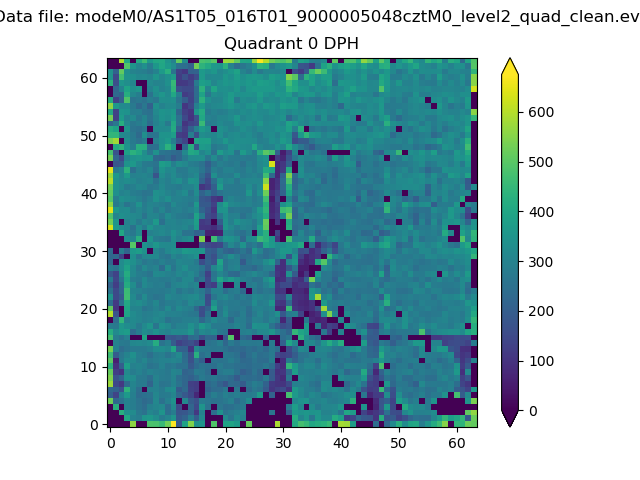 |
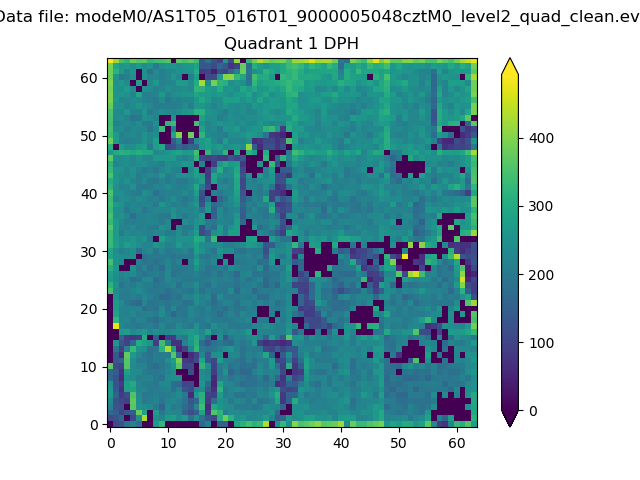 |
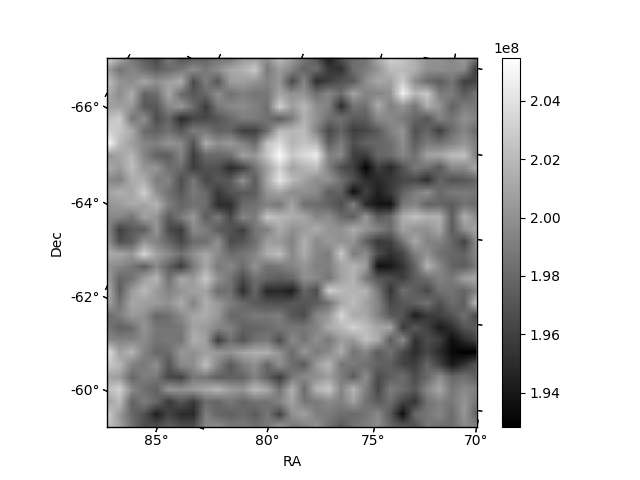
Quadrant B |
|---|---|---|---|
| Quadrant D | 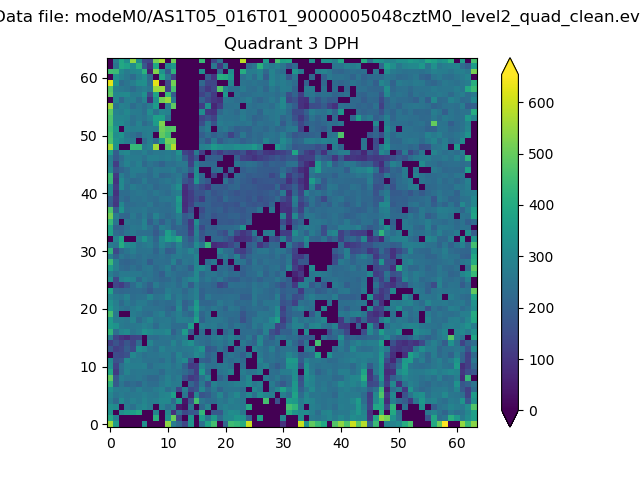 |
 |
Quadrant C |
| Plot type | Count rate plots | Images |
|---|---|---|
| Comparison with Poisson distribution Blue bars denote a histogram of data divided into 1 sec bins. Red curve is a Poisson curve with rate = median count rate of data. |
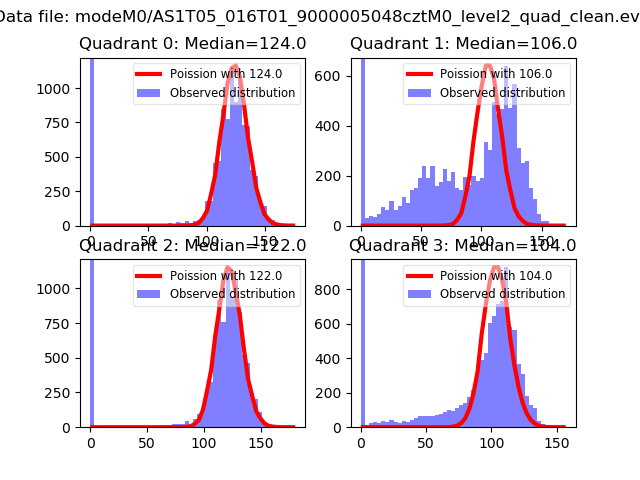 |
 |
| Quadrant-wise count rates Data is divided into 100 sec bins |
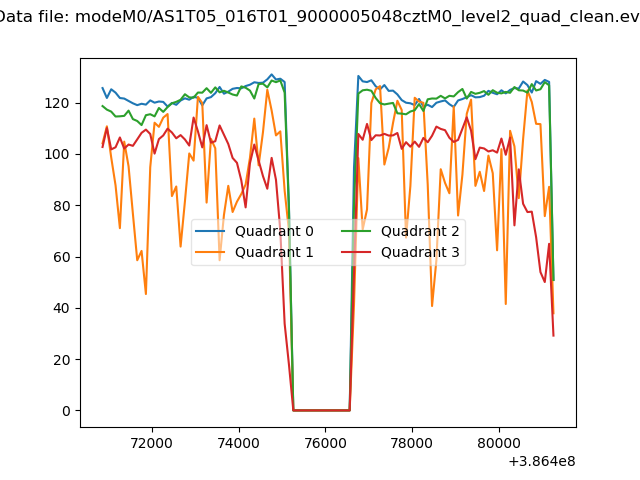 |
|
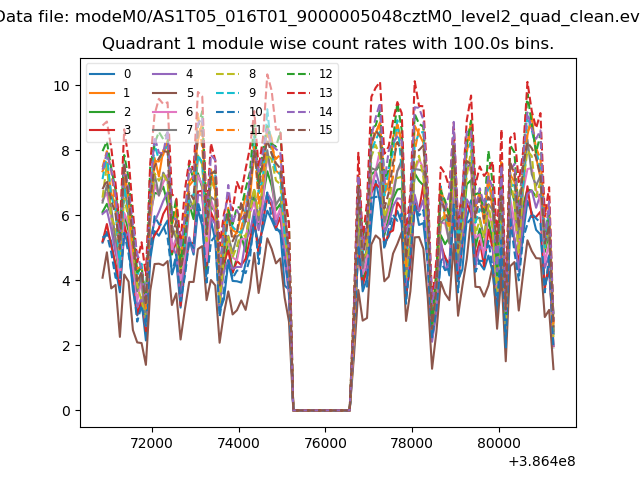
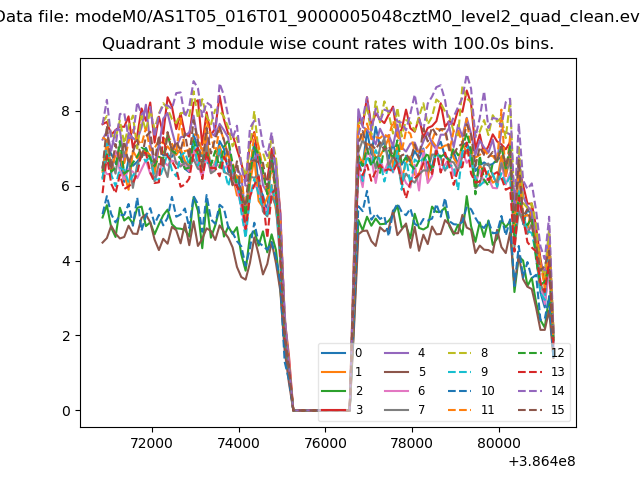
| Module-wise count rates for Quadrant A Data is divided into 100 sec bins |
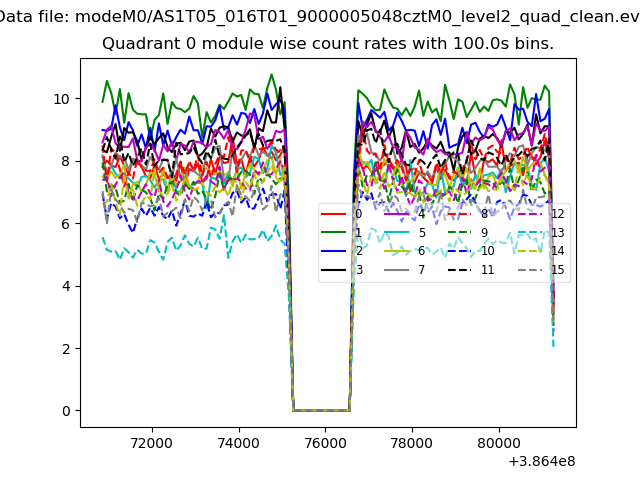 |
 |
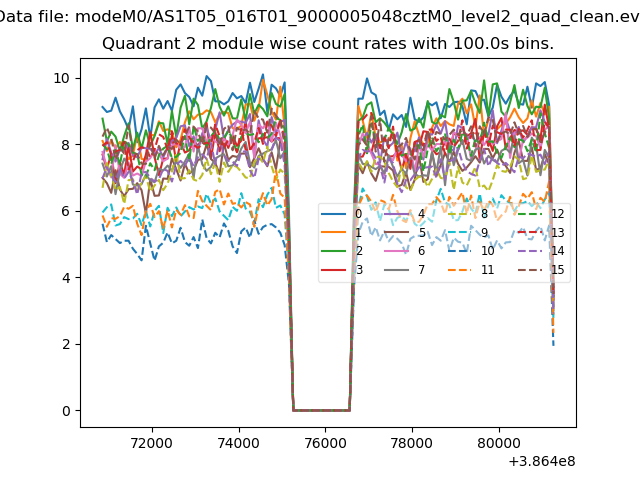
| Module-wise count rates for Quadrant B Data is divided into 100 sec bins |
 |
 |
| Module-wise count rates for Quadrant C Data is divided into 100 sec bins |
 |
 |
| Module-wise count rates for Quadrant D Data is divided into 100 sec bins |
 |
 |
| Parameter | Plot |
|---|---|
| CZT HV Monitor | 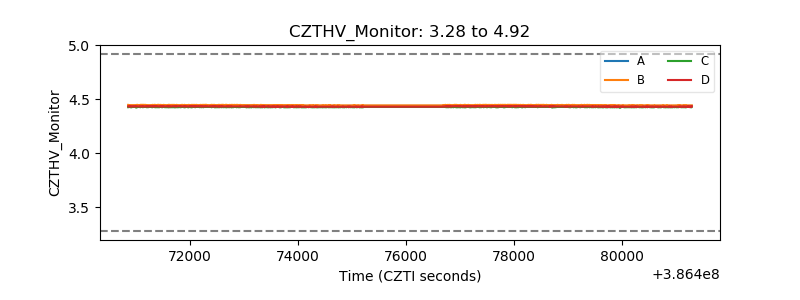 |
| D_VDD | 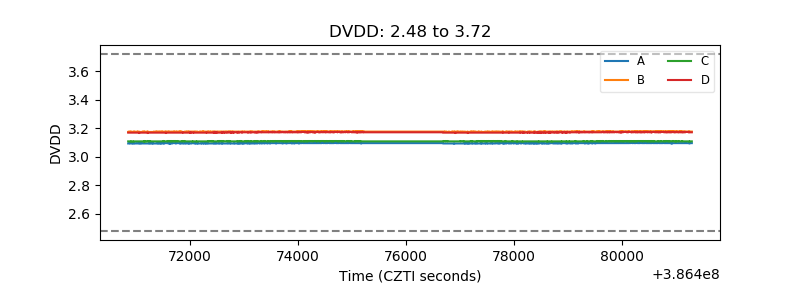 |
| Temperature 1 | 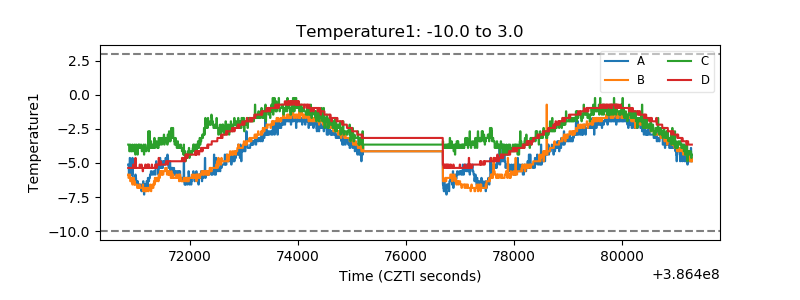 |
| Veto HV Monitor | 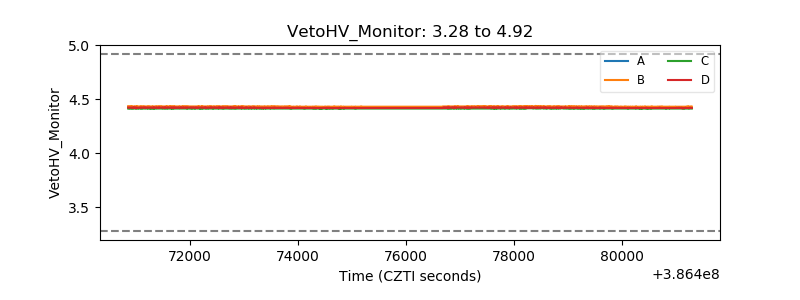 |
| Veto LLD | 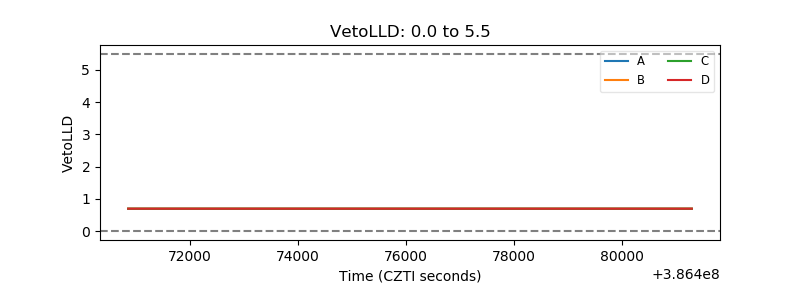 |
| Alpha Counter | 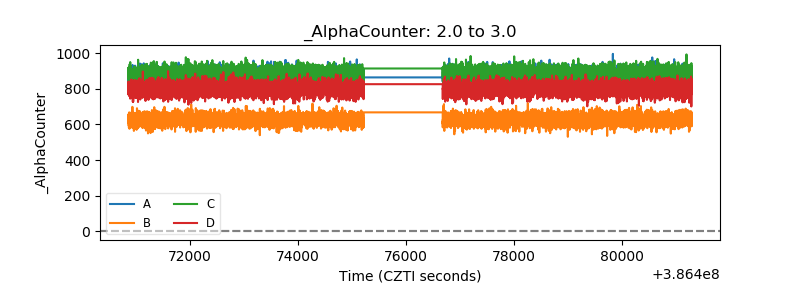 |
| _CPM_Rate | 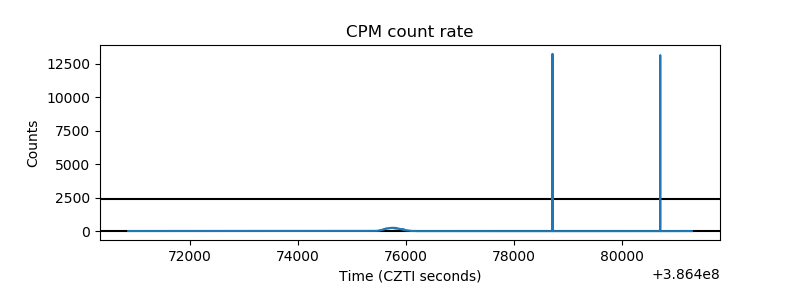 |
| CZT Counter | 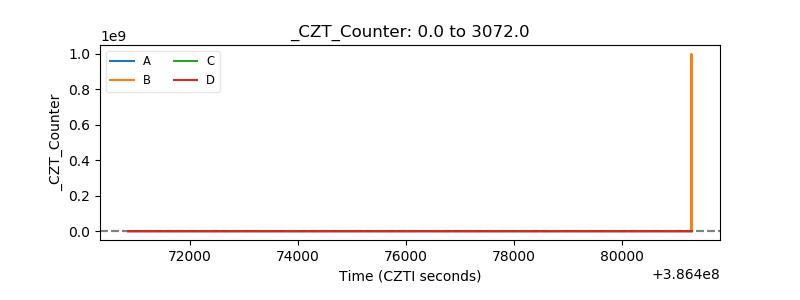 |
| +2.5 Volts monitor | 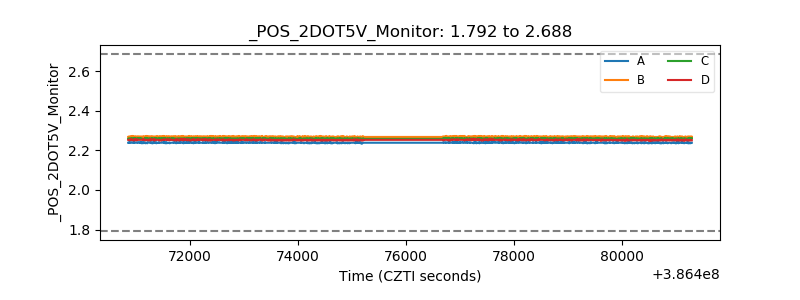 |
| +5 Volts monitor | 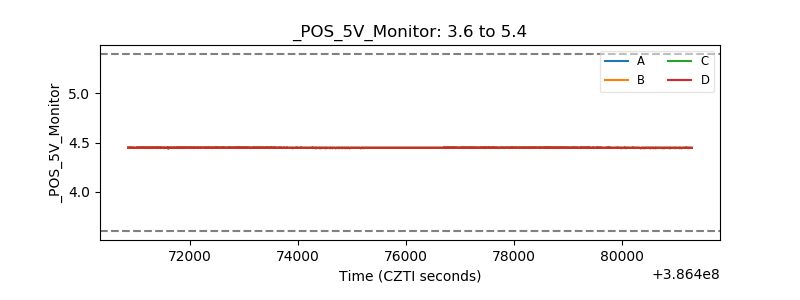 |
| _ROLL_ROT | 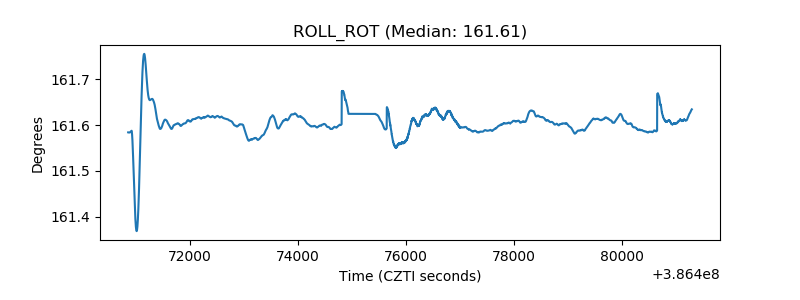 |
| _Roll_DEC | 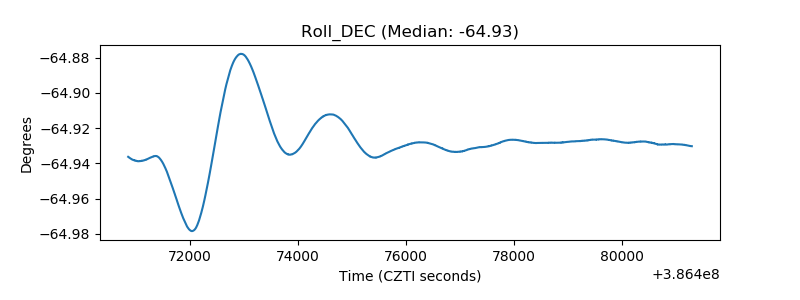 |
| _Roll_RA | 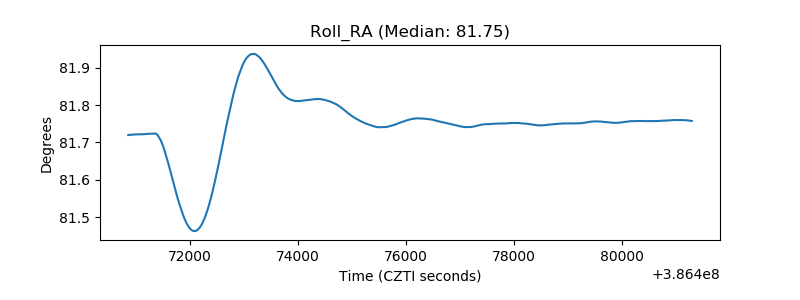 |
| Veto Counter | 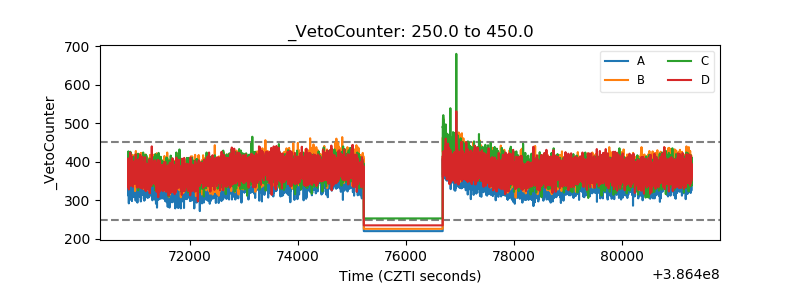 |