| Param | Original file | Final file |
|---|---|---|
| Filename | modeM0/AS1C07_001T06_9000005046_35180cztM0_level2.evt | modeM0/AS1C07_001T06_9000005046_35180cztM0_level2_quad_clean.evt |
| Size (bytes) | 915,546,240 | 98,501,760 |
| Size | 873.1 MB | 93.9 MB |
| Events in quadrant A | 2,636,927 | 719,335 |
| Events in quadrant B | 10,064,985 | 540,937 |
| Events in quadrant C | 3,186,687 | 735,716 |
| Events in quadrant D | 11,447,470 | 577,647 |
| Mode SS | |||
|---|---|---|---|
| Quadrant | BADHDUFLAG | Total packets | Discarded packets |
| A | 0 | 120 | 0 |
| B | 0 | 120 | 0 |
| C | 0 | 120 | 0 |
| D | 0 | 120 | 0 |
| Mode M0 | |||
|---|---|---|---|
| Quadrant | BADHDUFLAG | Total packets | Discarded packets |
| A | 0 | 11882 | 3 |
| B | 0 | 33935 | 2 |
| C | 0 | 13125 | 2 |
| D | 0 | 38016 | 2 |
| Mode M9 | |||
|---|---|---|---|
| Quadrant | BADHDUFLAG | Total packets | Discarded packets |
| A | 0 | 19 | 0 |
| B | 0 | 19 | 0 |
| C | 0 | 19 | 0 |
| D | 0 | 20 | 0 |
| Quadrant | Total seconds | Saturated seconds | Saturation percentage |
|---|---|---|---|
| A | 5814 | 8 | 0.137599% |
| B | 5814 | 3071 | 52.820777% |
| C | 5814 | 103 | 1.771586% |
| D | 5814 | 2679 | 46.078431% |
Noise dominated data is calculated using 1-second bins in cleaned event files. If a bin has >2000 counts, and if more than 50% of those come from <1% of pixels, then it is considered to be noise-dominated and hence unusable.
| Quadrant | # 1 sec bins | Bins with >0 counts | Bins with >2000 counts | High rate bins dominated by noise | Noise dominated (total time) | Noise dominated (detector-on time) | Marked lightcurve |
|---|---|---|---|---|---|---|---|
| A | 7127 | 5815 | 0 | 0 | 0.00% | 0.00% |  |
| B | 7127 | 5815 | 2220 | 2220 | 31.15% | 38.18% | 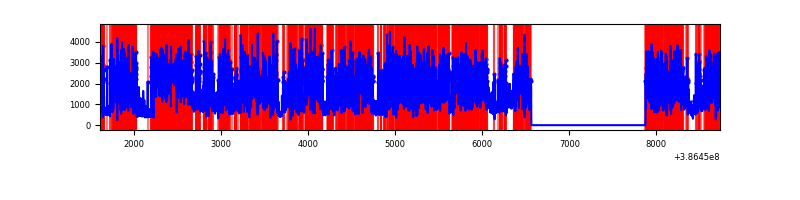 |
| C | 7127 | 5815 | 74 | 74 | 1.04% | 1.27% | 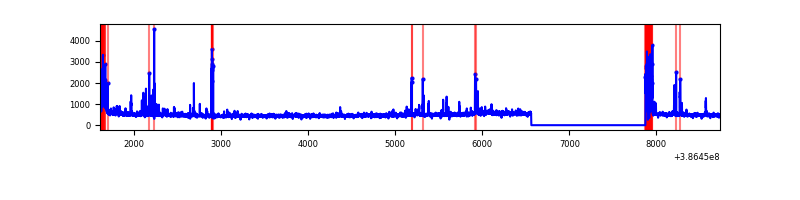 |
| D | 7127 | 5815 | 2965 | 2965 | 41.60% | 50.99% | 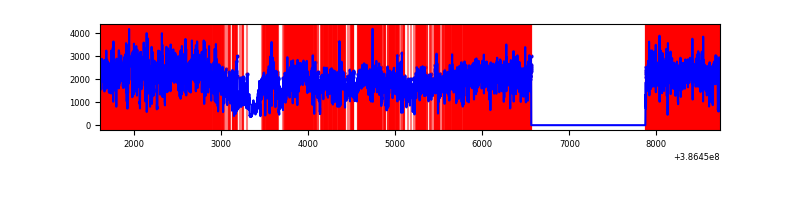 |
Top three noisy pixels from each quadrant. If the there are fewer than three noisy pixels in the level2.evt file, extra rows are filled as -1
| Pixel properties | Quadrant properties | ||||||
|---|---|---|---|---|---|---|---|
| Quadrant | DetID | PixID | Counts | Sigma | Mean | Median | Sigma |
| A | 10 | 83 | 100987 | 770.7 | 646 | 631 | 130.2 |
| A | 13 | 6 | 16560 | 122.33 | 646 | 631 | 130.2 |
| A | 13 | 254 | 9674 | 69.44 | 646 | 631 | 130.2 |
| B | 5 | 236 | 7829018 | 80852.36 | 507 | 493 | 96.8 |
| B | 5 | 172 | 150806 | 1552.42 | 507 | 493 | 96.8 |
| B | 5 | 200 | 34151 | 347.62 | 507 | 493 | 96.8 |
| C | 15 | 214 | 244166 | 1656.88 | 635 | 641 | 147.0 |
| C | 0 | 10 | 227414 | 1542.9 | 635 | 641 | 147.0 |
| C | 3 | 233 | 76200 | 514.08 | 635 | 641 | 147.0 |
| D | 8 | 195 | 7762582 | 53189.02 | 553 | 544 | 145.9 |
| D | 8 | 230 | 735315 | 5034.99 | 553 | 544 | 145.9 |
| D | 10 | 118 | 239795 | 1639.46 | 553 | 544 | 145.9 |
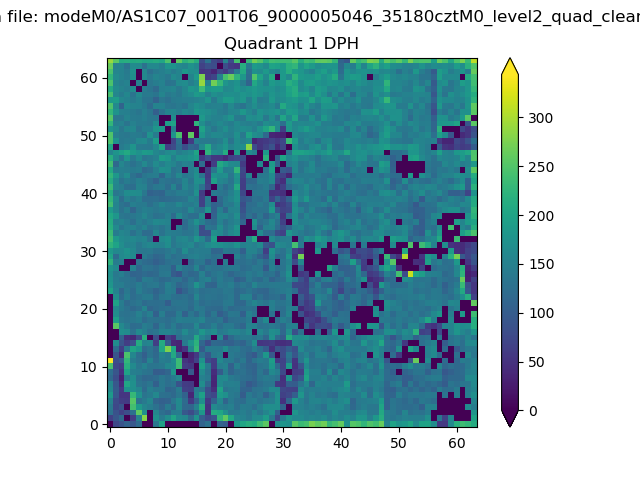
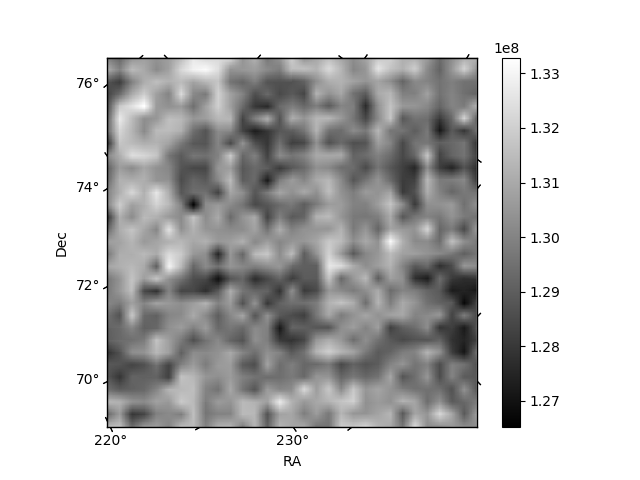
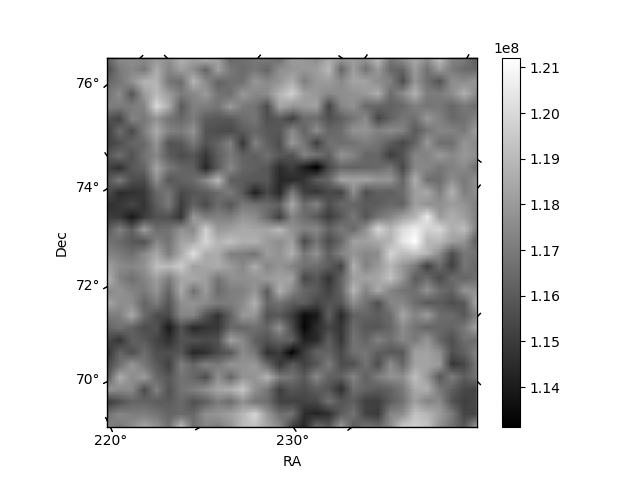
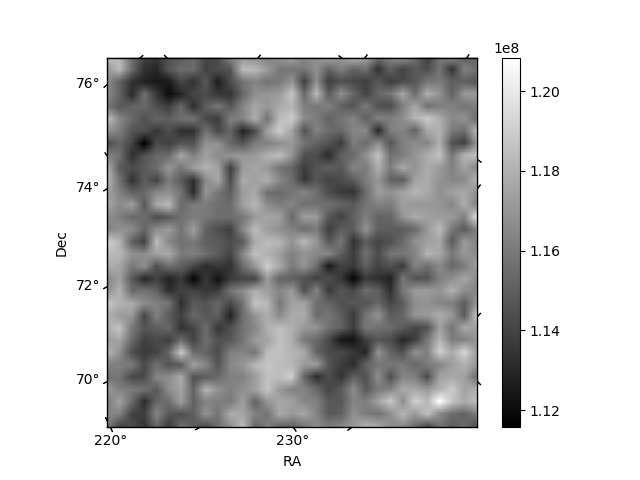
Histogram calculated using DETX and DETY for each event in the final _common_clean file
| Quadrant A | 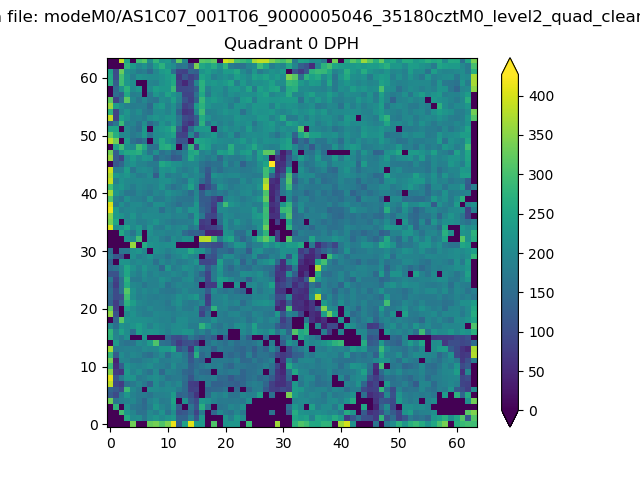 |
 |
Quadrant B |
|---|---|---|---|
| Quadrant D | 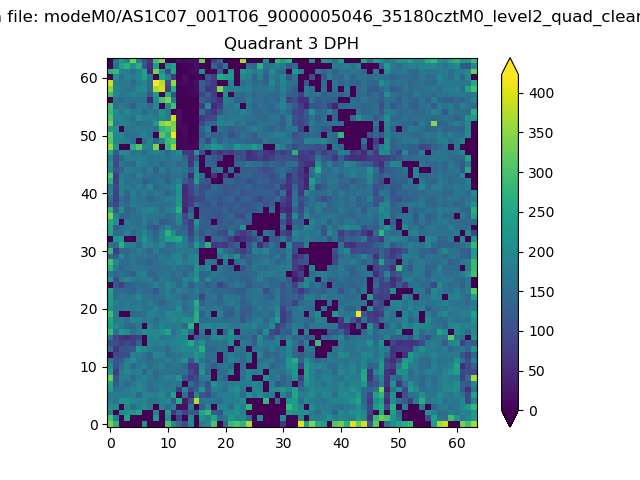 |
 |
Quadrant C |
| Plot type | Count rate plots | Images |
|---|---|---|
| Comparison with Poisson distribution Blue bars denote a histogram of data divided into 1 sec bins. Red curve is a Poisson curve with rate = median count rate of data. |
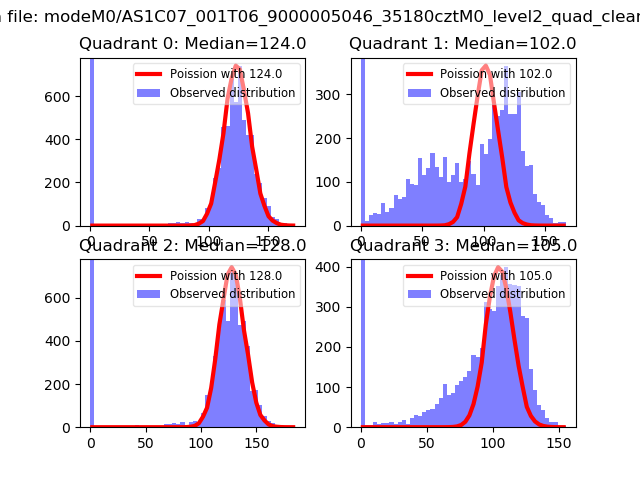 |
 |
| Quadrant-wise count rates Data is divided into 100 sec bins |
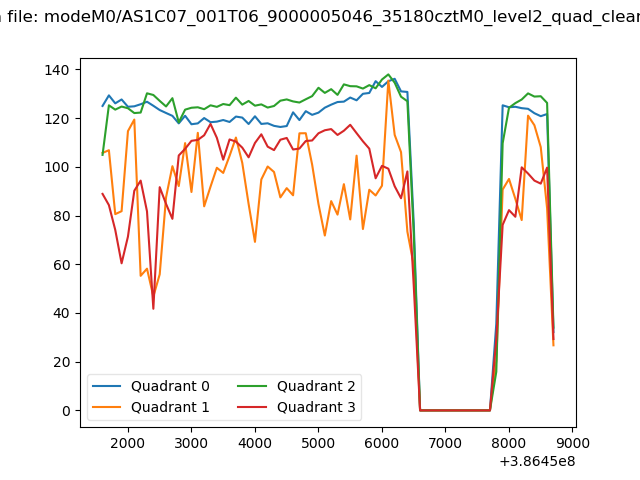 |
|
| Module-wise count rates for Quadrant A Data is divided into 100 sec bins |
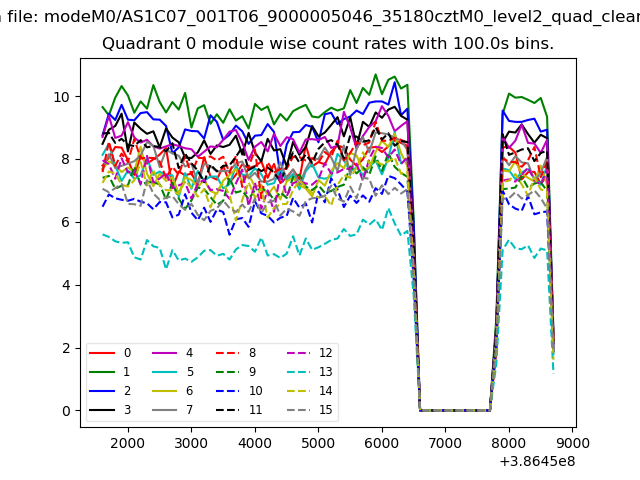 |
 |
| Module-wise count rates for Quadrant B Data is divided into 100 sec bins |
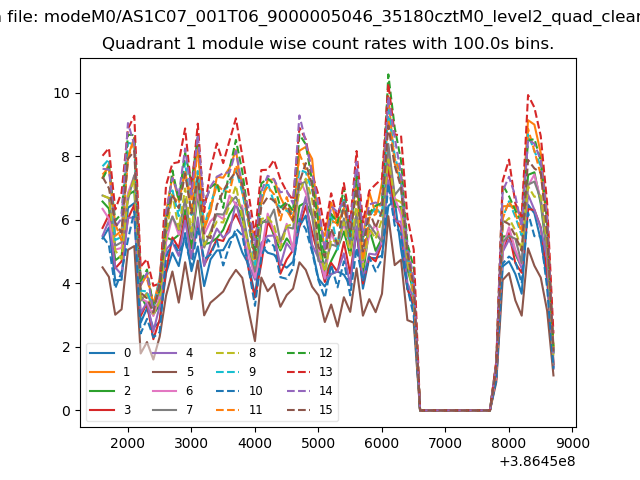 |
 |
| Module-wise count rates for Quadrant C Data is divided into 100 sec bins |
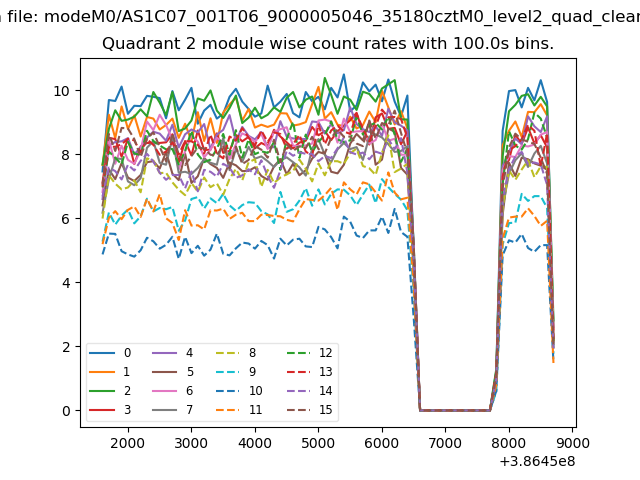 |
 |
| Module-wise count rates for Quadrant D Data is divided into 100 sec bins |
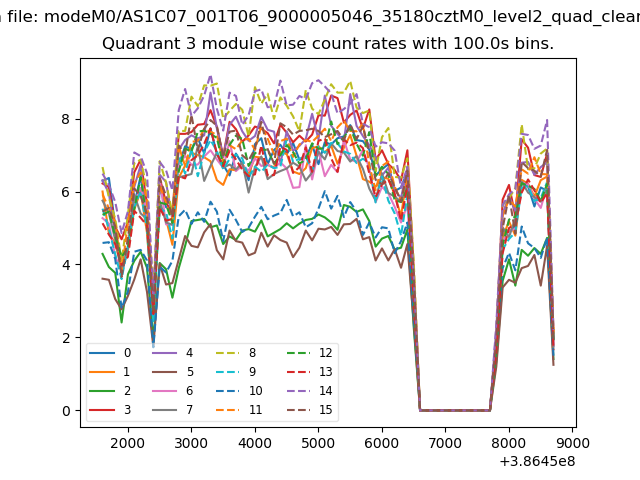 |
 |
| Parameter | Plot |
|---|---|
| CZT HV Monitor | 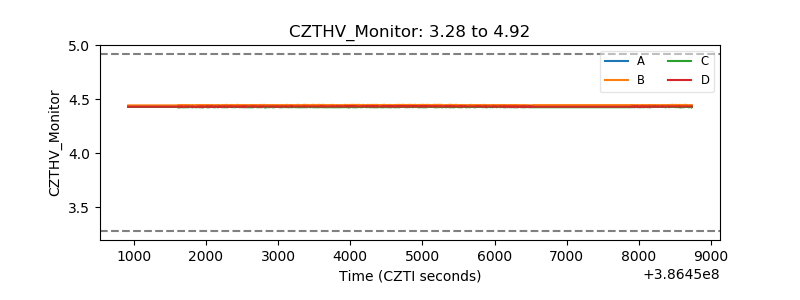 |
| D_VDD | 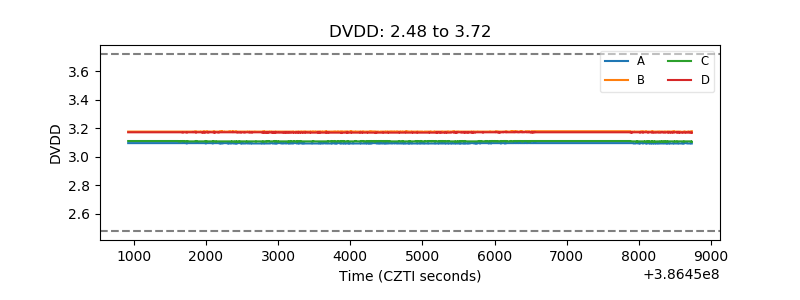 |
| Temperature 1 | 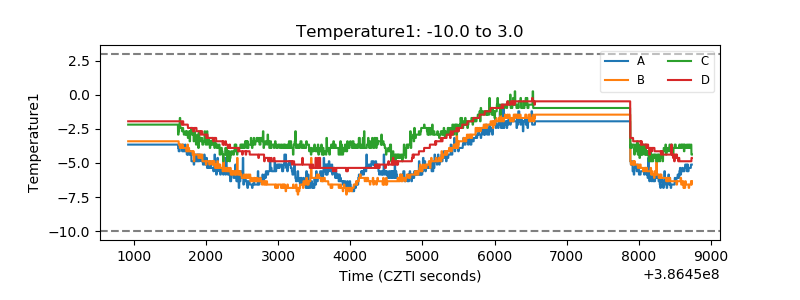 |
| Veto HV Monitor |  |
| Veto LLD | 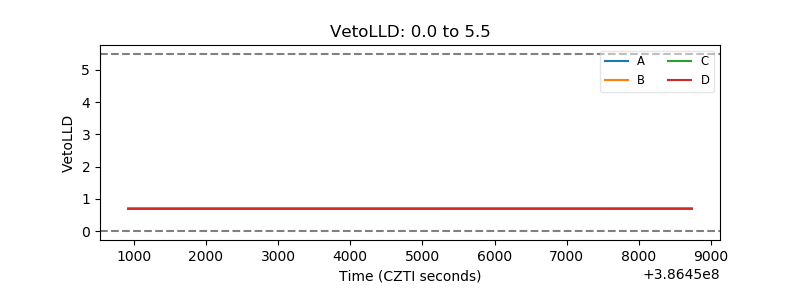 |
| Alpha Counter | 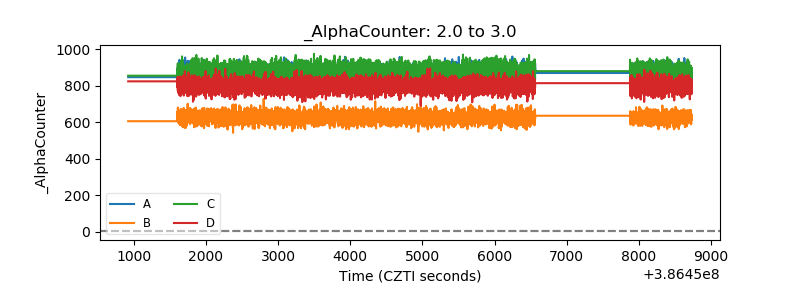 |
| _CPM_Rate | 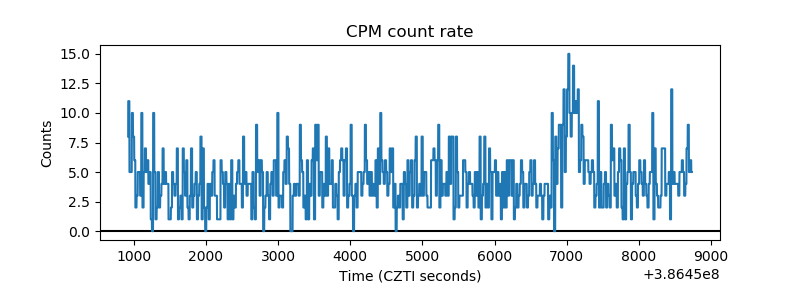 |
| CZT Counter | 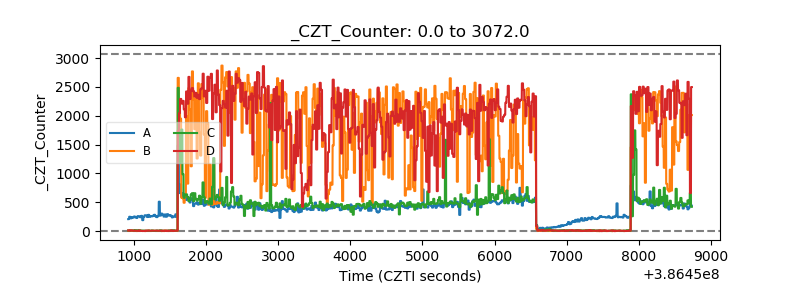 |
| +2.5 Volts monitor | 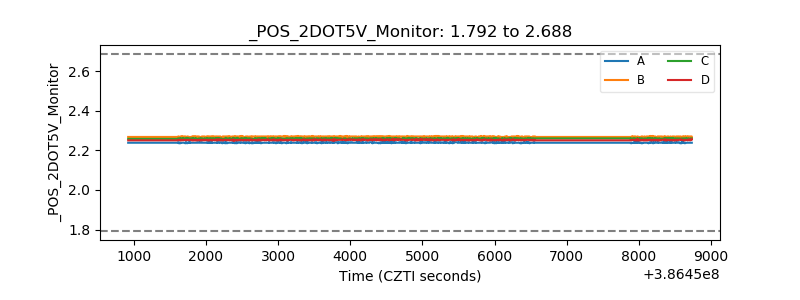 |
| +5 Volts monitor | 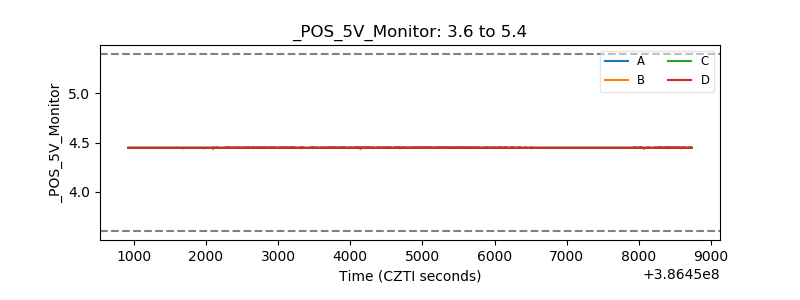 |
| _ROLL_ROT | 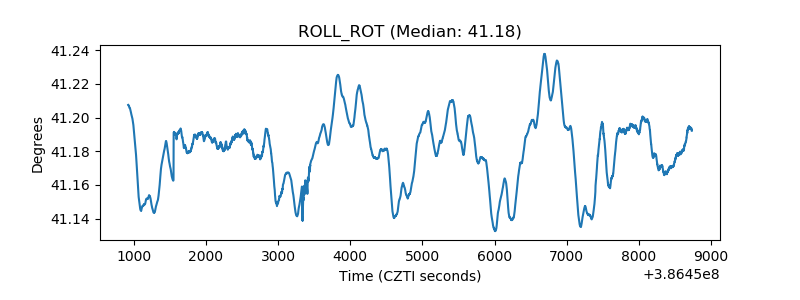 |
| _Roll_DEC | 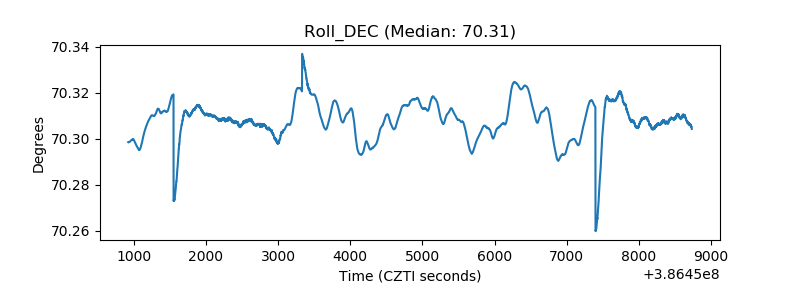 |
| _Roll_RA | 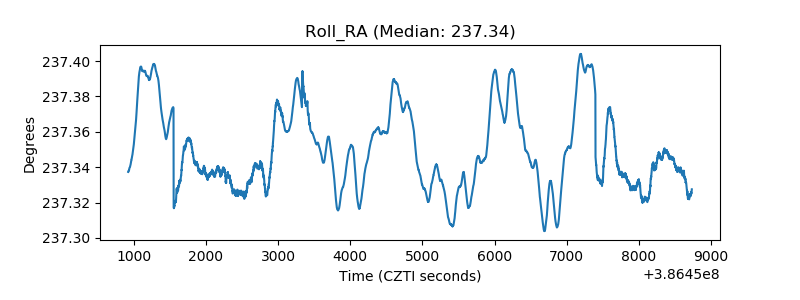 |
| Veto Counter | 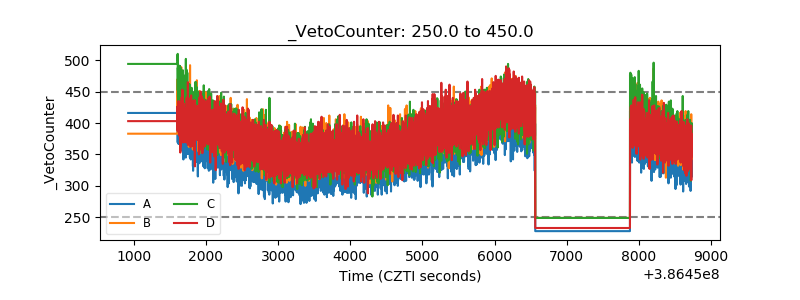 |