| Param | Original file | Final file |
|---|---|---|
| Filename | modeM0/AS1C07_001T06_9000005046_35178cztM0_level2.evt | modeM0/AS1C07_001T06_9000005046_35178cztM0_level2_quad_clean.evt |
| Size (bytes) | 692,026,560 | 90,789,120 |
| Size | 660.0 MB | 86.6 MB |
| Events in quadrant A | 2,369,756 | 655,741 |
| Events in quadrant B | 8,420,277 | 504,464 |
| Events in quadrant C | 2,623,319 | 664,223 |
| Events in quadrant D | 7,203,220 | 568,743 |
| Mode SS | |||
|---|---|---|---|
| Quadrant | BADHDUFLAG | Total packets | Discarded packets |
| A | 0 | 102 | 0 |
| B | 0 | 102 | 0 |
| C | 0 | 102 | 0 |
| D | 0 | 102 | 0 |
| Mode M0 | |||
|---|---|---|---|
| Quadrant | BADHDUFLAG | Total packets | Discarded packets |
| A | 0 | 10451 | 2 |
| B | 0 | 28510 | 1 |
| C | 0 | 10770 | 1 |
| D | 0 | 24941 | 1 |
| Mode M9 | |||
|---|---|---|---|
| Quadrant | BADHDUFLAG | Total packets | Discarded packets |
| A | 0 | 19 | 0 |
| B | 0 | 19 | 0 |
| C | 0 | 19 | 0 |
| D | 0 | 19 | 0 |
| Quadrant | Total seconds | Saturated seconds | Saturation percentage |
|---|---|---|---|
| A | 5065 | 19 | 0.375123% |
| B | 5065 | 2390 | 47.186575% |
| C | 5065 | 54 | 1.066140% |
| D | 5065 | 1150 | 22.704837% |
Noise dominated data is calculated using 1-second bins in cleaned event files. If a bin has >2000 counts, and if more than 50% of those come from <1% of pixels, then it is considered to be noise-dominated and hence unusable.
| Quadrant | # 1 sec bins | Bins with >0 counts | Bins with >2000 counts | High rate bins dominated by noise | Noise dominated (total time) | Noise dominated (detector-on time) | Marked lightcurve |
|---|---|---|---|---|---|---|---|
| A | 6889 | 5066 | 13 | 13 | 0.19% | 0.26% | 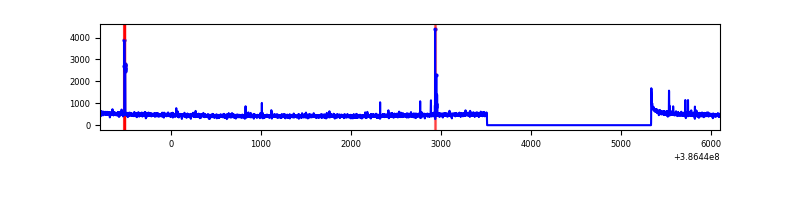 |
| B | 6889 | 5065 | 1757 | 1757 | 25.50% | 34.69% | 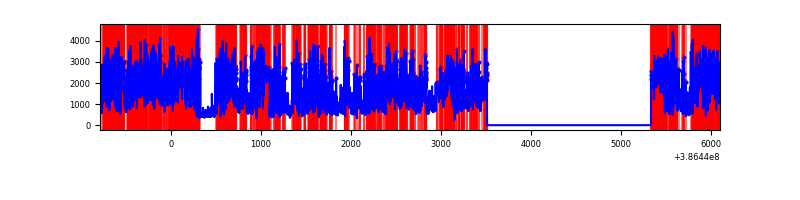 |
| C | 6889 | 5066 | 42 | 42 | 0.61% | 0.83% | 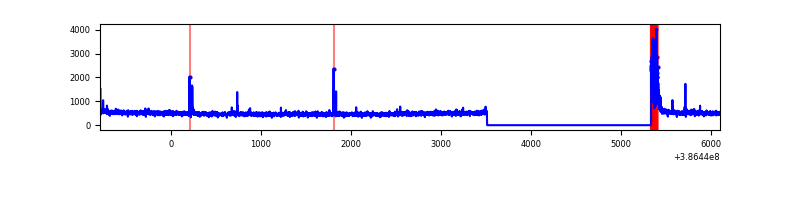 |
| D | 6889 | 5066 | 1043 | 1043 | 15.14% | 20.59% | 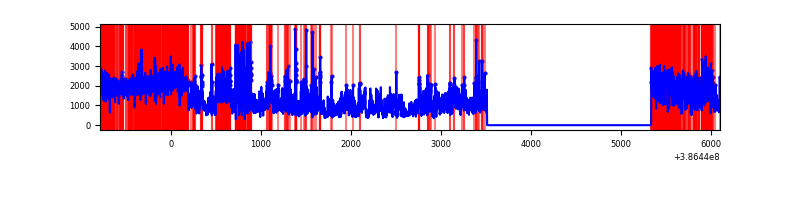 |
Top three noisy pixels from each quadrant. If the there are fewer than three noisy pixels in the level2.evt file, extra rows are filled as -1
| Pixel properties | Quadrant properties | ||||||
|---|---|---|---|---|---|---|---|
| Quadrant | DetID | PixID | Counts | Sigma | Mean | Median | Sigma |
| A | 10 | 83 | 77141 | 664.44 | 571 | 561 | 115.3 |
| A | 15 | 169 | 31104 | 265.0 | 571 | 561 | 115.3 |
| A | 9 | 143 | 20507 | 173.06 | 571 | 561 | 115.3 |
| B | 5 | 236 | 5801113 | 66821.58 | 458 | 447 | 86.8 |
| B | 5 | 172 | 678434 | 7810.17 | 458 | 447 | 86.8 |
| B | 3 | 112 | 70184 | 803.35 | 458 | 447 | 86.8 |
| C | 15 | 214 | 210089 | 1602.33 | 566 | 569 | 130.8 |
| C | 0 | 10 | 169473 | 1291.72 | 566 | 569 | 130.8 |
| C | 0 | 207 | 24484 | 182.89 | 566 | 569 | 130.8 |
| D | 8 | 195 | 3085334 | 23878.64 | 528 | 514 | 129.2 |
| D | 10 | 203 | 763026 | 5902.37 | 528 | 514 | 129.2 |
| D | 1 | 47 | 627551 | 4853.7 | 528 | 514 | 129.2 |
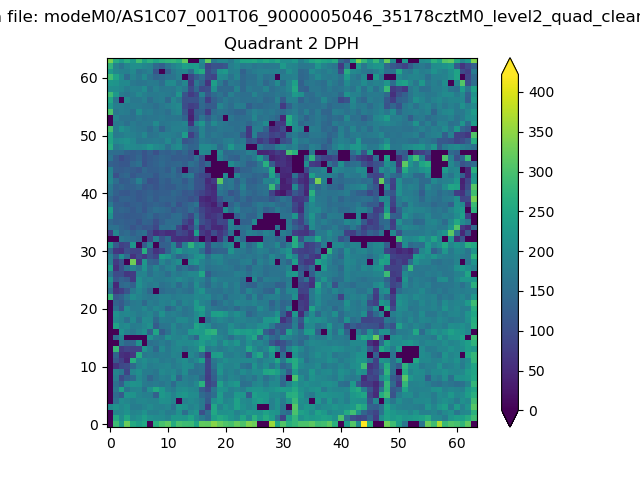
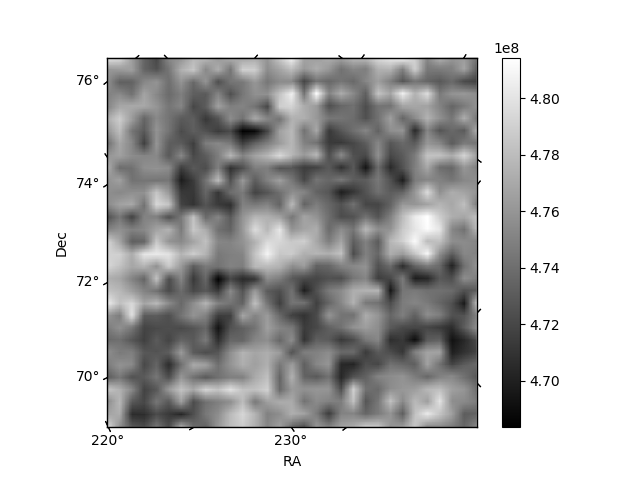
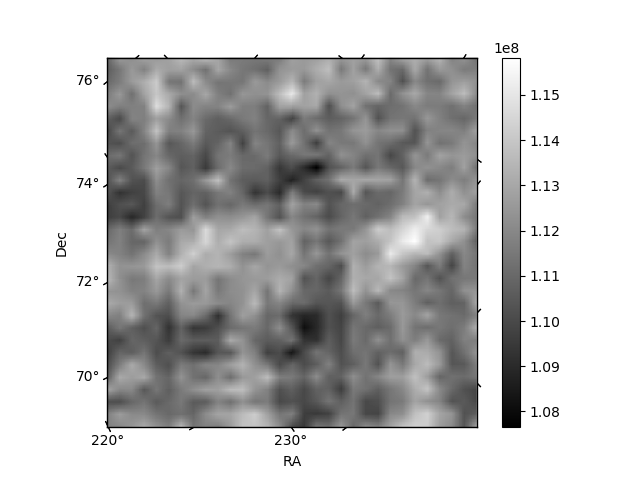
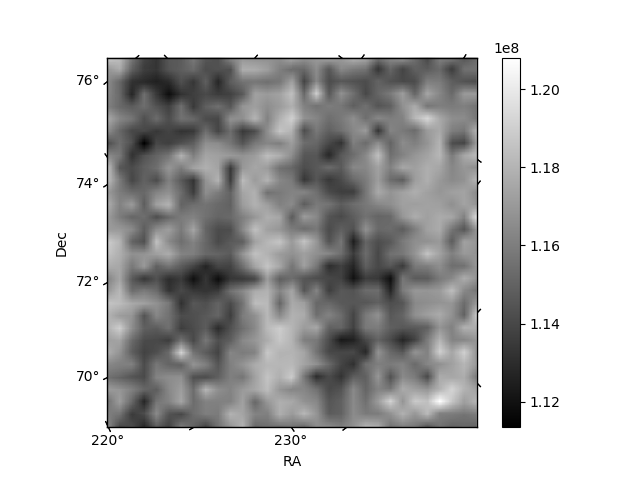
Histogram calculated using DETX and DETY for each event in the final _common_clean file
| Quadrant A | 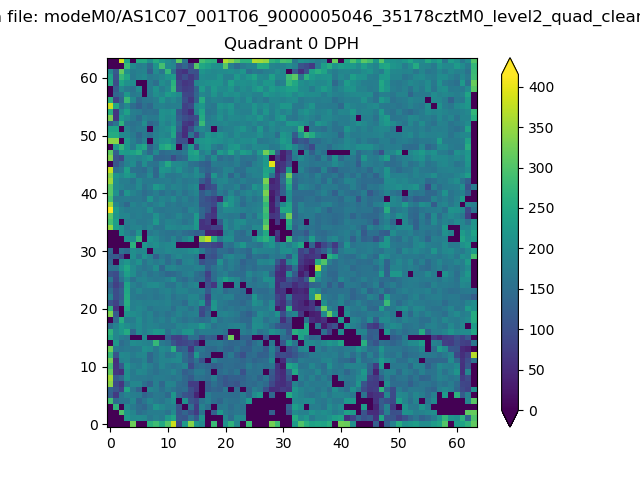 |
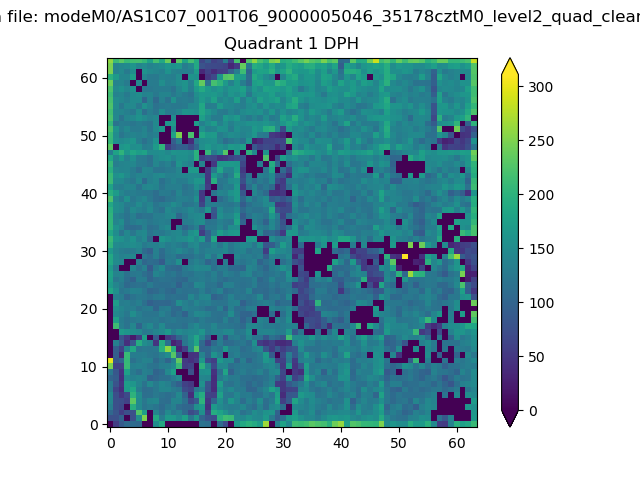 |
Quadrant B |
|---|---|---|---|
| Quadrant D | 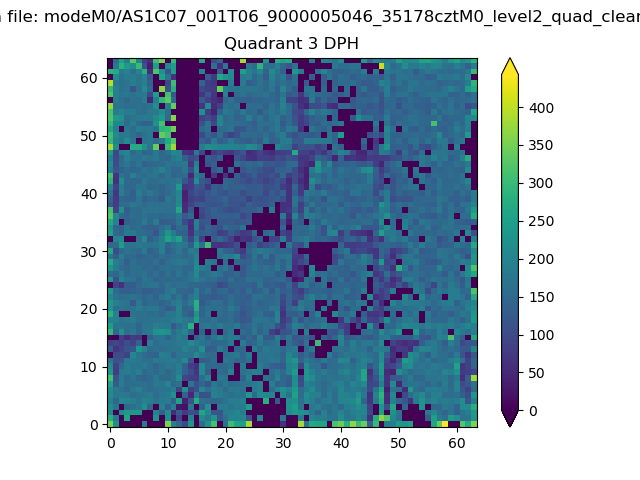 |
 |
Quadrant C |
| Plot type | Count rate plots | Images |
|---|---|---|
| Comparison with Poisson distribution Blue bars denote a histogram of data divided into 1 sec bins. Red curve is a Poisson curve with rate = median count rate of data. |
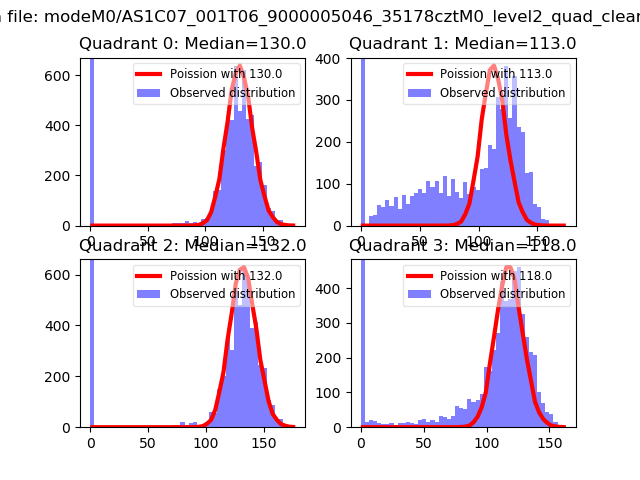 |
 |
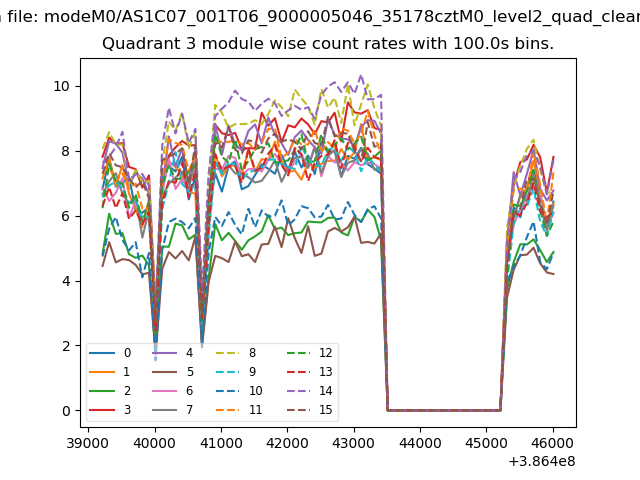
| Quadrant-wise count rates Data is divided into 100 sec bins |
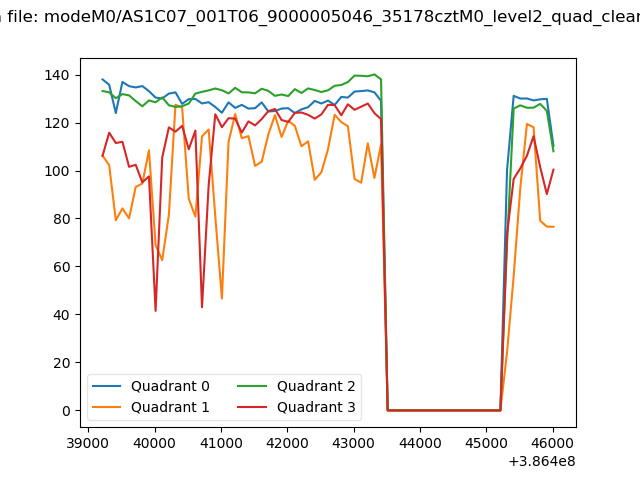 |
|
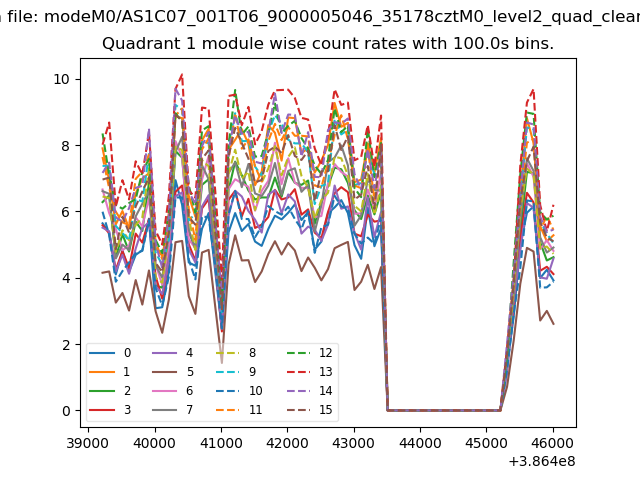
| Module-wise count rates for Quadrant A Data is divided into 100 sec bins |
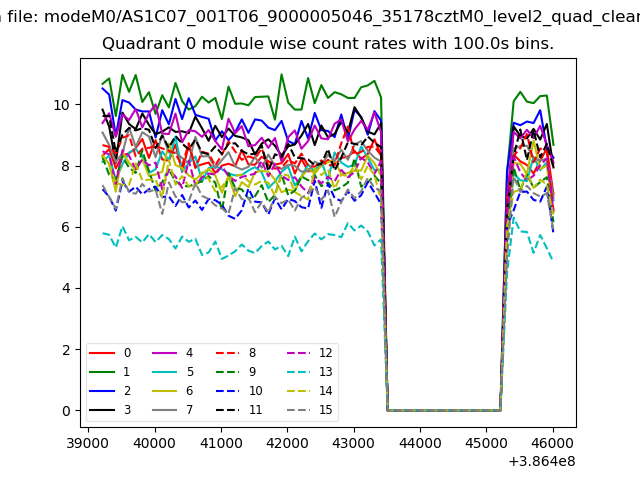 |
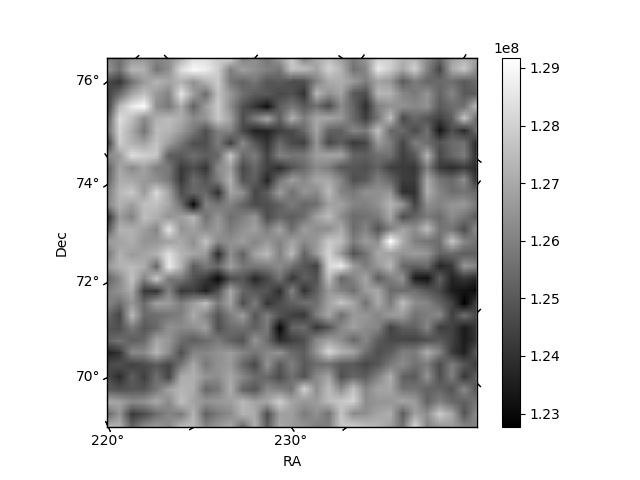 |
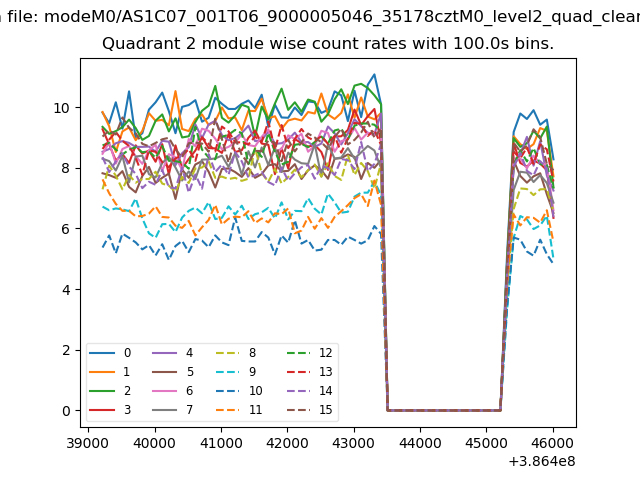
| Module-wise count rates for Quadrant B Data is divided into 100 sec bins |
 |
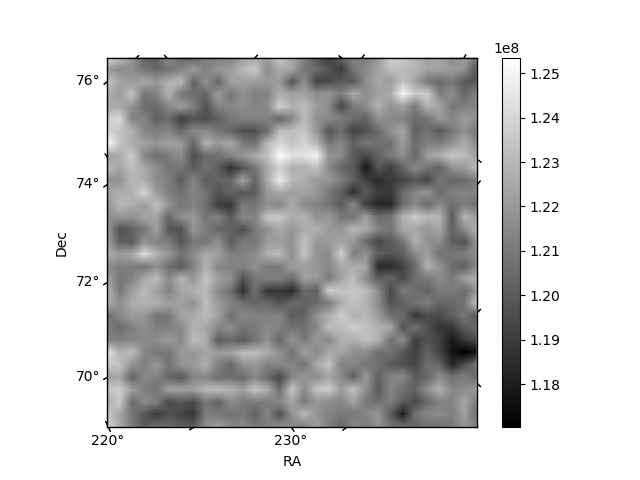 |
| Module-wise count rates for Quadrant C Data is divided into 100 sec bins |
 |
 |
| Module-wise count rates for Quadrant D Data is divided into 100 sec bins |
 |
 |
| Parameter | Plot |
|---|---|
| CZT HV Monitor | 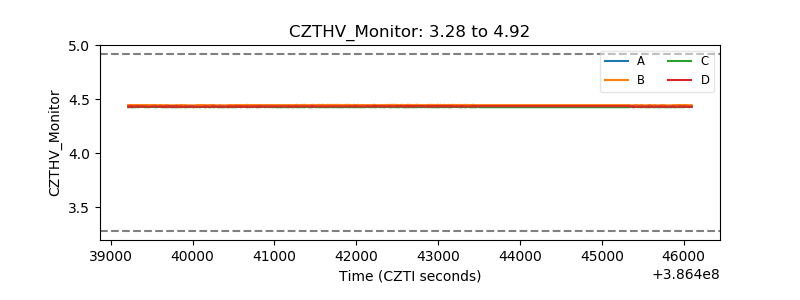 |
| D_VDD | 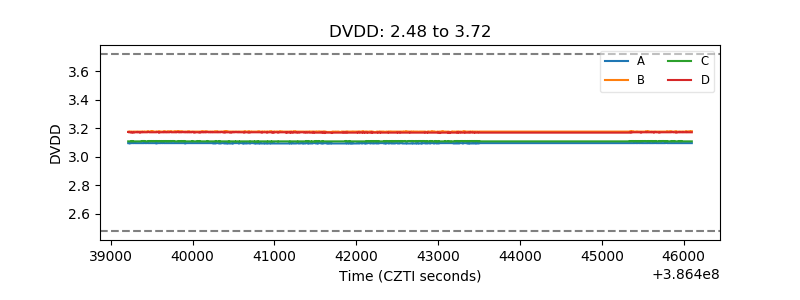 |
| Temperature 1 | 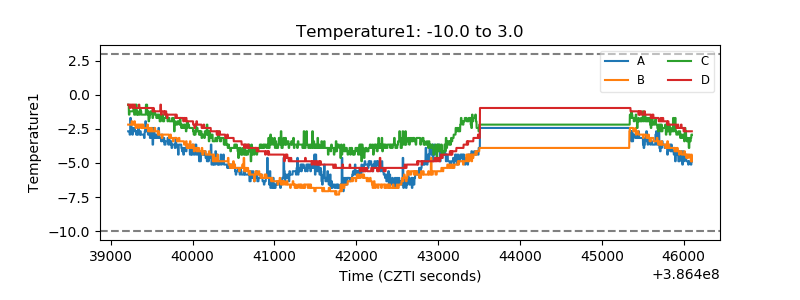 |
| Veto HV Monitor | 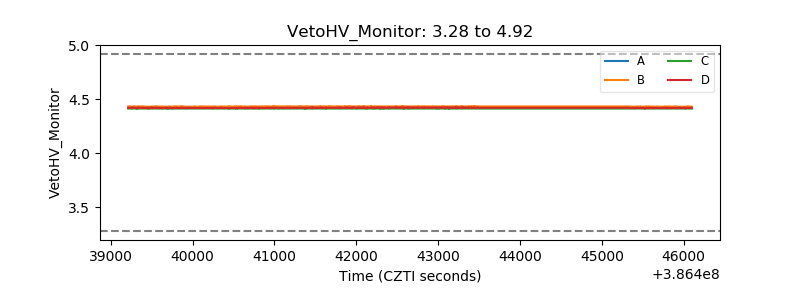 |
| Veto LLD | 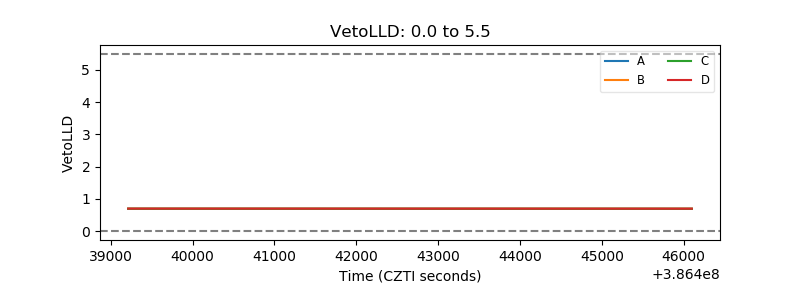 |
| Alpha Counter | 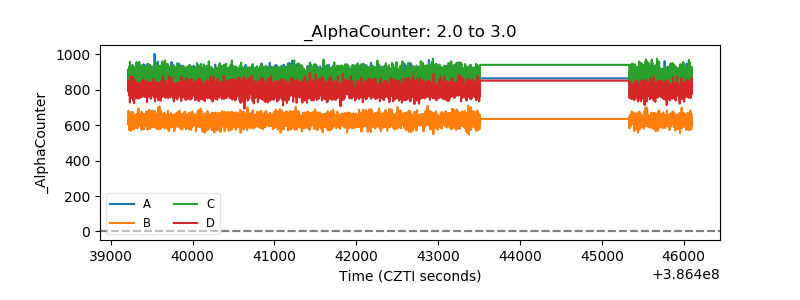 |
| _CPM_Rate | 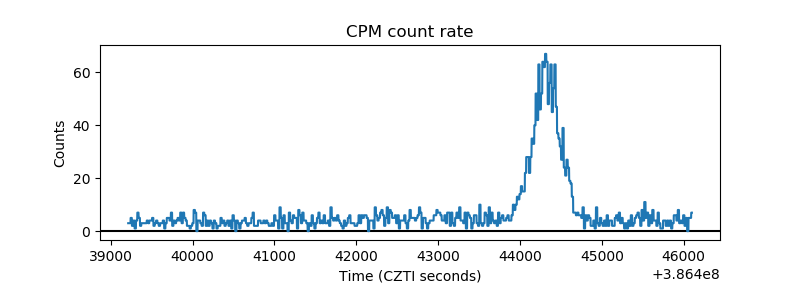 |
| CZT Counter | 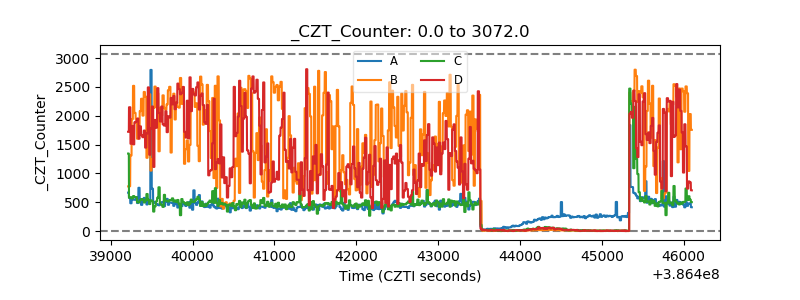 |
| +2.5 Volts monitor | 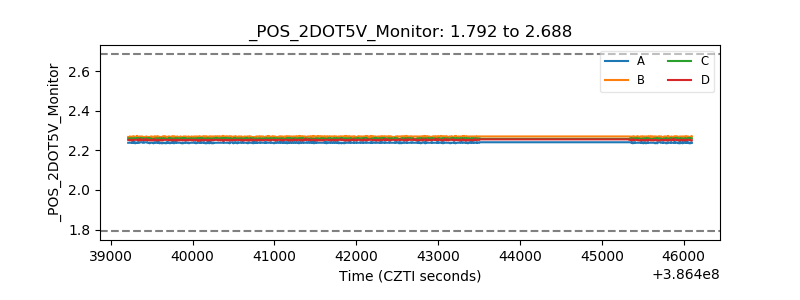 |
| +5 Volts monitor | 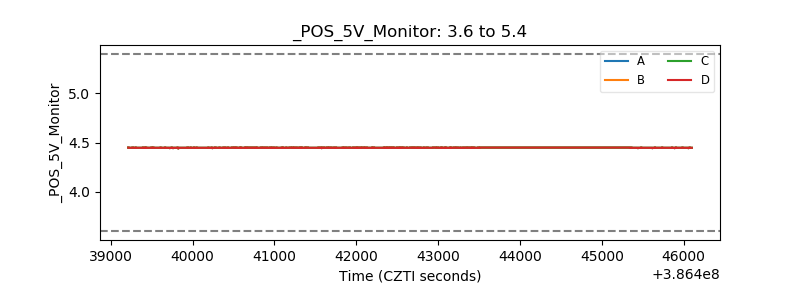 |
| _ROLL_ROT | 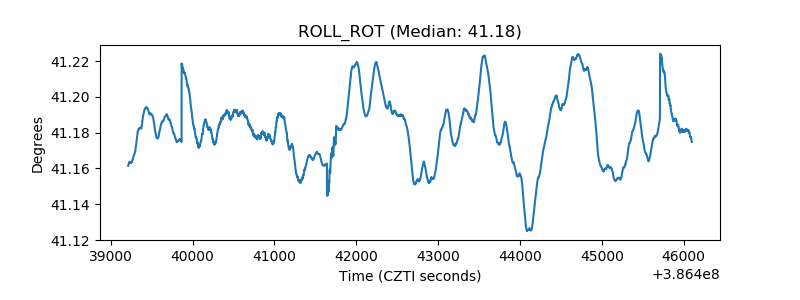 |
| _Roll_DEC | 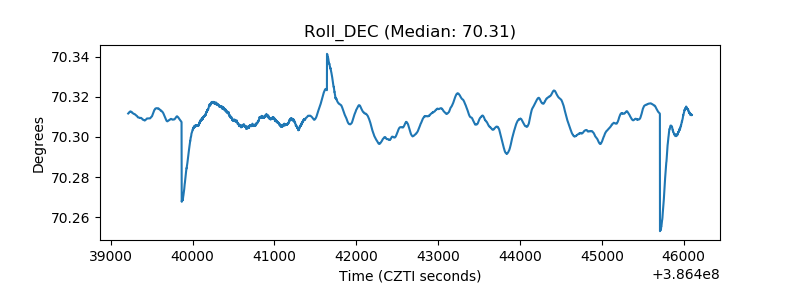 |
| _Roll_RA | 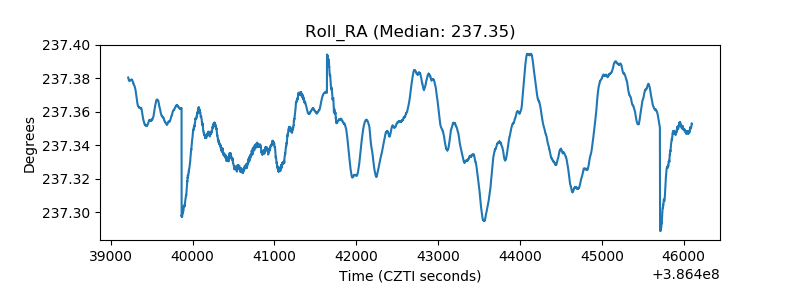 |
| Veto Counter | 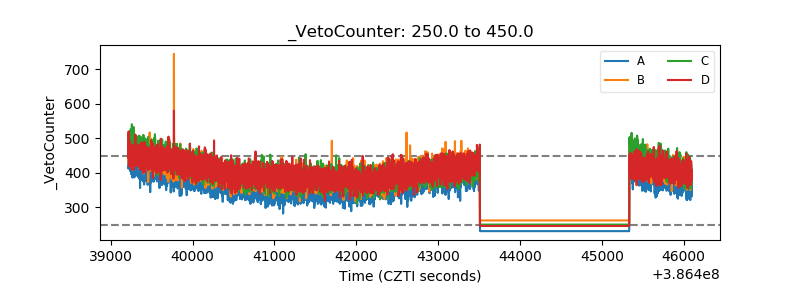 |