| Param | Original file | Final file |
|---|---|---|
| Filename | modeM0/AS1C07_001T06_9000005046_35177cztM0_level2.evt | modeM0/AS1C07_001T06_9000005046_35177cztM0_level2_quad_clean.evt |
| Size (bytes) | 773,084,160 | 93,772,800 |
| Size | 737.3 MB | 89.4 MB |
| Events in quadrant A | 2,509,531 | 696,050 |
| Events in quadrant B | 9,206,370 | 518,812 |
| Events in quadrant C | 2,779,208 | 691,379 |
| Events in quadrant D | 8,578,487 | 578,577 |
| Mode SS | |||
|---|---|---|---|
| Quadrant | BADHDUFLAG | Total packets | Discarded packets |
| A | 0 | 102 | 0 |
| B | 0 | 102 | 0 |
| C | 0 | 102 | 0 |
| D | 0 | 102 | 0 |
| Mode M0 | |||
|---|---|---|---|
| Quadrant | BADHDUFLAG | Total packets | Discarded packets |
| A | 0 | 10672 | 3 |
| B | 0 | 30840 | 2 |
| C | 0 | 11045 | 2 |
| D | 0 | 29019 | 2 |
| Mode M9 | |||
|---|---|---|---|
| Quadrant | BADHDUFLAG | Total packets | Discarded packets |
| A | 0 | 21 | 0 |
| B | 0 | 21 | 0 |
| C | 0 | 21 | 0 |
| D | 0 | 21 | 0 |
| Quadrant | Total seconds | Saturated seconds | Saturation percentage |
|---|---|---|---|
| A | 5037 | 32 | 0.635299% |
| B | 5037 | 2789 | 55.370260% |
| C | 5037 | 85 | 1.687512% |
| D | 5037 | 1772 | 35.179670% |
Noise dominated data is calculated using 1-second bins in cleaned event files. If a bin has >2000 counts, and if more than 50% of those come from <1% of pixels, then it is considered to be noise-dominated and hence unusable.
| Quadrant | # 1 sec bins | Bins with >0 counts | Bins with >2000 counts | High rate bins dominated by noise | Noise dominated (total time) | Noise dominated (detector-on time) | Marked lightcurve |
|---|---|---|---|---|---|---|---|
| A | 7130 | 5038 | 20 | 20 | 0.28% | 0.40% | 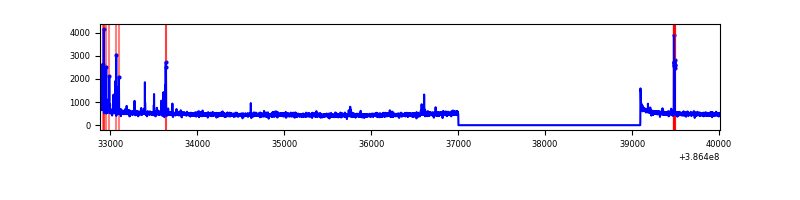 |
| B | 7130 | 5037 | 1987 | 1987 | 27.87% | 39.45% | 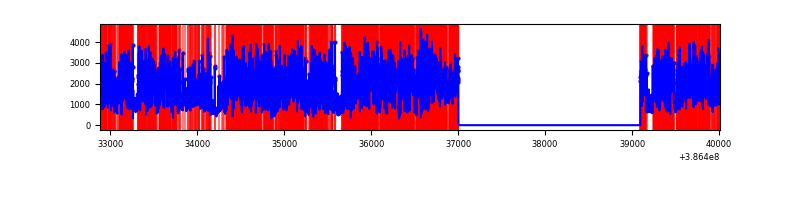 |
| C | 7130 | 5038 | 60 | 60 | 0.84% | 1.19% | 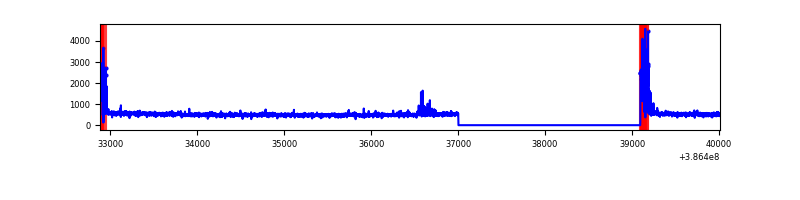 |
| D | 7130 | 5038 | 1823 | 1823 | 25.57% | 36.18% | 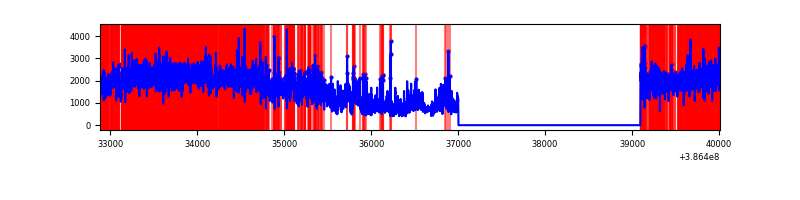 |
Top three noisy pixels from each quadrant. If the there are fewer than three noisy pixels in the level2.evt file, extra rows are filled as -1
| Pixel properties | Quadrant properties | ||||||
|---|---|---|---|---|---|---|---|
| Quadrant | DetID | PixID | Counts | Sigma | Mean | Median | Sigma |
| A | 9 | 143 | 84514 | 703.37 | 594 | 583 | 119.3 |
| A | 10 | 83 | 84105 | 699.94 | 594 | 583 | 119.3 |
| A | 15 | 169 | 30828 | 253.46 | 594 | 583 | 119.3 |
| B | 5 | 236 | 7141051 | 82149.2 | 466 | 455 | 86.9 |
| B | 5 | 172 | 124368 | 1425.56 | 466 | 455 | 86.9 |
| B | 4 | 232 | 43710 | 497.63 | 466 | 455 | 86.9 |
| C | 0 | 10 | 246842 | 1857.0 | 583 | 588 | 132.6 |
| C | 15 | 214 | 210572 | 1583.49 | 583 | 588 | 132.6 |
| C | 0 | 207 | 32004 | 236.91 | 583 | 588 | 132.6 |
| D | 8 | 195 | 3039896 | 22973.53 | 543 | 528 | 132.3 |
| D | 10 | 203 | 2567509 | 19402.92 | 543 | 528 | 132.3 |
| D | 10 | 118 | 282569 | 2131.85 | 543 | 528 | 132.3 |
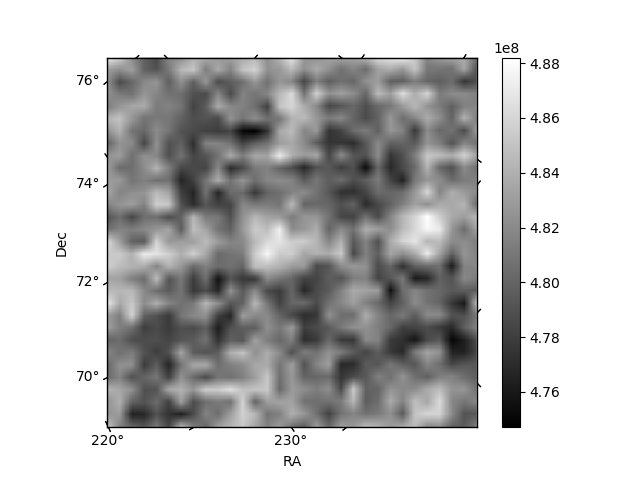
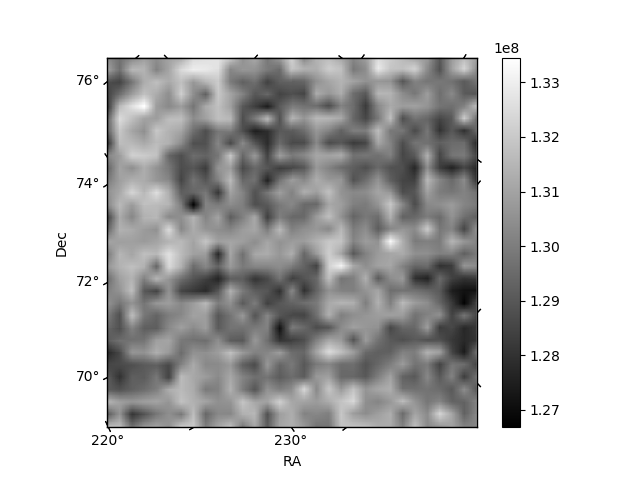
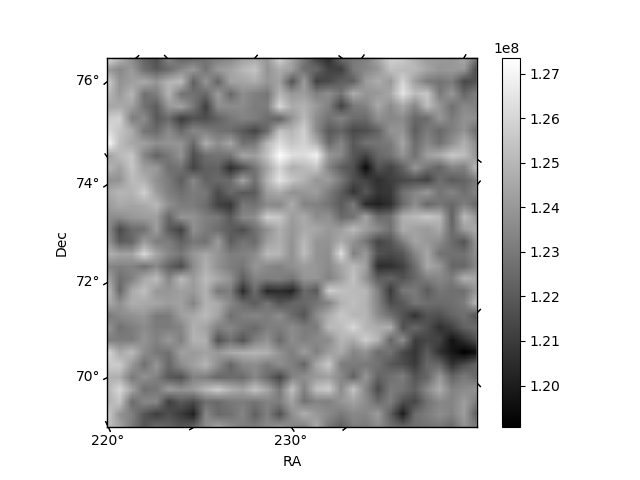
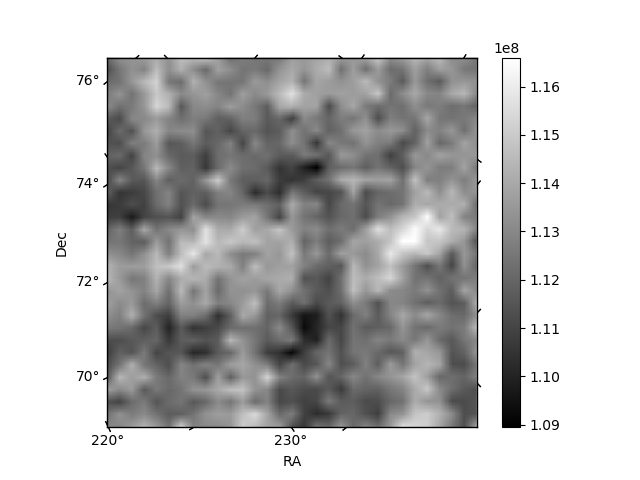
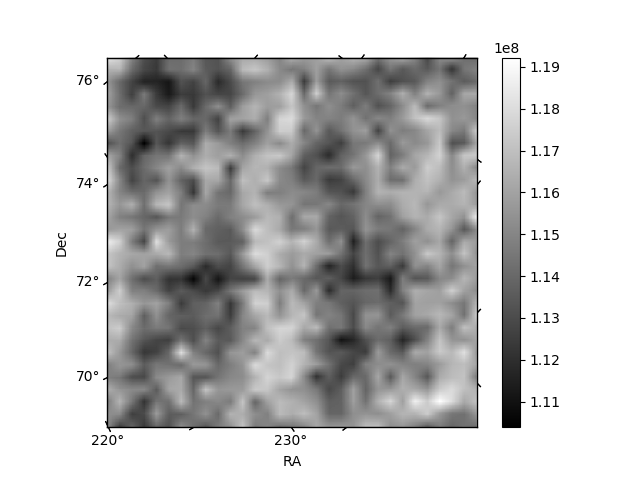
Histogram calculated using DETX and DETY for each event in the final _common_clean file
| Quadrant A | 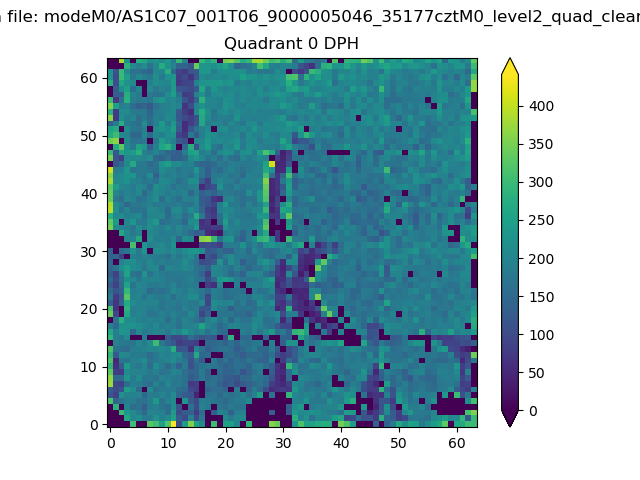 |
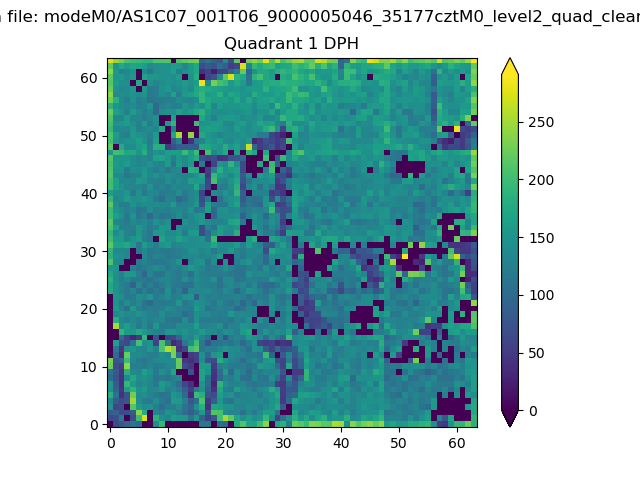 |
Quadrant B |
|---|---|---|---|
| Quadrant D | 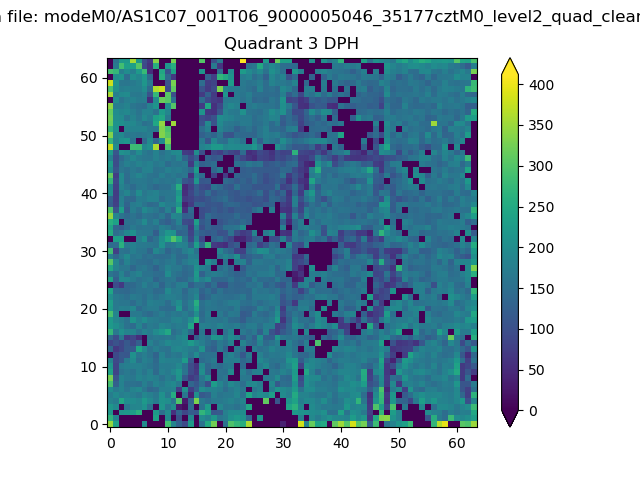 |
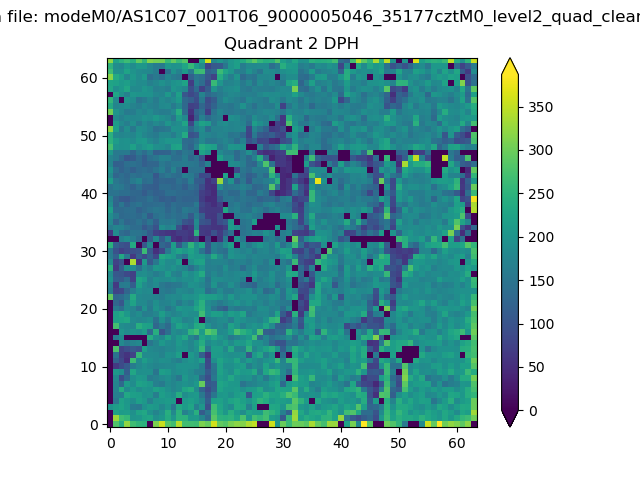 |
Quadrant C |
| Plot type | Count rate plots | Images |
|---|---|---|
| Comparison with Poisson distribution Blue bars denote a histogram of data divided into 1 sec bins. Red curve is a Poisson curve with rate = median count rate of data. |
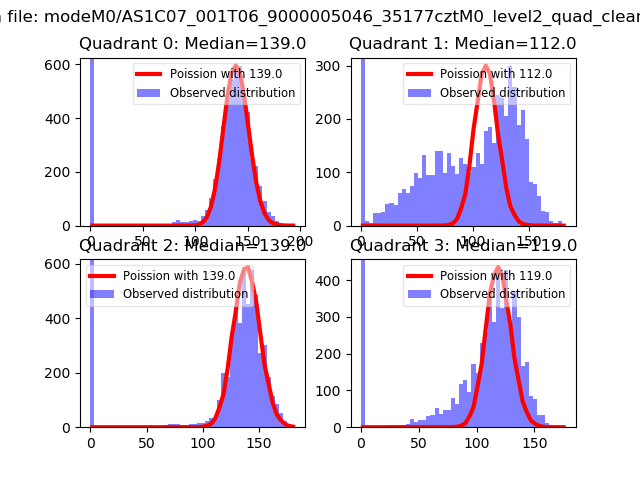 |
 |
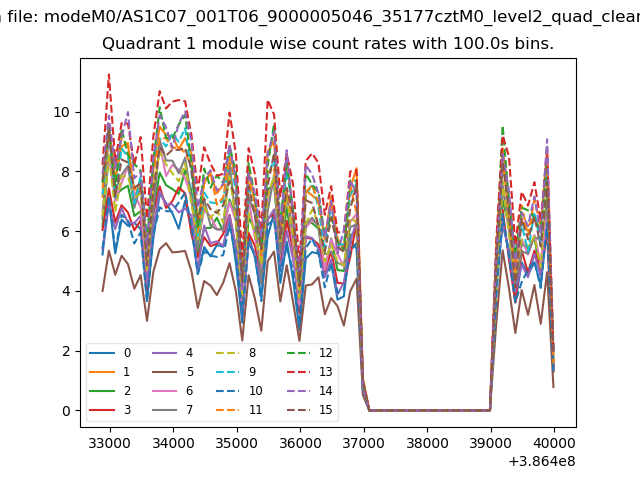
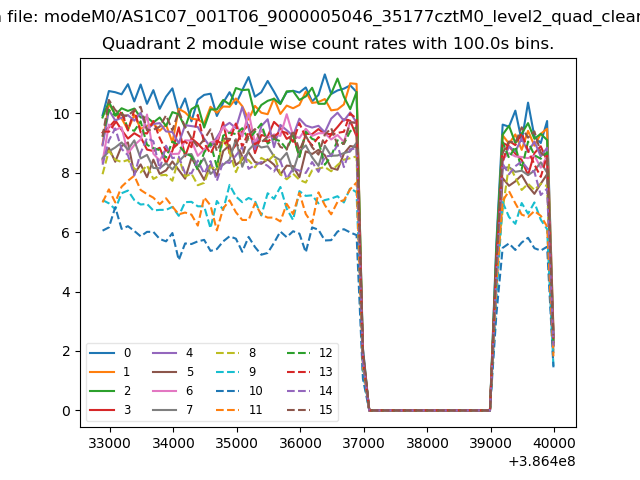
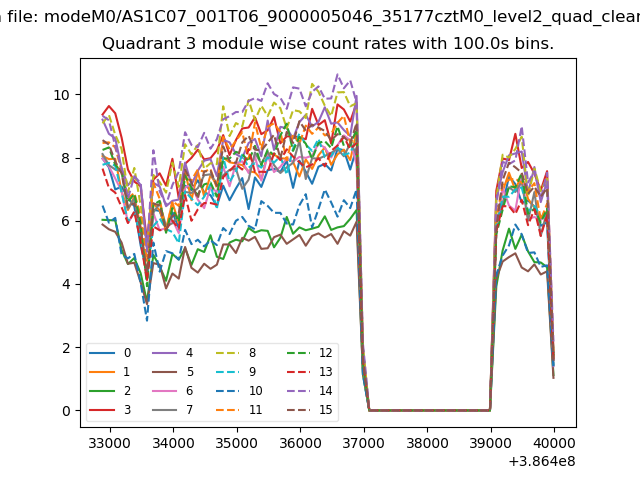
| Quadrant-wise count rates Data is divided into 100 sec bins |
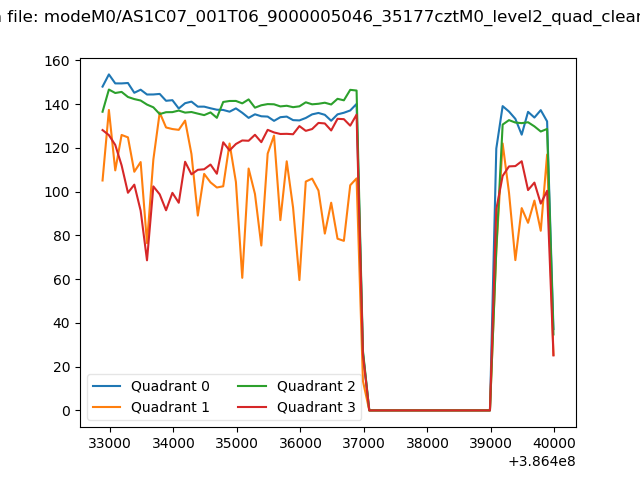 |
|
| Module-wise count rates for Quadrant A Data is divided into 100 sec bins |
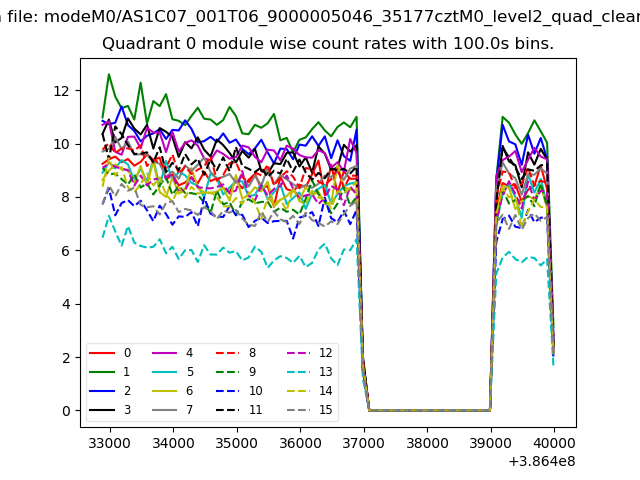 |
 |
| Module-wise count rates for Quadrant B Data is divided into 100 sec bins |
 |
 |
| Module-wise count rates for Quadrant C Data is divided into 100 sec bins |
 |
 |
| Module-wise count rates for Quadrant D Data is divided into 100 sec bins |
 |
 |
| Parameter | Plot |
|---|---|
| CZT HV Monitor | 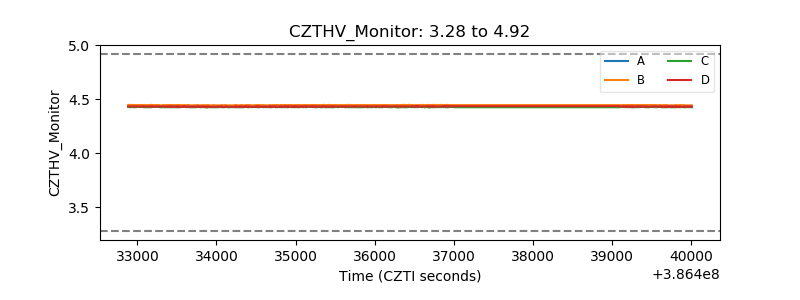 |
| D_VDD | 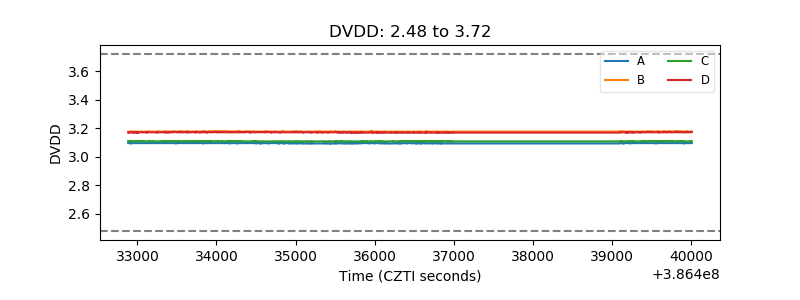 |
| Temperature 1 | 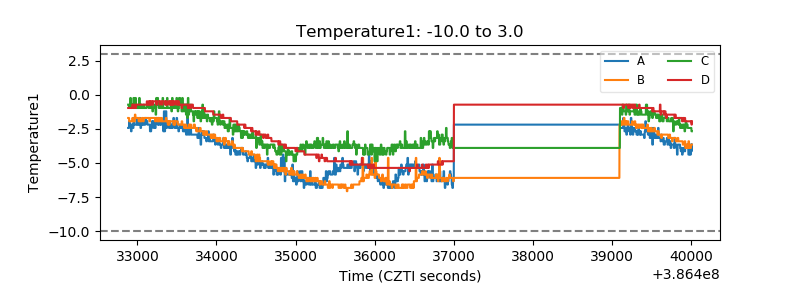 |
| Veto HV Monitor | 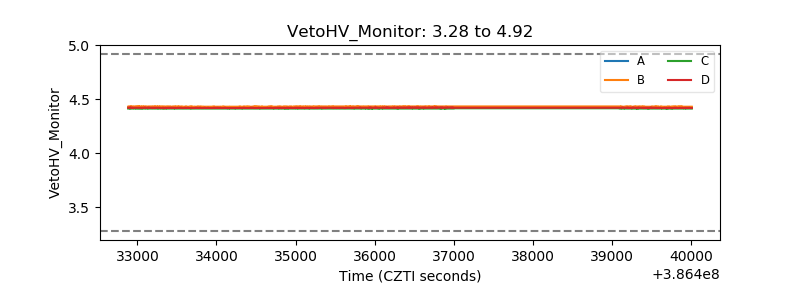 |
| Veto LLD | 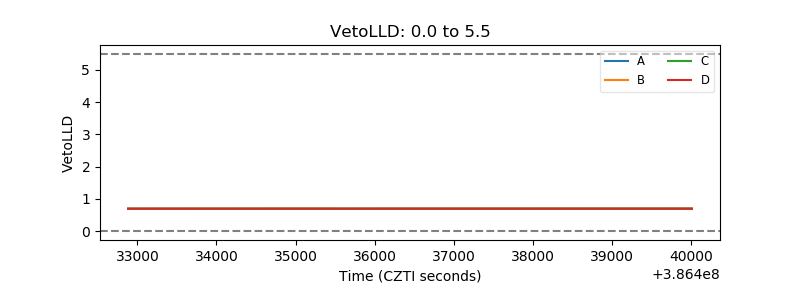 |
| Alpha Counter | 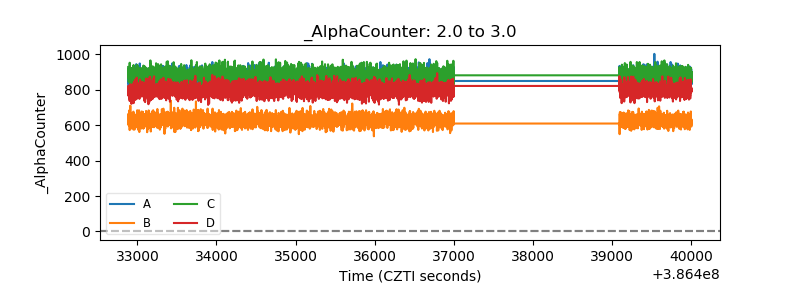 |
| _CPM_Rate |  |
| CZT Counter | 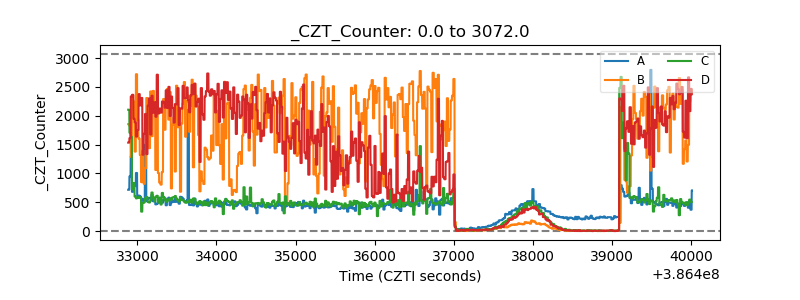 |
| +2.5 Volts monitor | 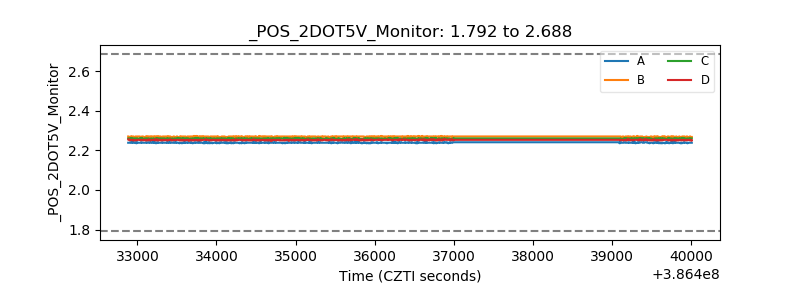 |
| +5 Volts monitor | 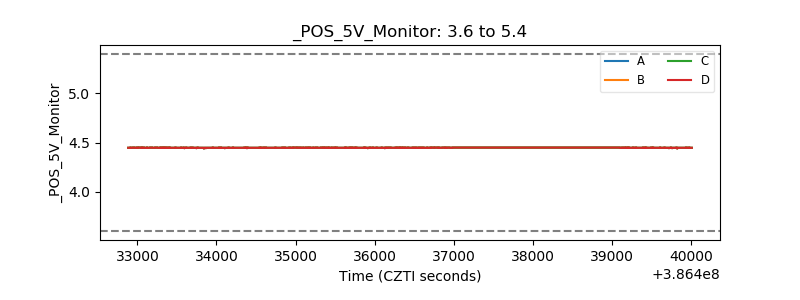 |
| _ROLL_ROT | 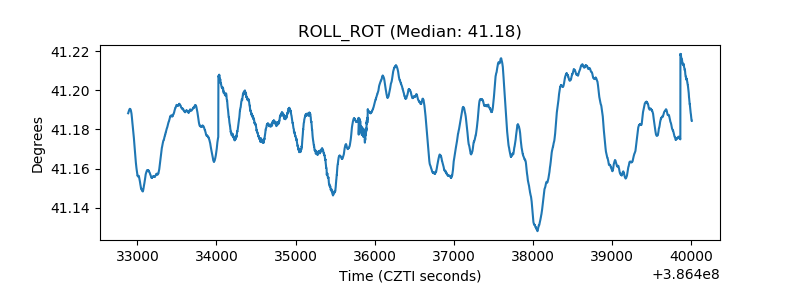 |
| _Roll_DEC | 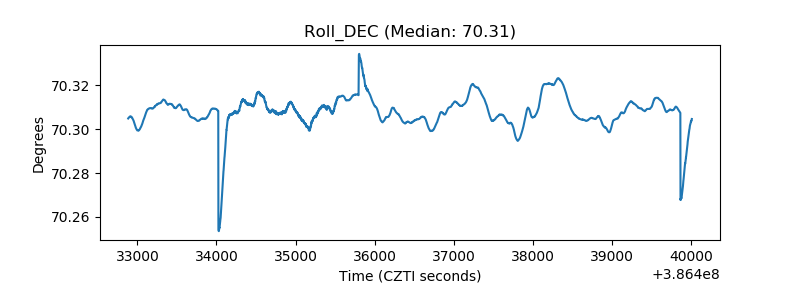 |
| _Roll_RA | 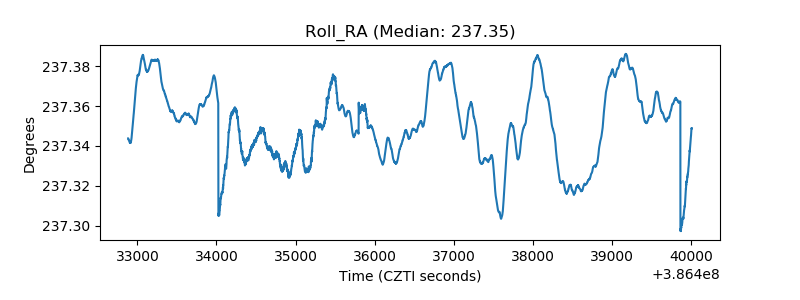 |
| Veto Counter | 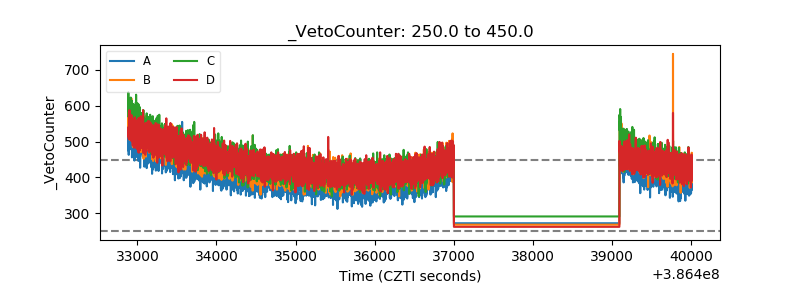 |