| Param | Original file | Final file |
|---|---|---|
| Filename | modeM0/AS1C07_001T06_9000005046_35175cztM0_level2.evt | modeM0/AS1C07_001T06_9000005046_35175cztM0_level2_quad_clean.evt |
| Size (bytes) | 812,177,280 | 102,997,440 |
| Size | 774.6 MB | 98.2 MB |
| Events in quadrant A | 2,694,357 | 789,460 |
| Events in quadrant B | 8,706,103 | 614,762 |
| Events in quadrant C | 3,128,507 | 765,686 |
| Events in quadrant D | 9,721,805 | 586,941 |
| Mode SS | |||
|---|---|---|---|
| Quadrant | BADHDUFLAG | Total packets | Discarded packets |
| A | 0 | 106 | 0 |
| B | 0 | 106 | 0 |
| C | 0 | 106 | 0 |
| D | 0 | 106 | 0 |
| Mode M0 | |||
|---|---|---|---|
| Quadrant | BADHDUFLAG | Total packets | Discarded packets |
| A | 0 | 11054 | 3 |
| B | 0 | 29463 | 2 |
| C | 0 | 12241 | 2 |
| D | 0 | 32434 | 2 |
| Mode M9 | |||
|---|---|---|---|
| Quadrant | BADHDUFLAG | Total packets | Discarded packets |
| A | 0 | 21 | 0 |
| B | 0 | 21 | 0 |
| C | 0 | 21 | 0 |
| D | 0 | 21 | 0 |
| Quadrant | Total seconds | Saturated seconds | Saturation percentage |
|---|---|---|---|
| A | 5137 | 14 | 0.272533% |
| B | 5137 | 2416 | 47.031341% |
| C | 5137 | 88 | 1.713062% |
| D | 5137 | 2558 | 49.795601% |
Noise dominated data is calculated using 1-second bins in cleaned event files. If a bin has >2000 counts, and if more than 50% of those come from <1% of pixels, then it is considered to be noise-dominated and hence unusable.
| Quadrant | # 1 sec bins | Bins with >0 counts | Bins with >2000 counts | High rate bins dominated by noise | Noise dominated (total time) | Noise dominated (detector-on time) | Marked lightcurve |
|---|---|---|---|---|---|---|---|
| A | 7259 | 5138 | 3 | 3 | 0.04% | 0.06% | 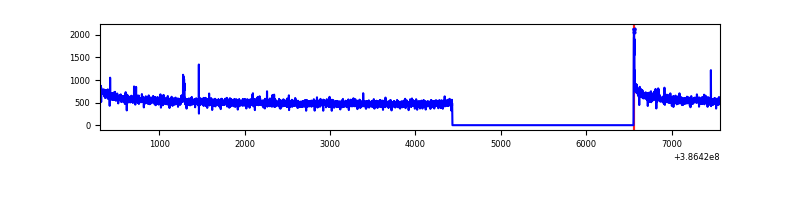 |
| B | 7259 | 5138 | 1747 | 1747 | 24.07% | 34.00% | 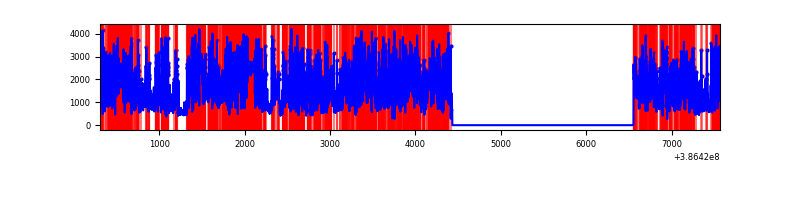 |
| C | 7259 | 5138 | 74 | 74 | 1.02% | 1.44% | 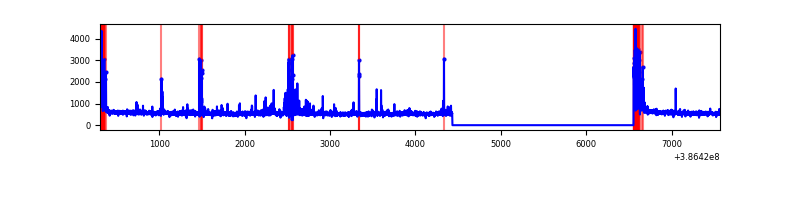 |
| D | 7259 | 5138 | 2642 | 2642 | 36.40% | 51.42% | 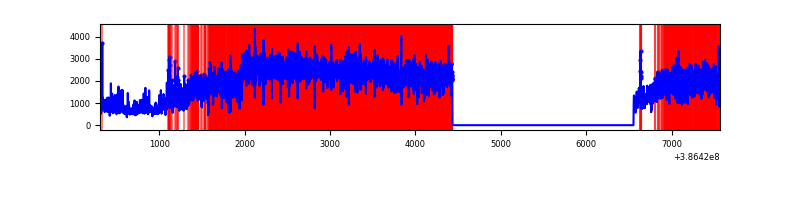 |
Top three noisy pixels from each quadrant. If the there are fewer than three noisy pixels in the level2.evt file, extra rows are filled as -1
| Pixel properties | Quadrant properties | ||||||
|---|---|---|---|---|---|---|---|
| Quadrant | DetID | PixID | Counts | Sigma | Mean | Median | Sigma |
| A | 10 | 83 | 89152 | 677.64 | 663 | 653 | 130.6 |
| A | 15 | 169 | 23838 | 177.53 | 663 | 653 | 130.6 |
| A | 13 | 6 | 10582 | 76.03 | 663 | 653 | 130.6 |
| B | 5 | 236 | 6298757 | 63552.1 | 535 | 522 | 99.1 |
| B | 5 | 172 | 179991 | 1810.92 | 535 | 522 | 99.1 |
| B | 0 | 182 | 48057 | 479.65 | 535 | 522 | 99.1 |
| C | 0 | 10 | 223110 | 1540.04 | 636 | 643 | 144.5 |
| C | 15 | 214 | 214641 | 1481.41 | 636 | 643 | 144.5 |
| C | 0 | 207 | 144358 | 994.88 | 636 | 643 | 144.5 |
| D | 10 | 203 | 3611284 | 26875.42 | 553 | 539 | 134.4 |
| D | 8 | 195 | 3470909 | 25830.58 | 553 | 539 | 134.4 |
| D | 2 | 249 | 90655 | 670.75 | 553 | 539 | 134.4 |
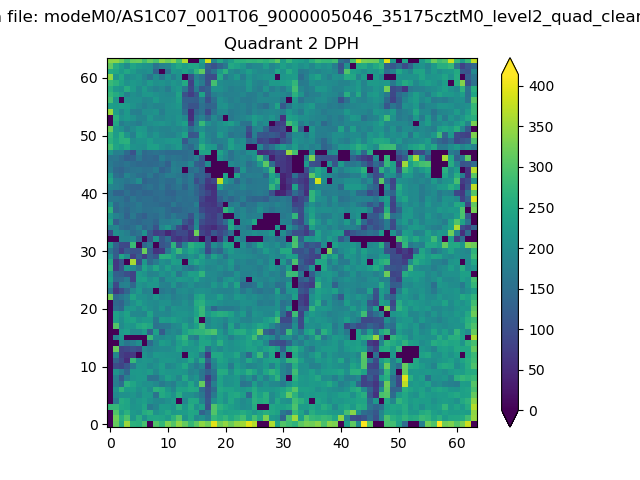
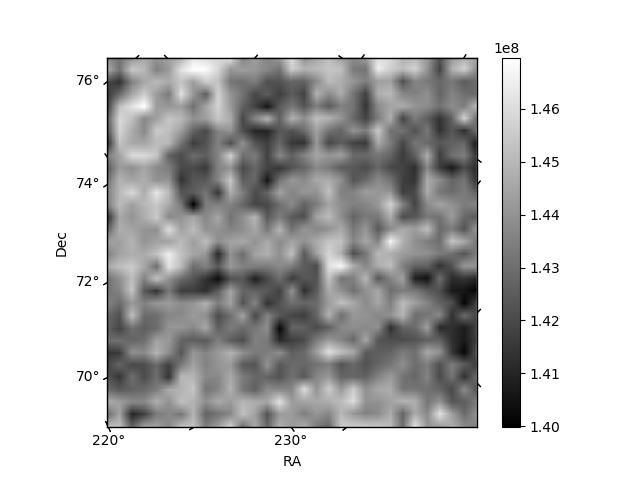
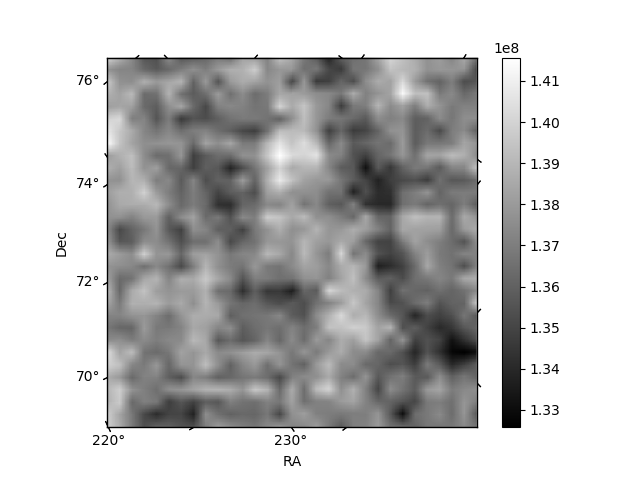
Histogram calculated using DETX and DETY for each event in the final _common_clean file
| Quadrant A | 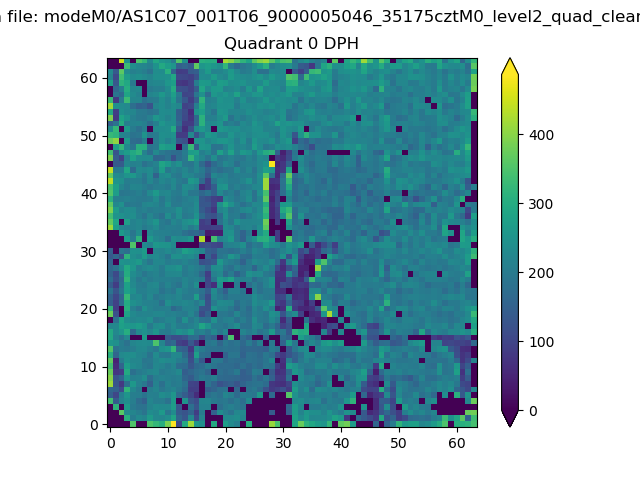 |
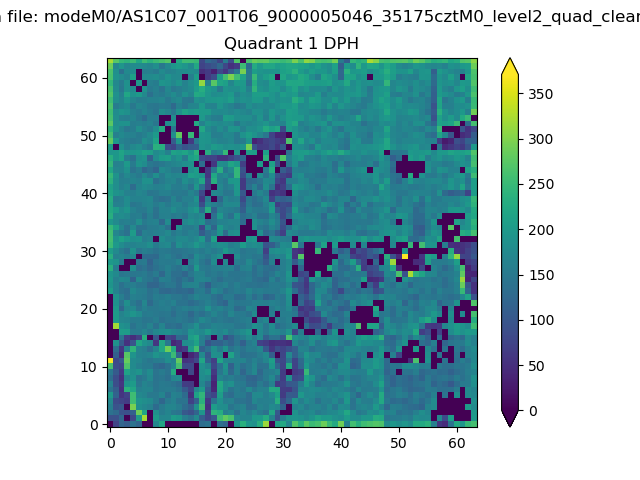 |
Quadrant B |
|---|---|---|---|
| Quadrant D | 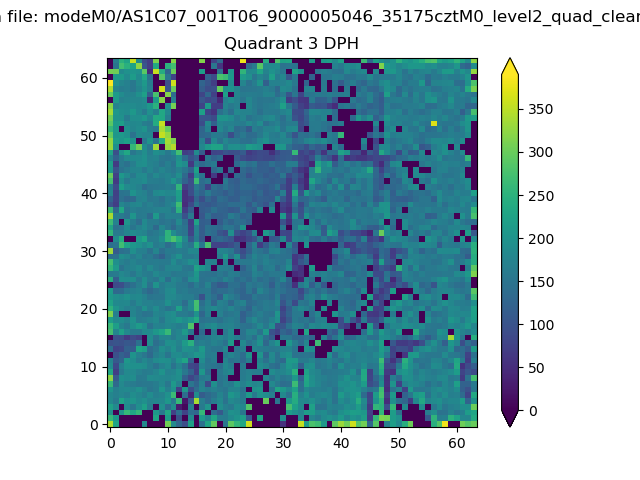 |
 |
Quadrant C |
| Plot type | Count rate plots | Images |
|---|---|---|
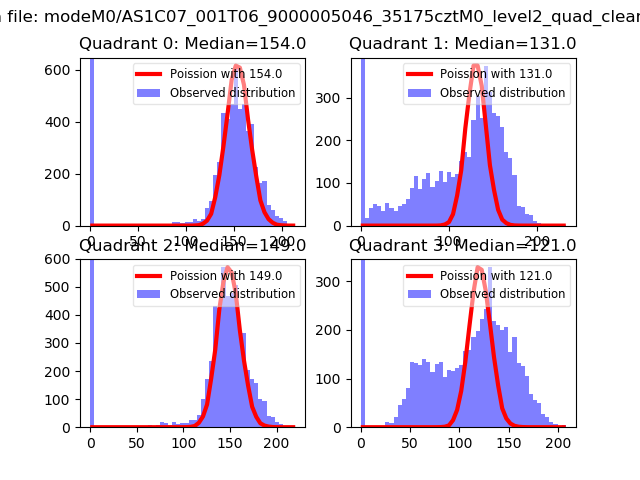
| Comparison with Poisson distribution Blue bars denote a histogram of data divided into 1 sec bins. Red curve is a Poisson curve with rate = median count rate of data. |
 |
 |
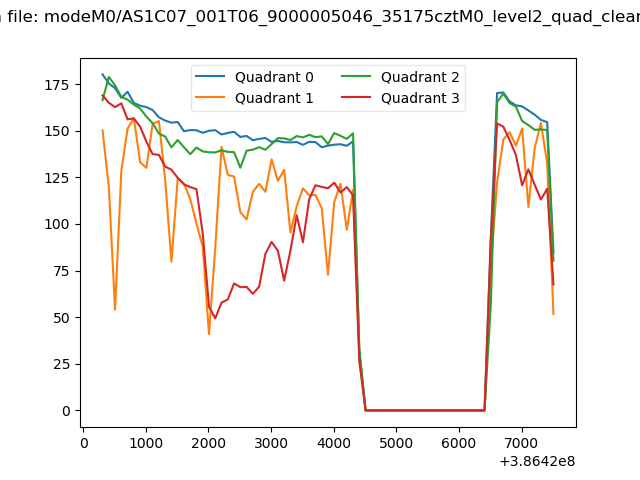
| Quadrant-wise count rates Data is divided into 100 sec bins |
 |
|
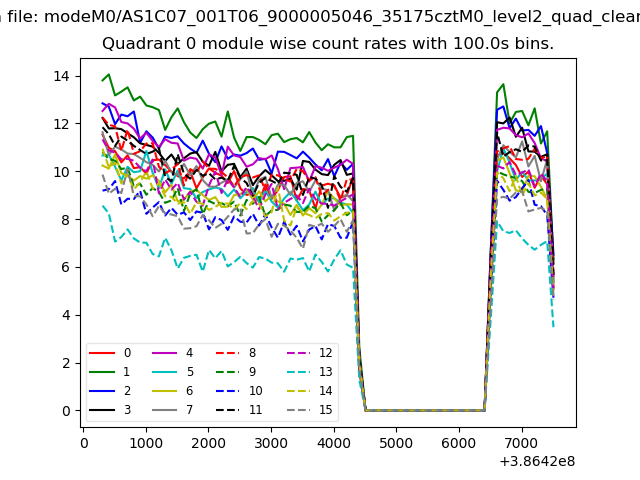
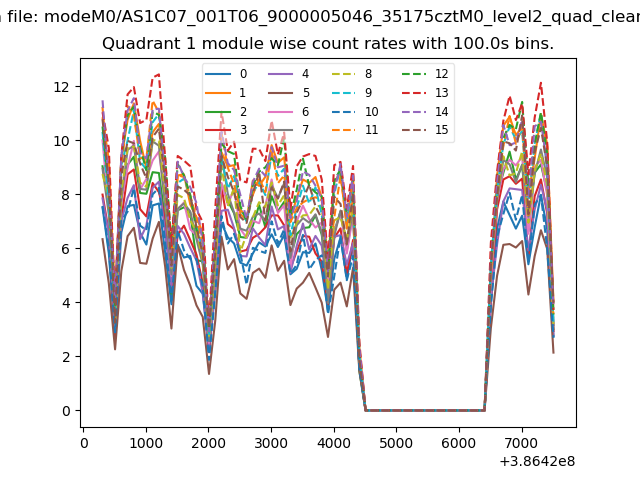
| Module-wise count rates for Quadrant A Data is divided into 100 sec bins |
 |
 |
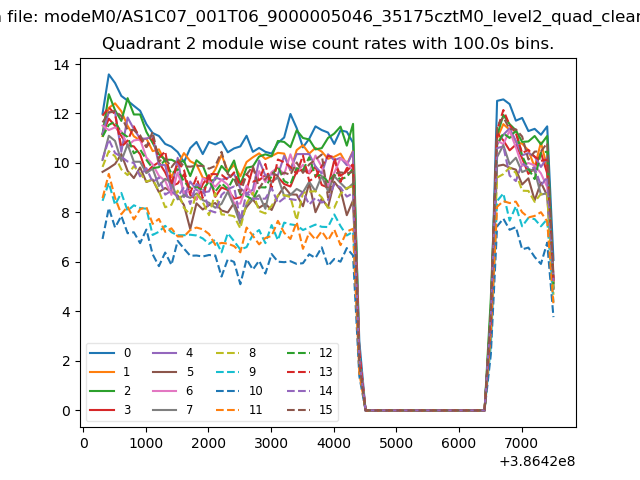
| Module-wise count rates for Quadrant B Data is divided into 100 sec bins |
 |
 |
| Module-wise count rates for Quadrant C Data is divided into 100 sec bins |
 |
 |
| Module-wise count rates for Quadrant D Data is divided into 100 sec bins |
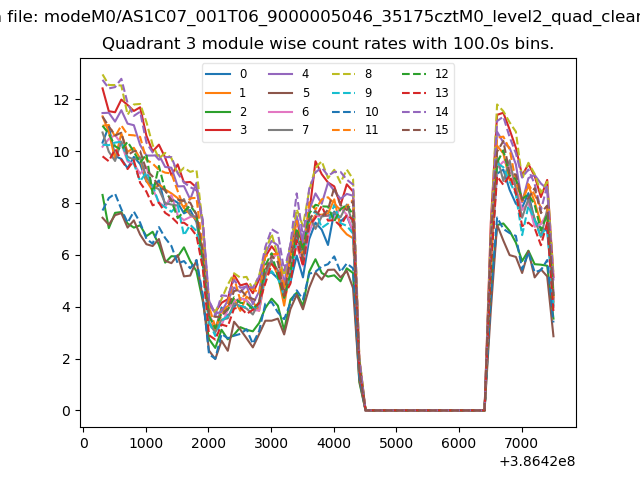 |
 |
| Parameter | Plot |
|---|---|
| CZT HV Monitor | 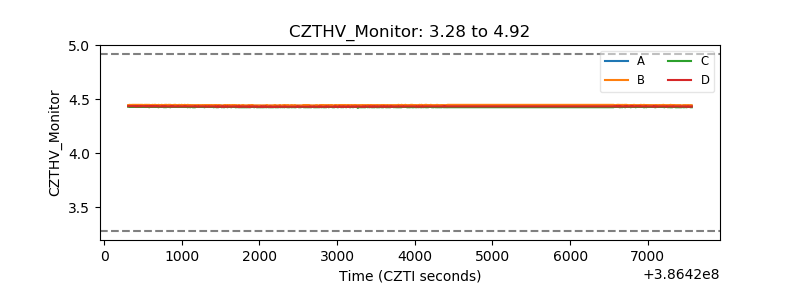 |
| D_VDD | 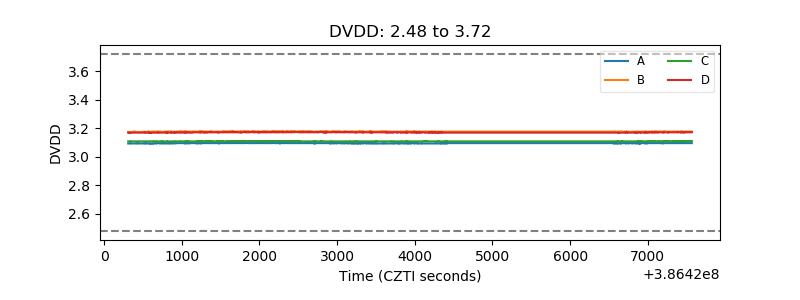 |
| Temperature 1 | 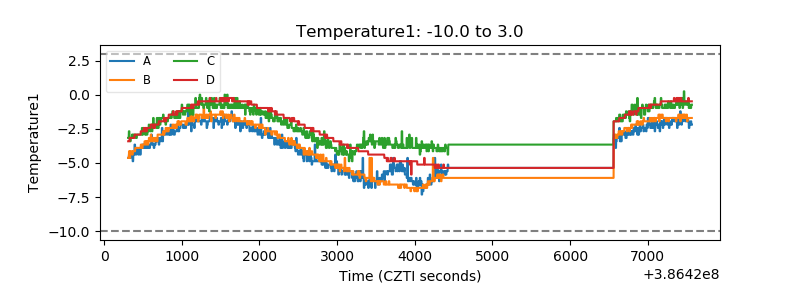 |
| Veto HV Monitor | 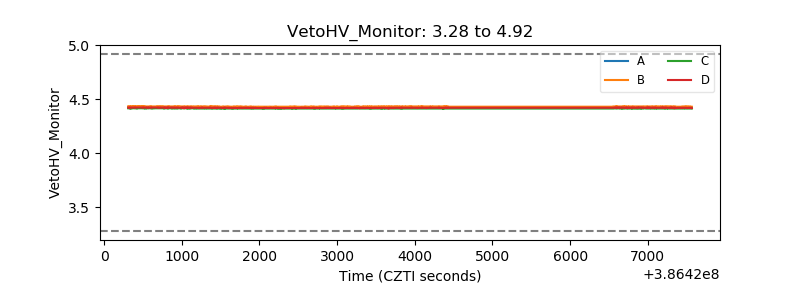 |
| Veto LLD | 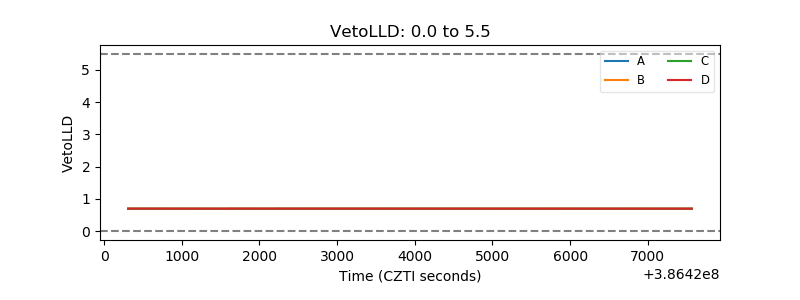 |
| Alpha Counter | 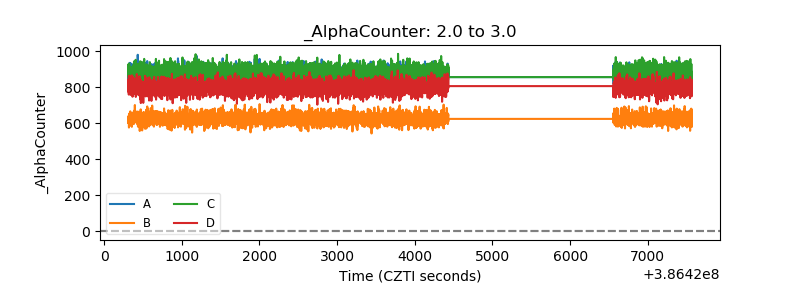 |
| _CPM_Rate | 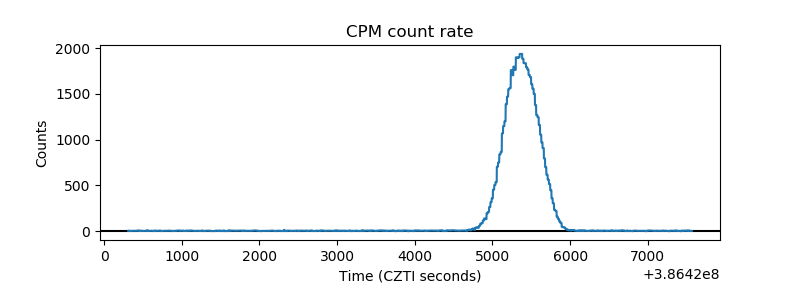 |
| CZT Counter | 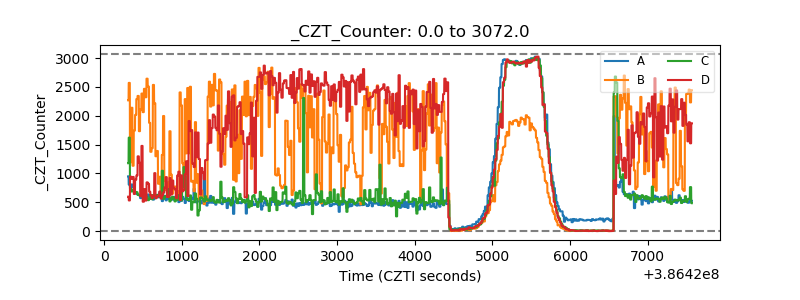 |
| +2.5 Volts monitor | 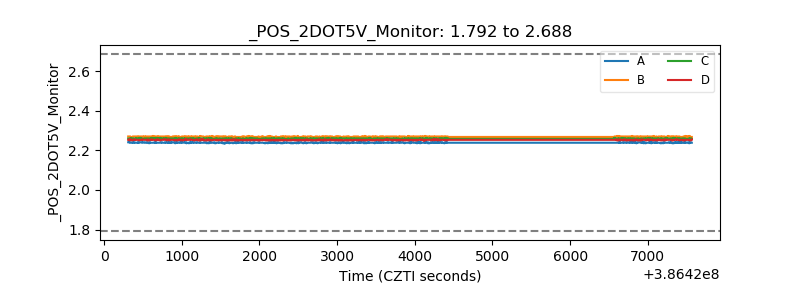 |
| +5 Volts monitor | 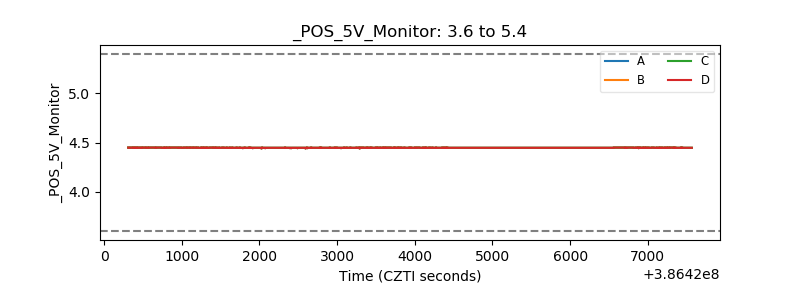 |
| _ROLL_ROT | 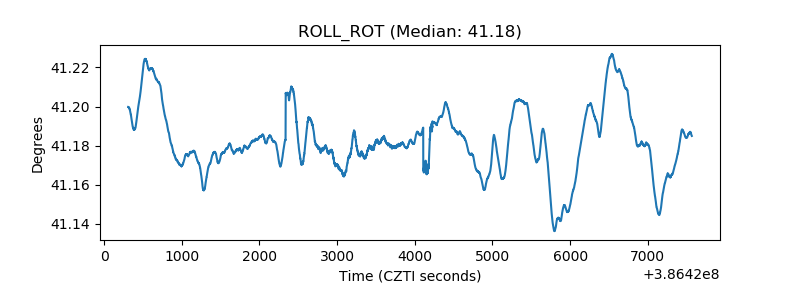 |
| _Roll_DEC | 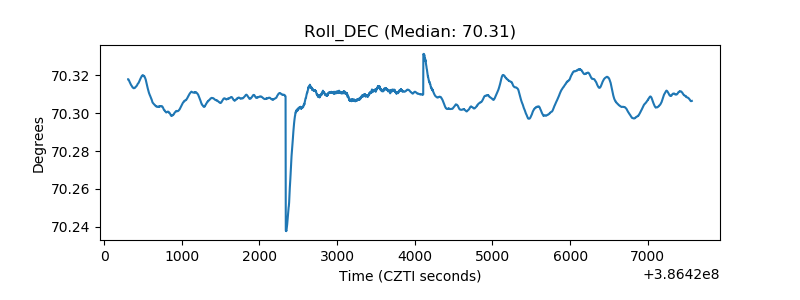 |
| _Roll_RA | 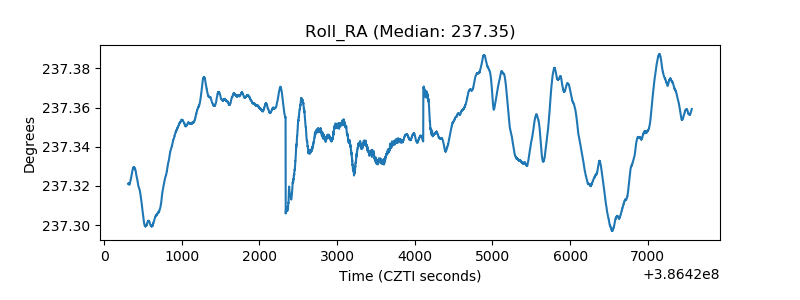 |
| Veto Counter | 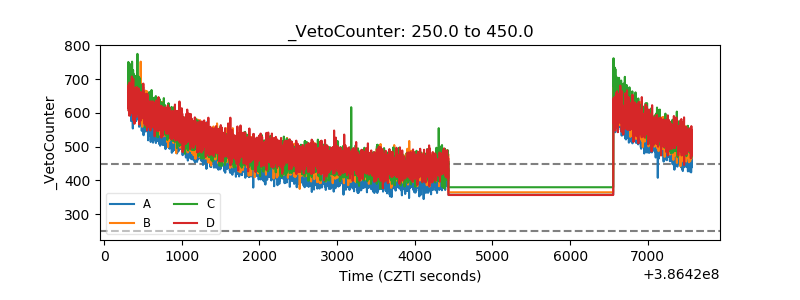 |