| Param | Original file | Final file |
|---|---|---|
| Filename | modeM0/AS1T05_016T01_9000005036_35155cztM0_level2.evt | modeM0/AS1T05_016T01_9000005036_35155cztM0_level2_quad_clean.evt |
| Size (bytes) | 882,357,120 | 136,555,200 |
| Size | 841.5 MB | 130.2 MB |
| Events in quadrant A | 3,990,742 | 949,364 |
| Events in quadrant B | 9,943,562 | 829,807 |
| Events in quadrant C | 4,571,902 | 930,075 |
| Events in quadrant D | 7,664,731 | 857,711 |
| Mode SS | |||
|---|---|---|---|
| Quadrant | BADHDUFLAG | Total packets | Discarded packets |
| A | 0 | 164 | 0 |
| B | 0 | 164 | 0 |
| C | 0 | 164 | 0 |
| D | 0 | 164 | 0 |
| Mode M9 | |||
|---|---|---|---|
| Quadrant | BADHDUFLAG | Total packets | Discarded packets |
| A | 0 | 29 | 0 |
| B | 0 | 29 | 0 |
| C | 0 | 29 | 0 |
| D | 0 | 29 | 0 |
| Mode M0 | |||
|---|---|---|---|
| Quadrant | BADHDUFLAG | Total packets | Discarded packets |
| A | 0 | 16966 | 2 |
| B | 0 | 35227 | 2 |
| C | 0 | 18304 | 2 |
| D | 0 | 28475 | 2 |
| Quadrant | Total seconds | Saturated seconds | Saturation percentage |
|---|---|---|---|
| A | 8186 | 42 | 0.513071% |
| B | 8186 | 2133 | 26.056682% |
| C | 8186 | 98 | 1.197166% |
| D | 8186 | 504 | 6.156853% |
Noise dominated data is calculated using 1-second bins in cleaned event files. If a bin has >2000 counts, and if more than 50% of those come from <1% of pixels, then it is considered to be noise-dominated and hence unusable.
| Quadrant | # 1 sec bins | Bins with >0 counts | Bins with >2000 counts | High rate bins dominated by noise | Noise dominated (total time) | Noise dominated (detector-on time) | Marked lightcurve |
|---|---|---|---|---|---|---|---|
| A | 10961 | 8188 | 18 | 18 | 0.16% | 0.22% | 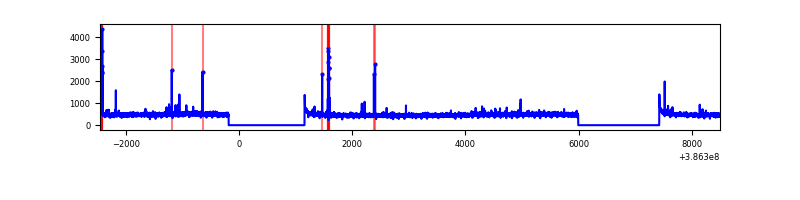 |
| B | 10961 | 8188 | 1304 | 1304 | 11.90% | 15.93% | 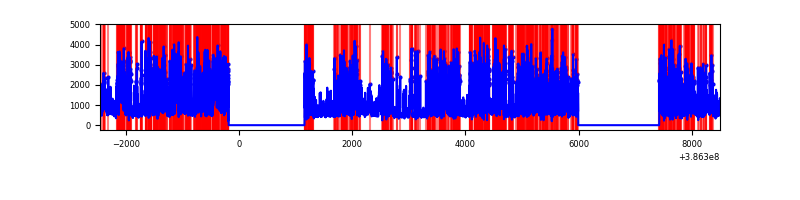 |
| C | 10961 | 8188 | 79 | 79 | 0.72% | 0.96% | 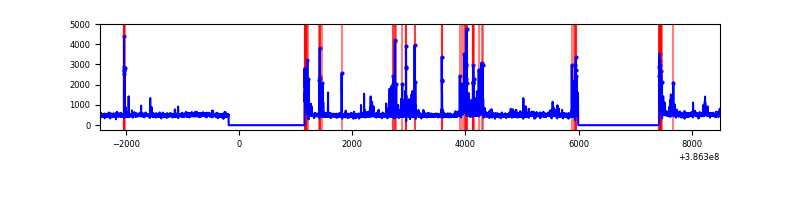 |
| D | 10961 | 8188 | 423 | 423 | 3.86% | 5.17% | 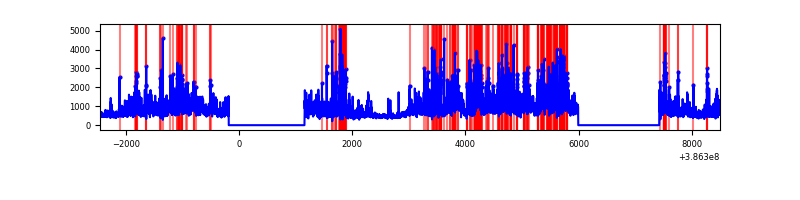 |
Top three noisy pixels from each quadrant. If the there are fewer than three noisy pixels in the level2.evt file, extra rows are filled as -1
| Pixel properties | Quadrant properties | ||||||
|---|---|---|---|---|---|---|---|
| Quadrant | DetID | PixID | Counts | Sigma | Mean | Median | Sigma |
| A | 10 | 83 | 112469 | 580.26 | 959 | 937 | 192.2 |
| A | 9 | 143 | 86832 | 446.88 | 959 | 937 | 192.2 |
| A | 15 | 169 | 63875 | 327.45 | 959 | 937 | 192.2 |
| B | 5 | 236 | 6032485 | 37276.59 | 852 | 829 | 161.8 |
| B | 5 | 200 | 311962 | 1922.85 | 852 | 829 | 161.8 |
| B | 5 | 172 | 168733 | 1037.67 | 852 | 829 | 161.8 |
| C | 15 | 214 | 342527 | 1606.18 | 922 | 926 | 212.7 |
| C | 1 | 23 | 286850 | 1344.39 | 922 | 926 | 212.7 |
| C | 0 | 10 | 179658 | 840.39 | 922 | 926 | 212.7 |
| D | 8 | 195 | 2129113 | 9611.8 | 909 | 884 | 221.4 |
| D | 13 | 249 | 583920 | 2633.19 | 909 | 884 | 221.4 |
| D | 12 | 233 | 303226 | 1365.48 | 909 | 884 | 221.4 |
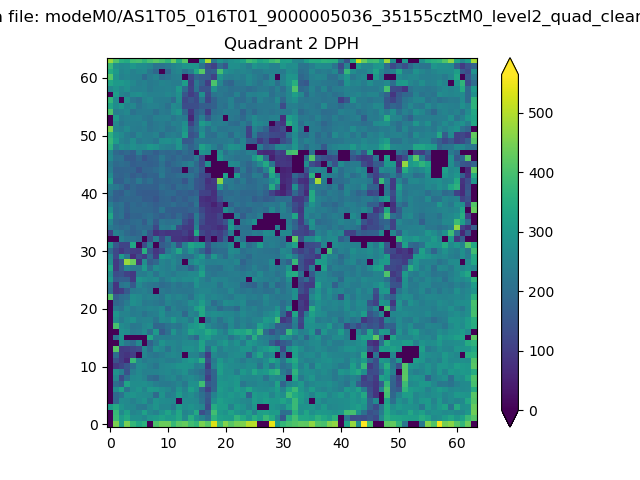
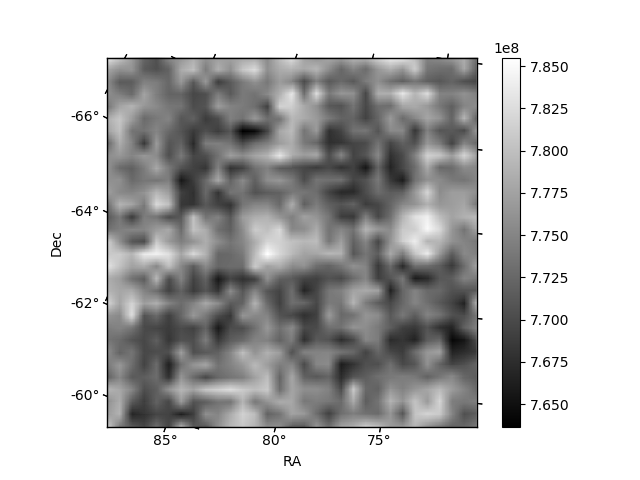
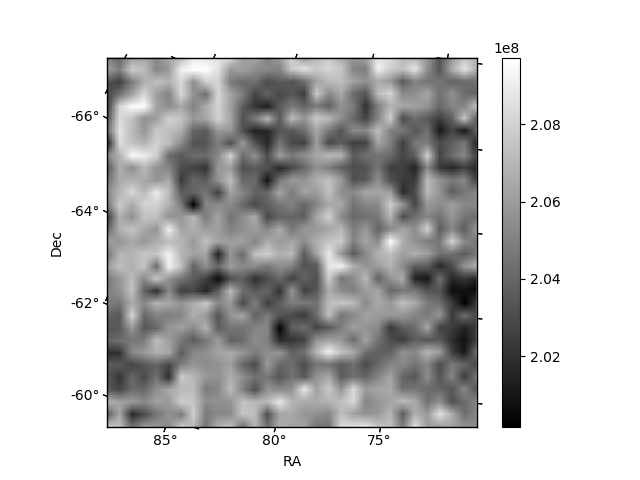
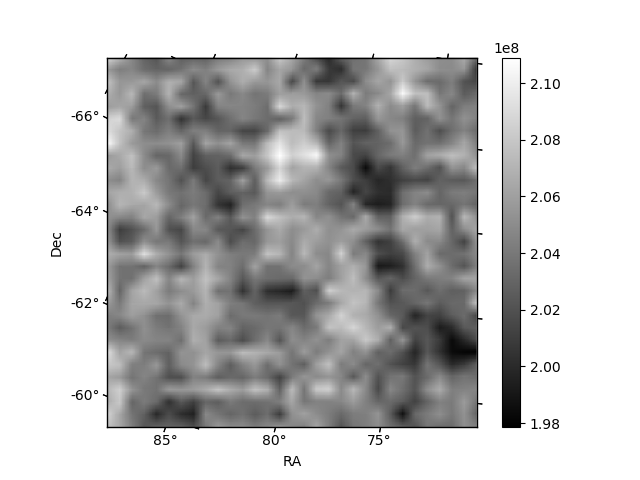
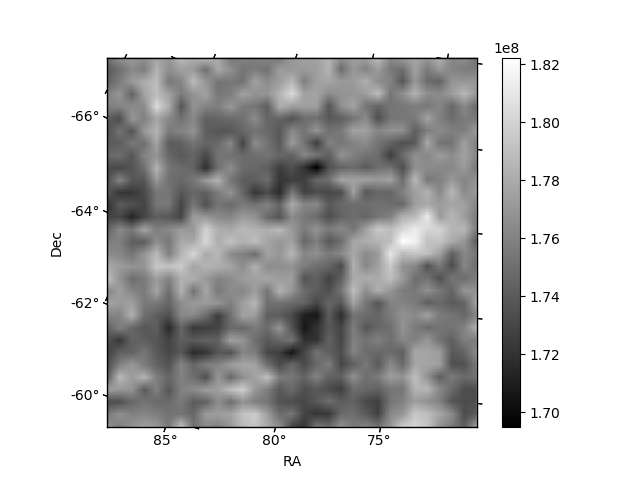
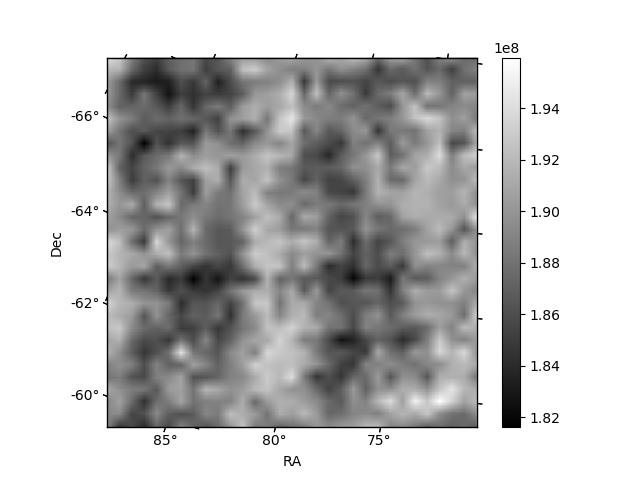
Histogram calculated using DETX and DETY for each event in the final _common_clean file
| Quadrant A | 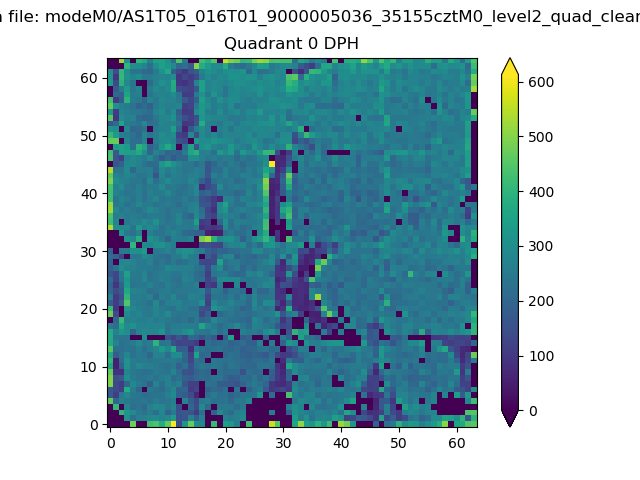 |
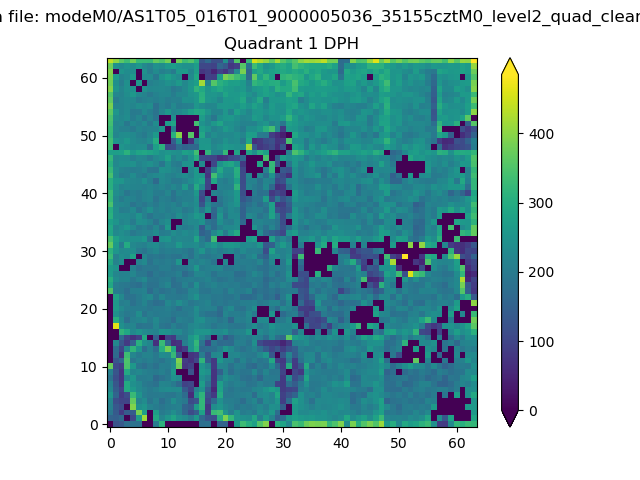 |
Quadrant B |
|---|---|---|---|
| Quadrant D | 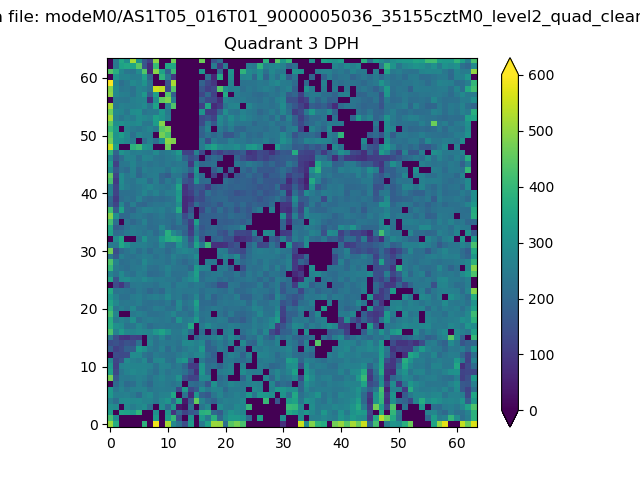 |
 |
Quadrant C |
| Plot type | Count rate plots | Images |
|---|---|---|
| Comparison with Poisson distribution Blue bars denote a histogram of data divided into 1 sec bins. Red curve is a Poisson curve with rate = median count rate of data. |
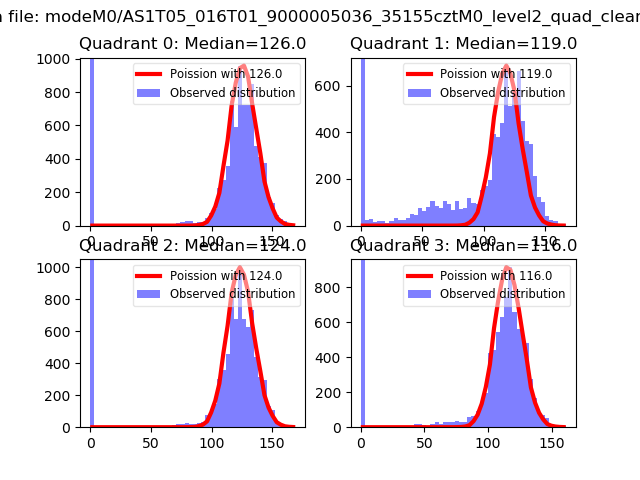 |
 |
| Quadrant-wise count rates Data is divided into 100 sec bins |
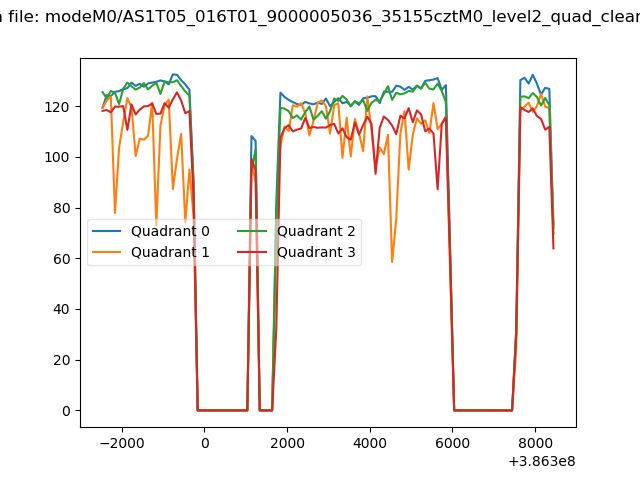 |
|
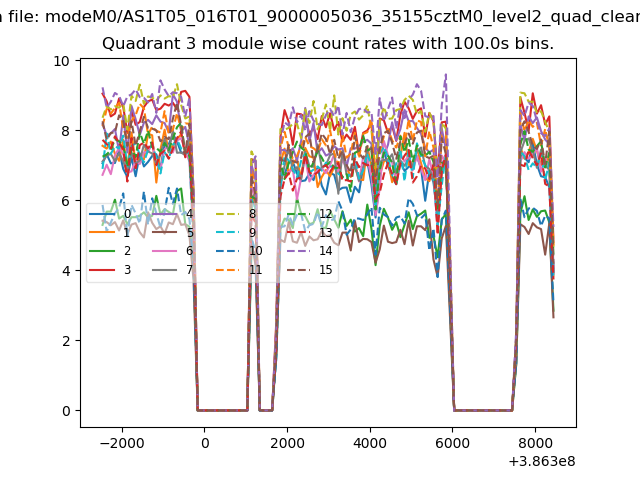
| Module-wise count rates for Quadrant A Data is divided into 100 sec bins |
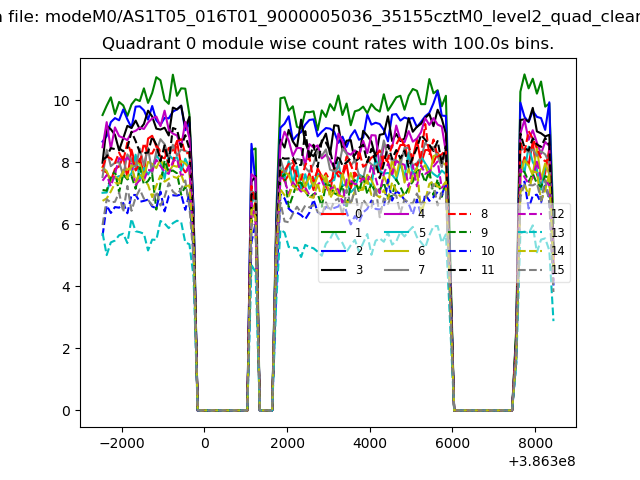 |
 |
| Module-wise count rates for Quadrant B Data is divided into 100 sec bins |
 |
 |
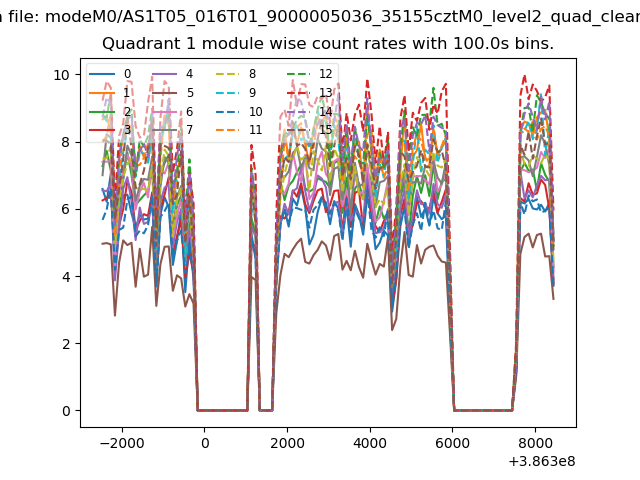
| Module-wise count rates for Quadrant C Data is divided into 100 sec bins |
 |
 |
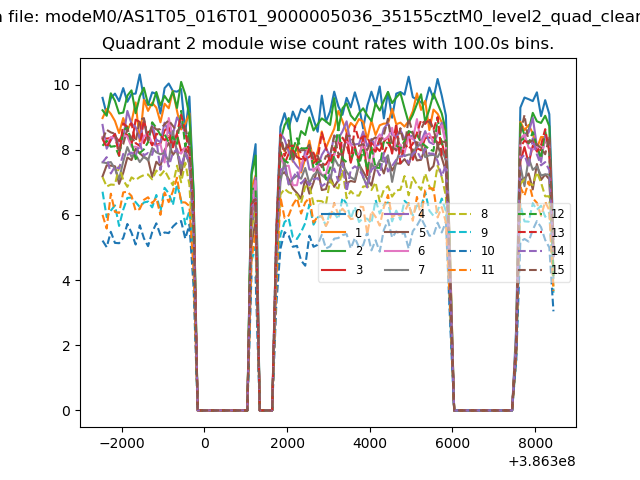
| Module-wise count rates for Quadrant D Data is divided into 100 sec bins |
 |
 |
| Parameter | Plot |
|---|---|
| CZT HV Monitor | 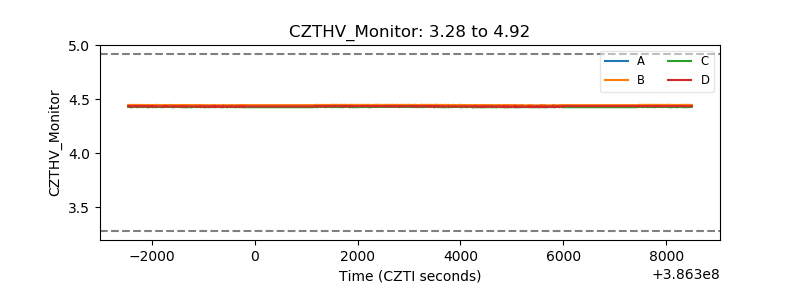 |
| D_VDD | 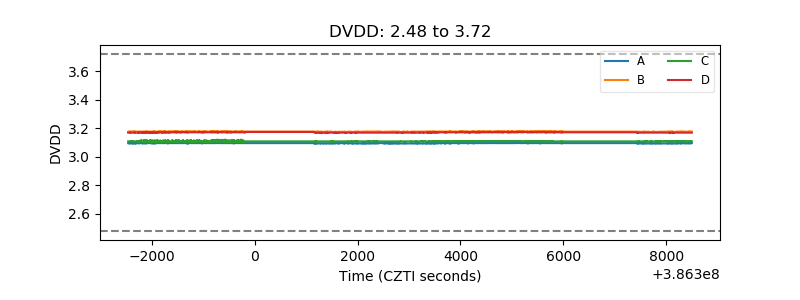 |
| Temperature 1 | 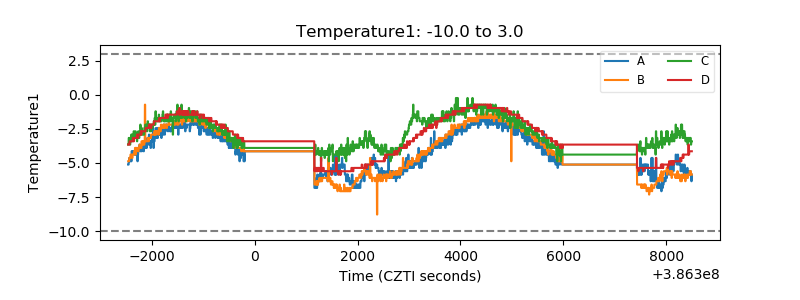 |
| Veto HV Monitor | 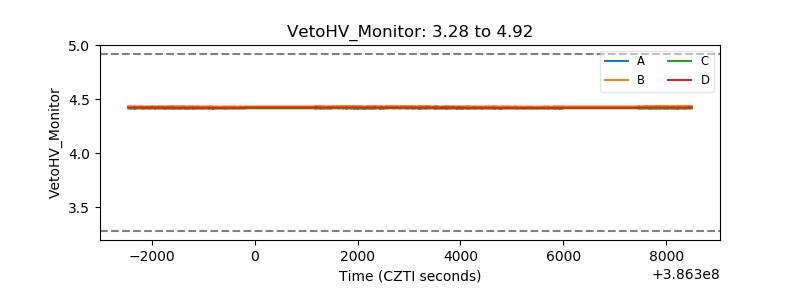 |
| Veto LLD | 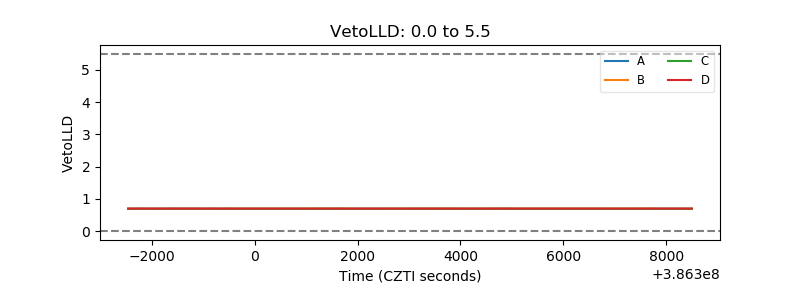 |
| Alpha Counter | 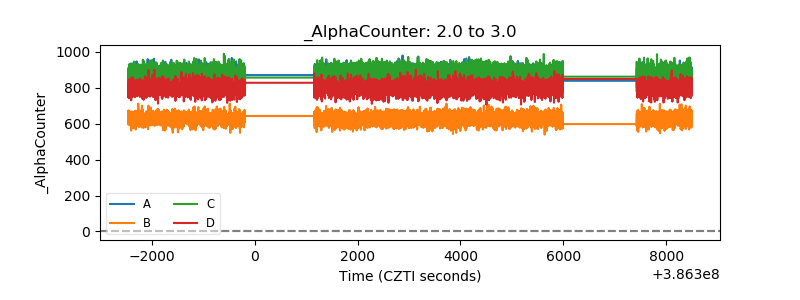 |
| _CPM_Rate | 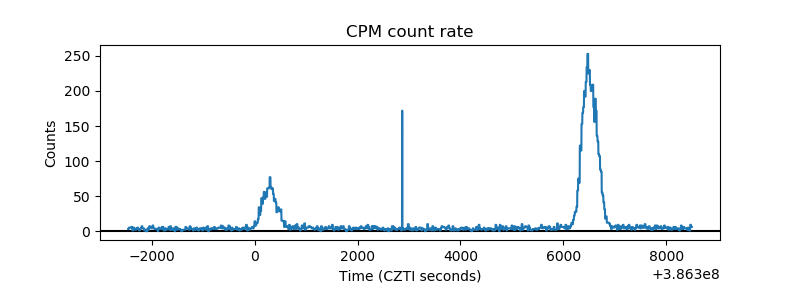 |
| CZT Counter | 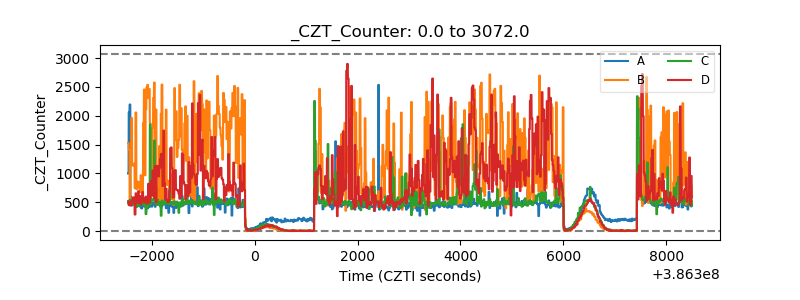 |
| +2.5 Volts monitor | 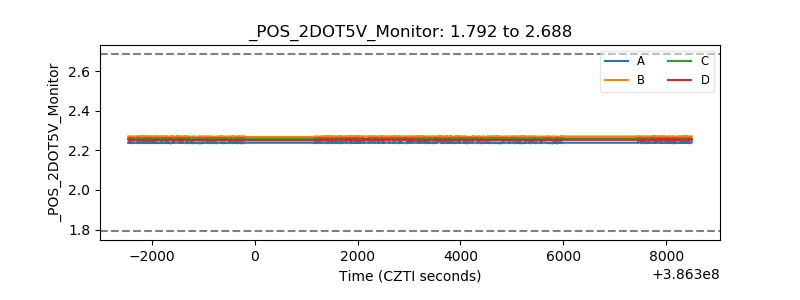 |
| +5 Volts monitor | 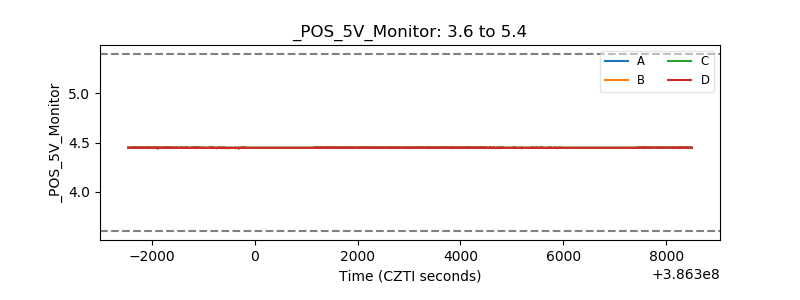 |
| _ROLL_ROT | 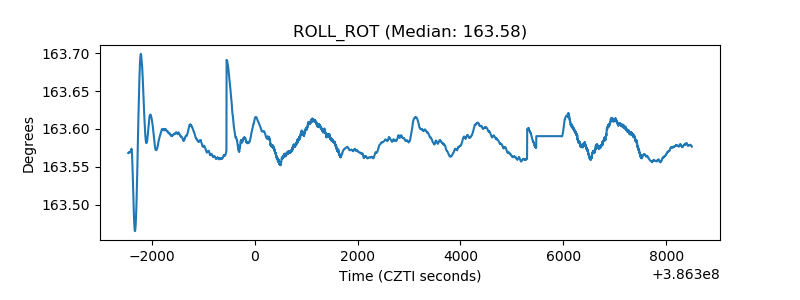 |
| _Roll_DEC | 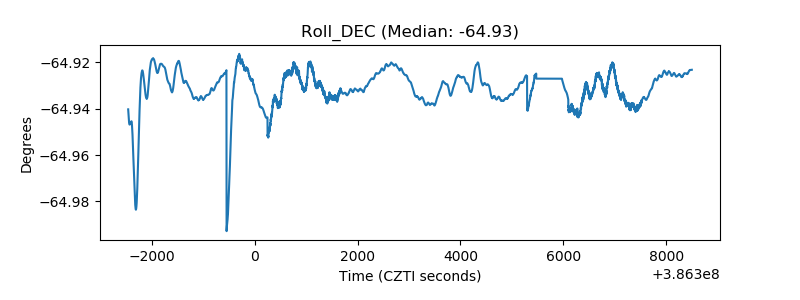 |
| _Roll_RA | 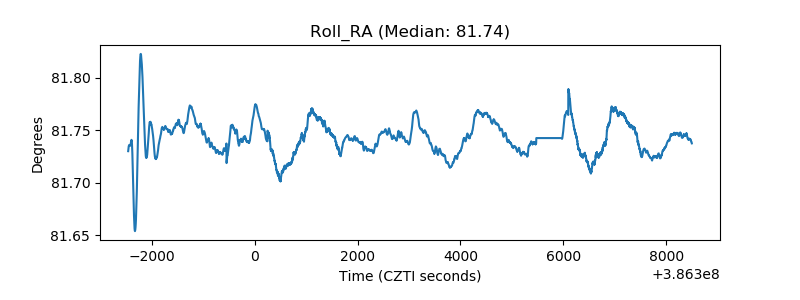 |
| Veto Counter | 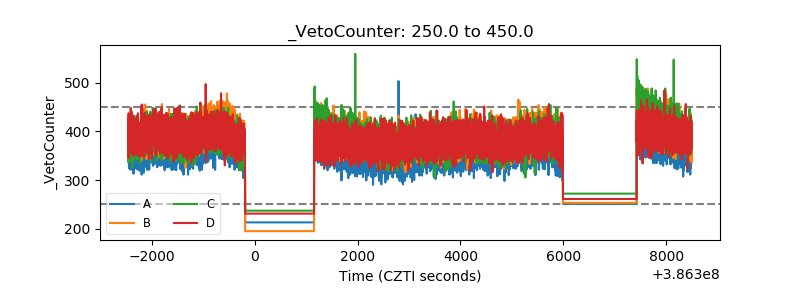 |