| Param | Original file | Final file |
|---|---|---|
| Filename | modeM0/AS1T05_016T01_9000005036cztM0_level2_bc.evt | modeM0/AS1T05_016T01_9000005036cztM0_level2_quad_clean.evt |
| Size (bytes) | 509,477,760 | 136,546,560 |
| Size | 485.9 MB | 130.2 MB |
| Events in quadrant A | 1,841,209 | 949,343 |
| Events in quadrant B | 5,557,780 | 829,798 |
| Events in quadrant C | 2,416,015 | 930,065 |
| Events in quadrant D | 5,051,837 | 857,693 |
| Mode SS | |||
|---|---|---|---|
| Quadrant | BADHDUFLAG | Total packets | Discarded packets |
| A | 0 | 164 | 0 |
| B | 0 | 164 | 0 |
| C | 0 | 164 | 0 |
| D | 0 | 164 | 0 |
| Mode M9 | |||
|---|---|---|---|
| Quadrant | BADHDUFLAG | Total packets | Discarded packets |
| A | 0 | 29 | 0 |
| B | 0 | 29 | 0 |
| C | 0 | 29 | 0 |
| D | 0 | 29 | 0 |
| Mode M0 | |||
|---|---|---|---|
| Quadrant | BADHDUFLAG | Total packets | Discarded packets |
| A | 0 | 16964 | 0 |
| B | 0 | 35225 | 0 |
| C | 0 | 18302 | 0 |
| D | 0 | 28473 | 0 |
| Quadrant | Total seconds | Saturated seconds | Saturation percentage |
|---|---|---|---|
| A | 8186 | 42 | 0.513071% |
| B | 8186 | 2133 | 26.056682% |
| C | 8186 | 98 | 1.197166% |
| D | 8186 | 504 | 6.156853% |
Noise dominated data is calculated using 1-second bins in cleaned event files. If a bin has >2000 counts, and if more than 50% of those come from <1% of pixels, then it is considered to be noise-dominated and hence unusable.
| Quadrant | # 1 sec bins | Bins with >0 counts | Bins with >2000 counts | High rate bins dominated by noise | Noise dominated (total time) | Noise dominated (detector-on time) | Marked lightcurve |
|---|---|---|---|---|---|---|---|
| A | 10961 | 8188 | 5 | 5 | 0.05% | 0.06% | 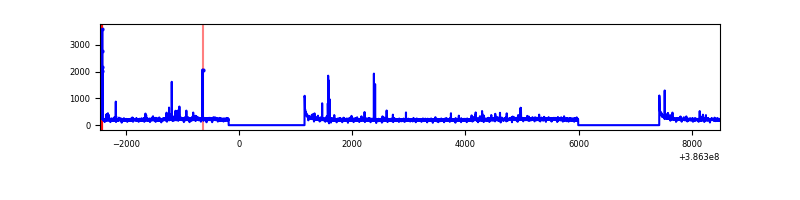 |
| B | 10961 | 8185 | 111 | 111 | 1.01% | 1.36% | 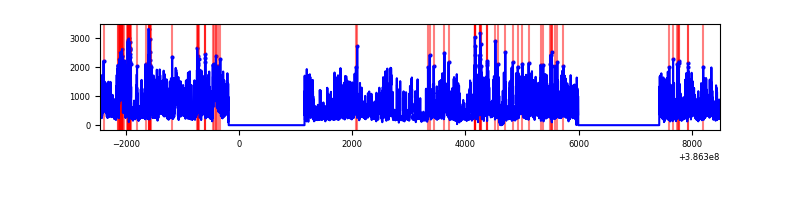 |
| C | 10961 | 8186 | 23 | 23 | 0.21% | 0.28% | 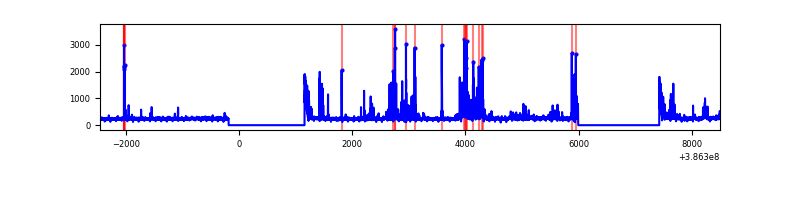 |
| D | 10961 | 8186 | 53 | 53 | 0.48% | 0.65% | 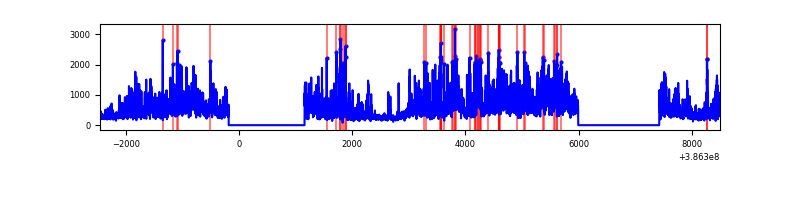 |
Top three noisy pixels from each quadrant. If the there are fewer than three noisy pixels in the level2.evt file, extra rows are filled as -1
| Pixel properties | Quadrant properties | ||||||
|---|---|---|---|---|---|---|---|
| Quadrant | DetID | PixID | Counts | Sigma | Mean | Median | Sigma |
| A | 10 | 83 | 107980 | 1136.86 | 413 | 405 | 94.6 |
| A | 9 | 143 | 58323 | 612.08 | 413 | 405 | 94.6 |
| A | 15 | 169 | 54598 | 572.72 | 413 | 405 | 94.6 |
| B | 5 | 236 | 3692105 | 48420.46 | 366 | 357 | 76.2 |
| B | 5 | 200 | 262940 | 3444.0 | 366 | 357 | 76.2 |
| B | 5 | 172 | 123962 | 1621.19 | 366 | 357 | 76.2 |
| C | 15 | 214 | 326488 | 3462.78 | 399 | 394 | 94.2 |
| C | 1 | 23 | 243514 | 2581.68 | 399 | 394 | 94.2 |
| C | 0 | 10 | 133784 | 1416.46 | 399 | 394 | 94.2 |
| D | 8 | 195 | 2058520 | 21417.28 | 392 | 379 | 96.1 |
| D | 13 | 249 | 346814 | 3605.05 | 392 | 379 | 96.1 |
| D | 12 | 79 | 279776 | 2907.44 | 392 | 379 | 96.1 |
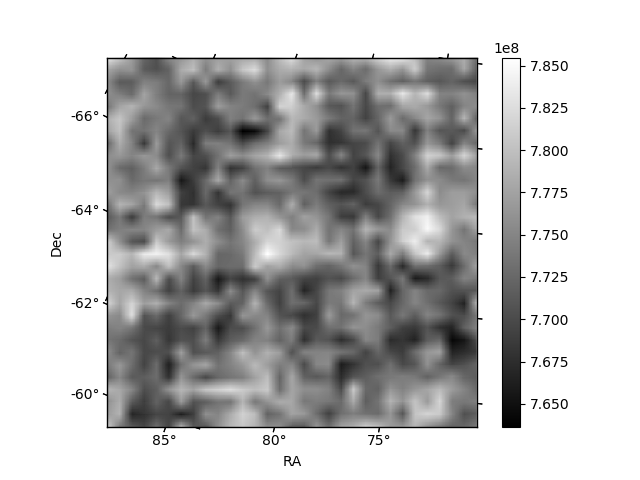
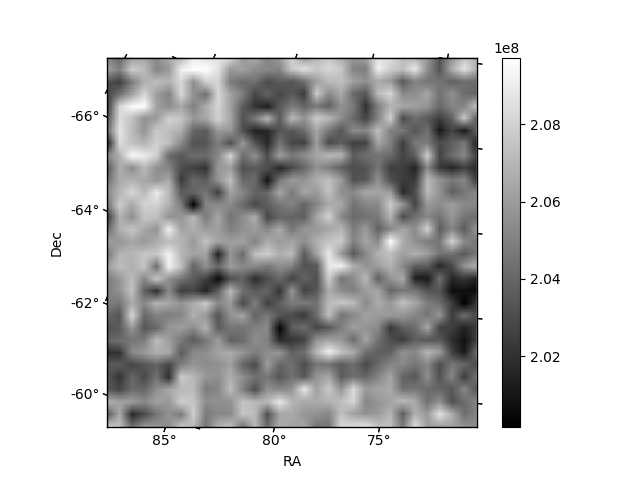
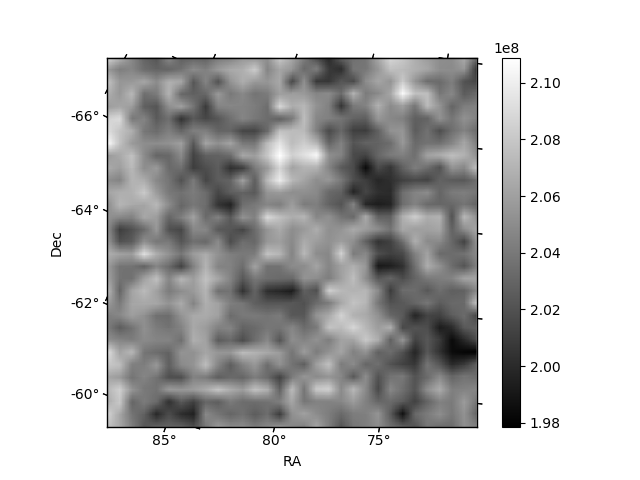
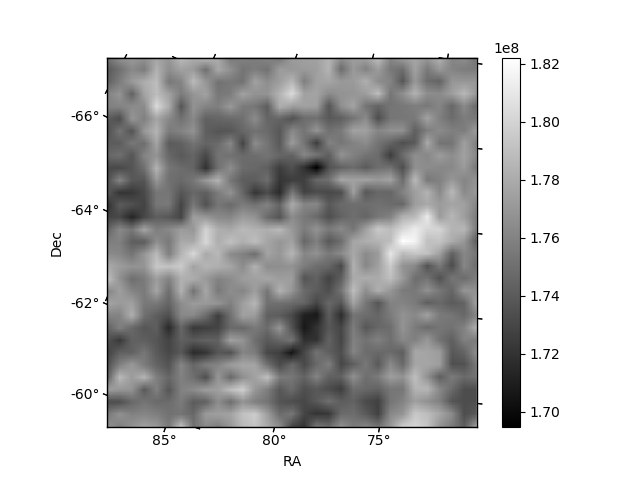
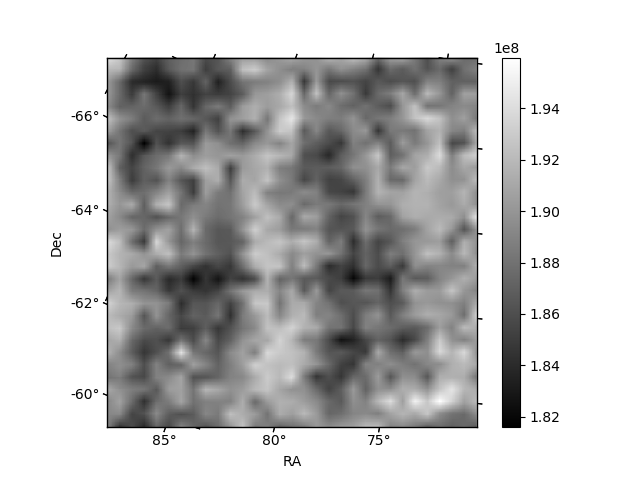
Histogram calculated using DETX and DETY for each event in the final _common_clean file
| Quadrant A | 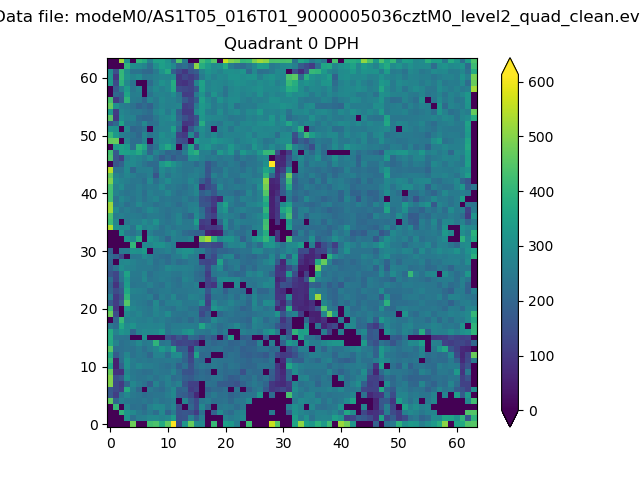 |
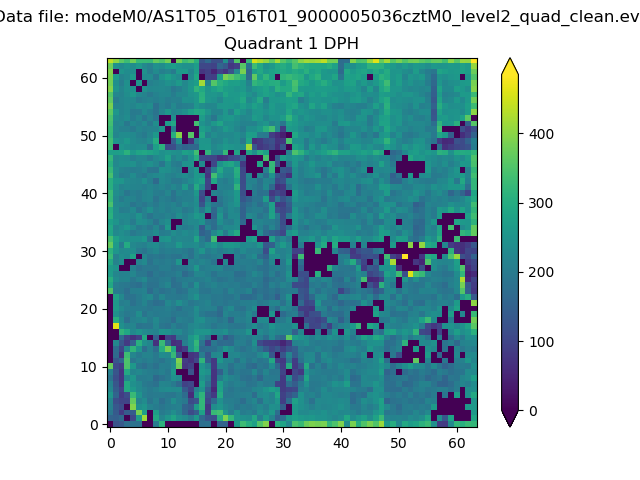 |
Quadrant B |
|---|---|---|---|
| Quadrant D | 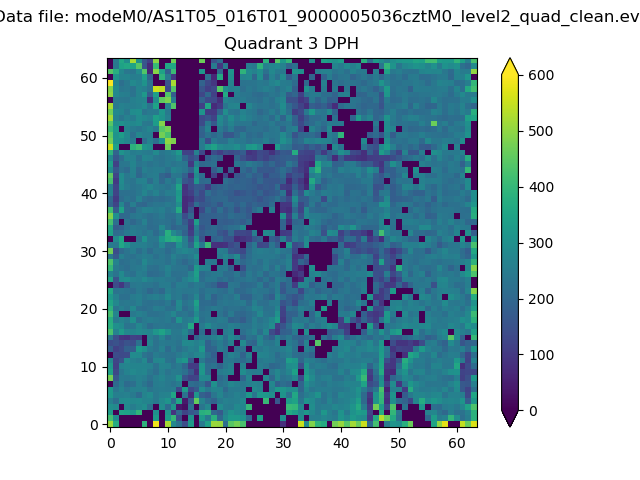 |
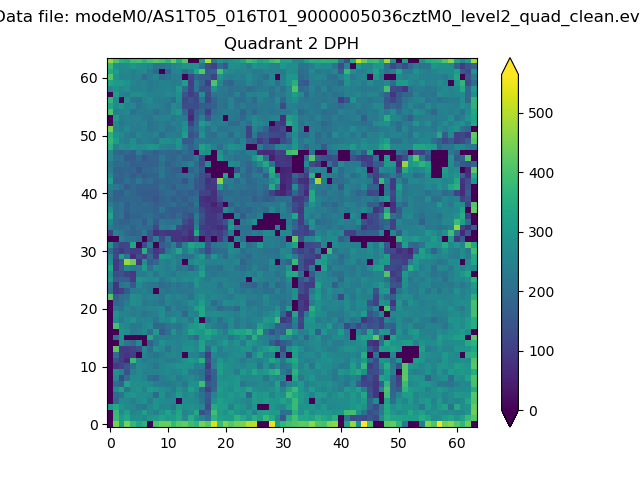 |
Quadrant C |
| Plot type | Count rate plots | Images |
|---|---|---|
| Comparison with Poisson distribution Blue bars denote a histogram of data divided into 1 sec bins. Red curve is a Poisson curve with rate = median count rate of data. |
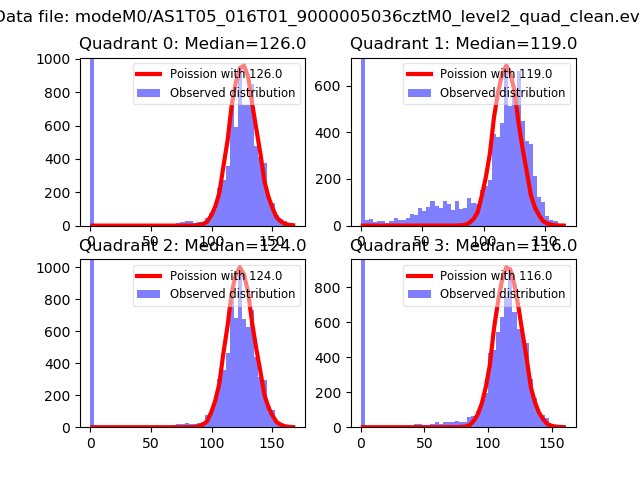 |
 |
| Quadrant-wise count rates Data is divided into 100 sec bins |
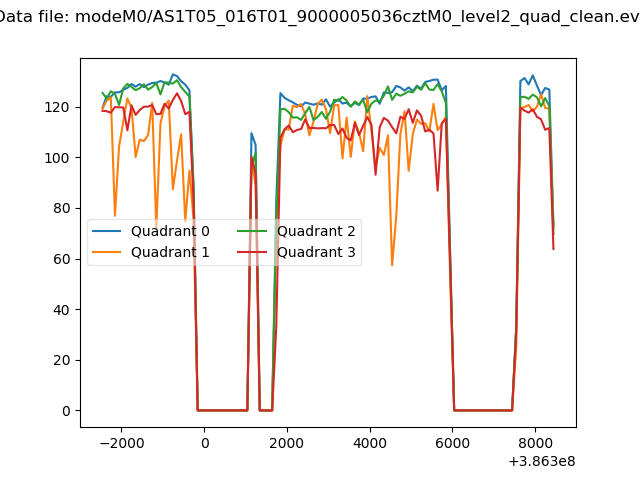 |
|
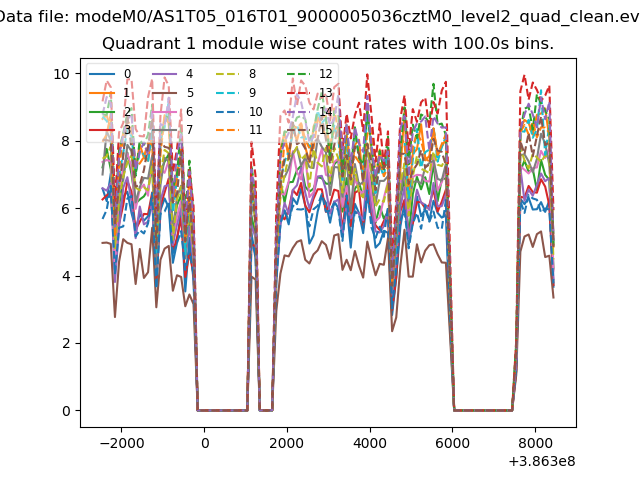
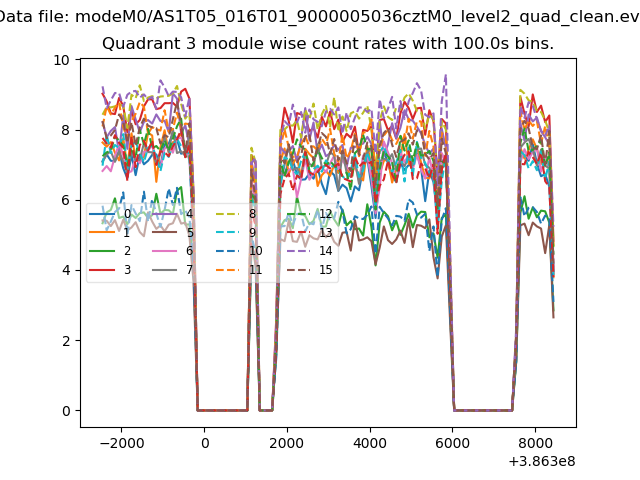
| Module-wise count rates for Quadrant A Data is divided into 100 sec bins |
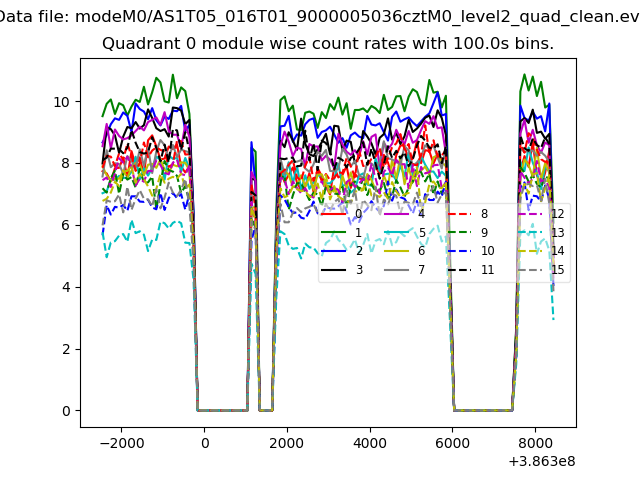 |
 |
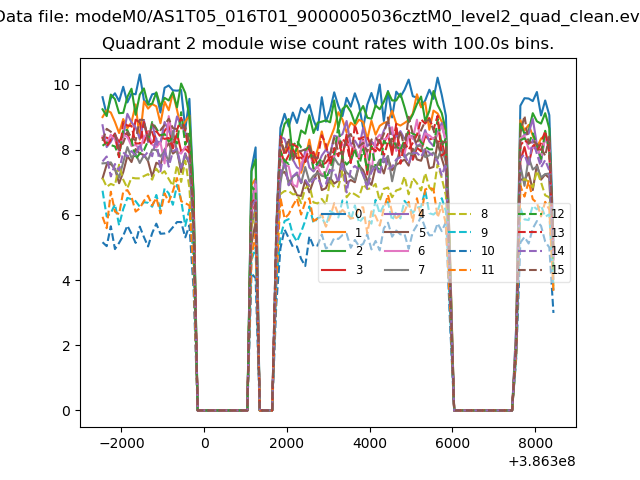
| Module-wise count rates for Quadrant B Data is divided into 100 sec bins |
 |
 |
| Module-wise count rates for Quadrant C Data is divided into 100 sec bins |
 |
 |
| Module-wise count rates for Quadrant D Data is divided into 100 sec bins |
 |
 |
| Parameter | Plot |
|---|---|
| CZT HV Monitor | 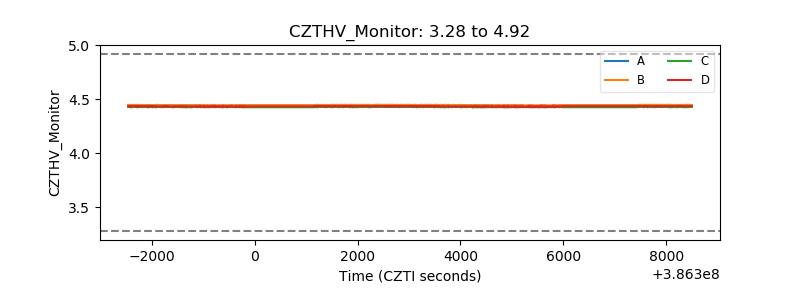 |
| D_VDD | 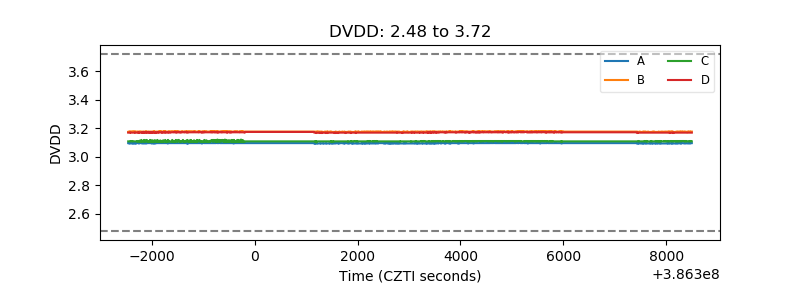 |
| Temperature 1 | 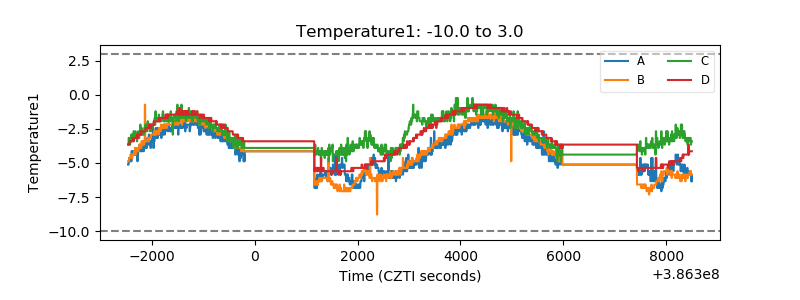 |
| Veto HV Monitor | 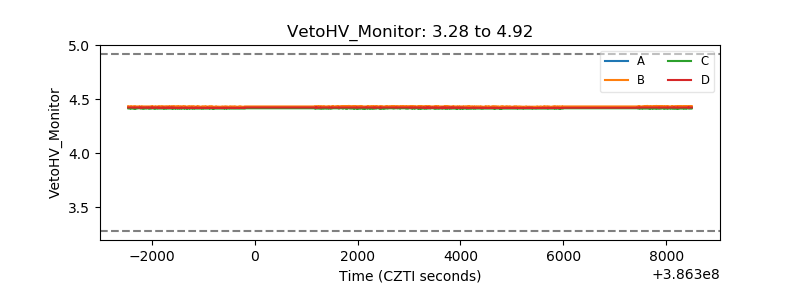 |
| Veto LLD | 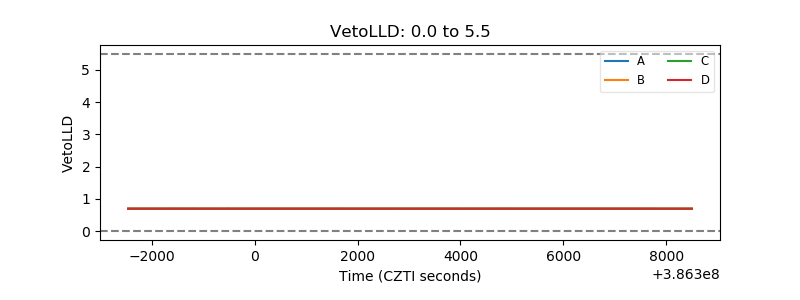 |
| Alpha Counter | 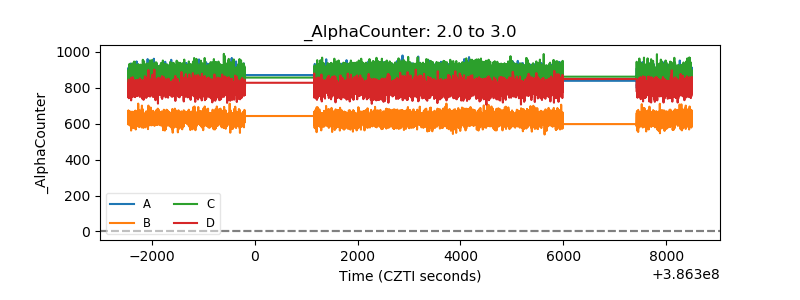 |
| _CPM_Rate | 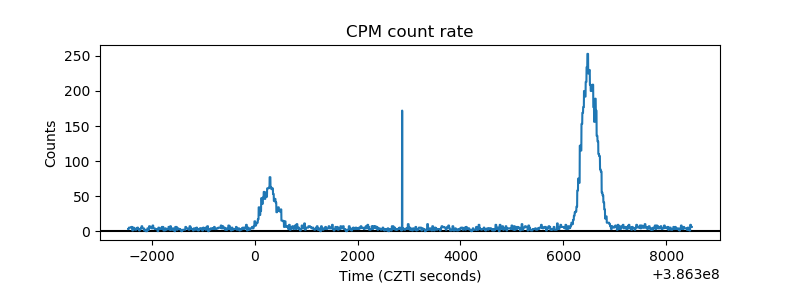 |
| CZT Counter | 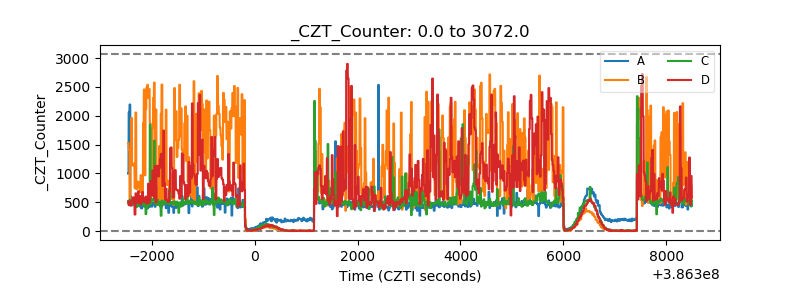 |
| +2.5 Volts monitor | 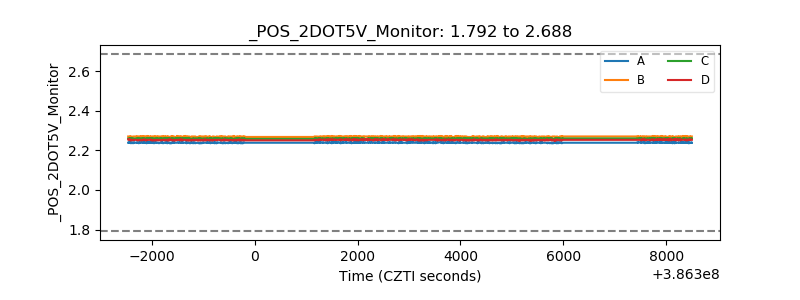 |
| +5 Volts monitor | 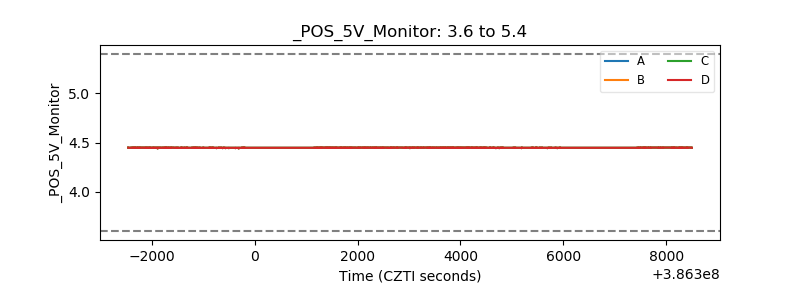 |
| _ROLL_ROT | 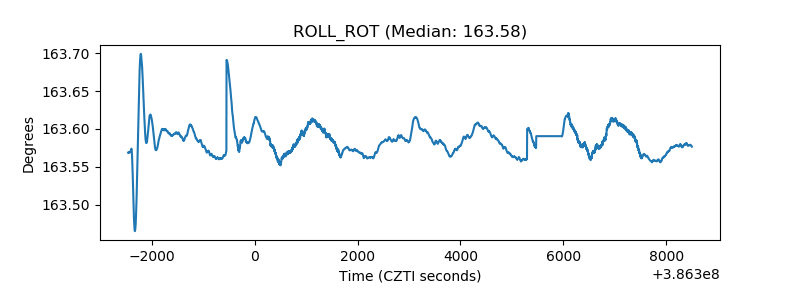 |
| _Roll_DEC | 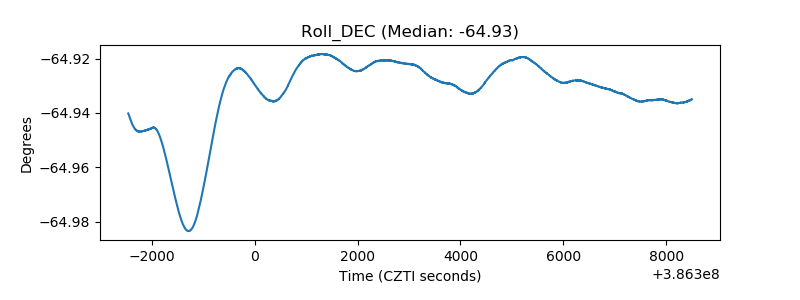 |
| _Roll_RA | 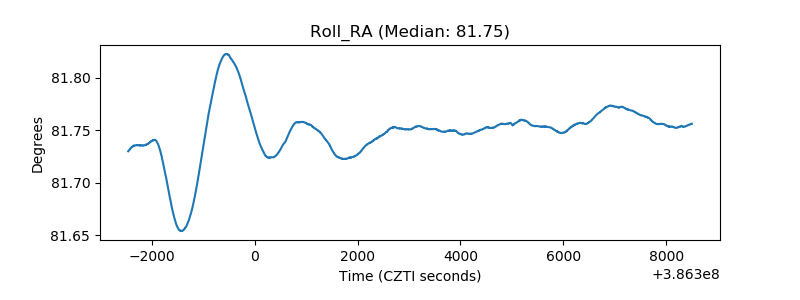 |
| Veto Counter | 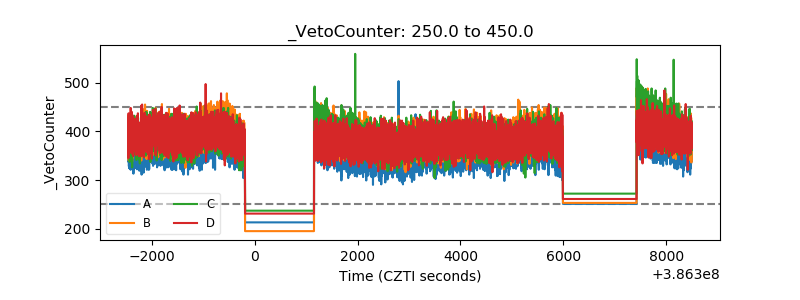 |