| Param | Original file | Final file |
|---|---|---|
| Filename | modeM0/AS1C07_006T01_9000005040_35161cztM0_level2.evt | modeM0/AS1C07_006T01_9000005040_35161cztM0_level2_quad_clean.evt |
| Size (bytes) | 120,902,400 | 10,895,040 |
| Size | 115.3 MB | 10.4 MB |
| Events in quadrant A | 597,778 | 68,559 |
| Events in quadrant B | 1,186,793 | 57,988 |
| Events in quadrant C | 795,836 | 66,737 |
| Events in quadrant D | 1,013,830 | 62,141 |
| Mode M9 | |||
|---|---|---|---|
| Quadrant | BADHDUFLAG | Total packets | Discarded packets |
| A | 0 | 22 | 0 |
| B | 0 | 22 | 0 |
| C | 0 | 22 | 0 |
| D | 0 | 22 | 0 |
| Mode M0 | |||
|---|---|---|---|
| Quadrant | BADHDUFLAG | Total packets | Discarded packets |
| A | 0 | 2406 | 2 |
| B | 0 | 4190 | 1 |
| C | 0 | 3051 | 1 |
| D | 0 | 3694 | 1 |
| Mode SS | |||
|---|---|---|---|
| Quadrant | BADHDUFLAG | Total packets | Discarded packets |
| A | 0 | 20 | 0 |
| B | 0 | 20 | 0 |
| C | 0 | 20 | 0 |
| D | 0 | 20 | 0 |
| Quadrant | Total seconds | Saturated seconds | Saturation percentage |
|---|---|---|---|
| A | 956 | 7 | 0.732218% |
| B | 956 | 267 | 27.928870% |
| C | 956 | 95 | 9.937238% |
| D | 956 | 89 | 9.309623% |
Noise dominated data is calculated using 1-second bins in cleaned event files. If a bin has >2000 counts, and if more than 50% of those come from <1% of pixels, then it is considered to be noise-dominated and hence unusable.
| Quadrant | # 1 sec bins | Bins with >0 counts | Bins with >2000 counts | High rate bins dominated by noise | Noise dominated (total time) | Noise dominated (detector-on time) | Marked lightcurve |
|---|---|---|---|---|---|---|---|
| A | 3081 | 957 | 2 | 2 | 0.06% | 0.21% | 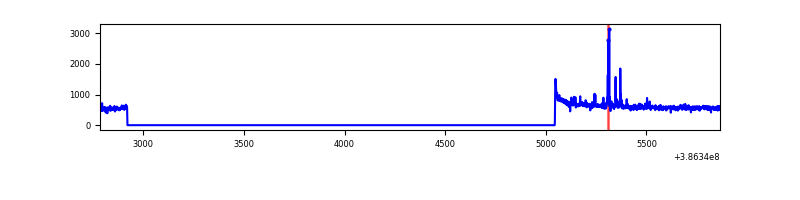 |
| B | 3081 | 957 | 171 | 171 | 5.55% | 17.87% | 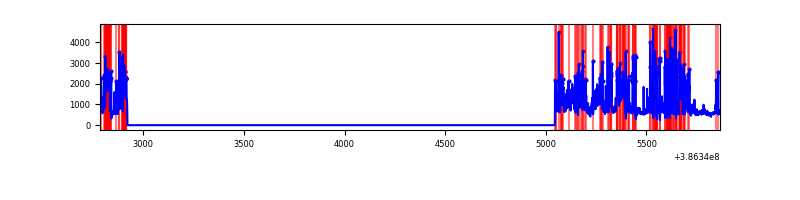 |
| C | 3081 | 957 | 62 | 62 | 2.01% | 6.48% | 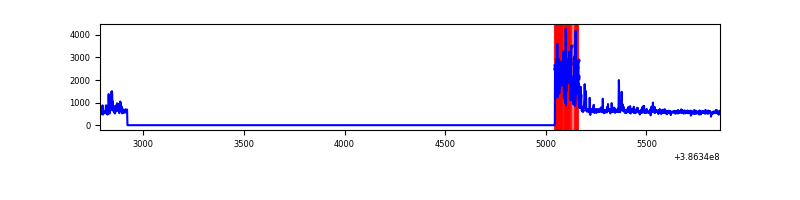 |
| D | 3081 | 957 | 67 | 67 | 2.17% | 7.00% | 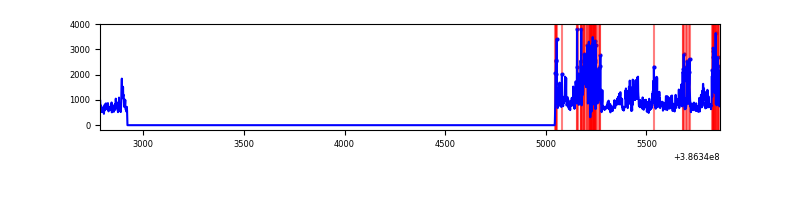 |
Top three noisy pixels from each quadrant. If the there are fewer than three noisy pixels in the level2.evt file, extra rows are filled as -1
| Pixel properties | Quadrant properties | ||||||
|---|---|---|---|---|---|---|---|
| Quadrant | DetID | PixID | Counts | Sigma | Mean | Median | Sigma |
| A | 10 | 83 | 35479 | 1206.03 | 138 | 136 | 29.3 |
| A | 9 | 143 | 24412 | 828.39 | 138 | 136 | 29.3 |
| A | 13 | 6 | 1561 | 48.63 | 138 | 136 | 29.3 |
| B | 5 | 236 | 585898 | 23674.73 | 121 | 119 | 24.7 |
| B | 5 | 172 | 114541 | 4624.46 | 121 | 119 | 24.7 |
| B | 3 | 112 | 6085 | 241.12 | 121 | 119 | 24.7 |
| C | 0 | 10 | 231251 | 7461.28 | 128 | 129 | 31.0 |
| C | 15 | 214 | 42639 | 1372.35 | 128 | 129 | 31.0 |
| C | 0 | 207 | 9481 | 301.91 | 128 | 129 | 31.0 |
| D | 8 | 195 | 224475 | 6705.57 | 131 | 127 | 33.5 |
| D | 2 | 250 | 216346 | 6462.6 | 131 | 127 | 33.5 |
| D | 7 | 80 | 23035 | 684.7 | 131 | 127 | 33.5 |
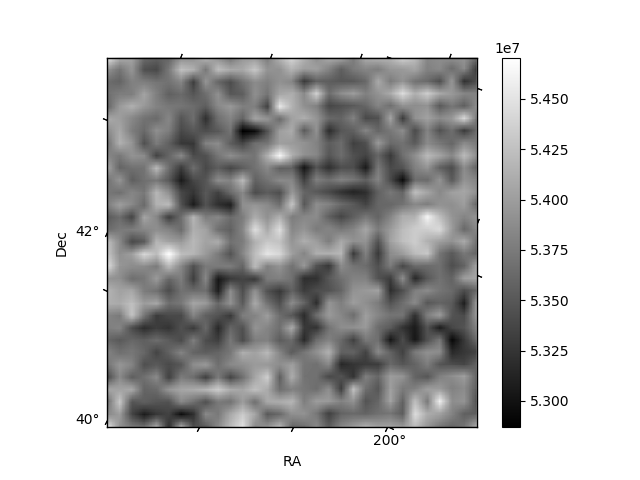
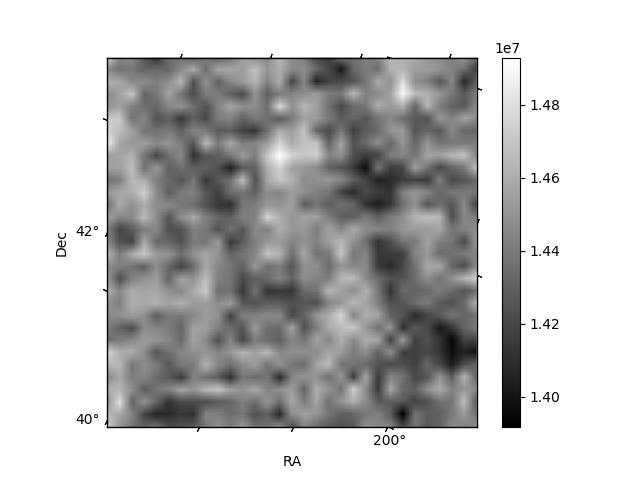
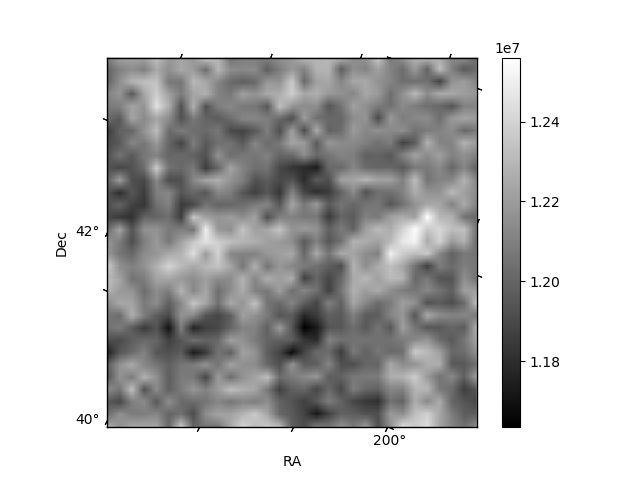
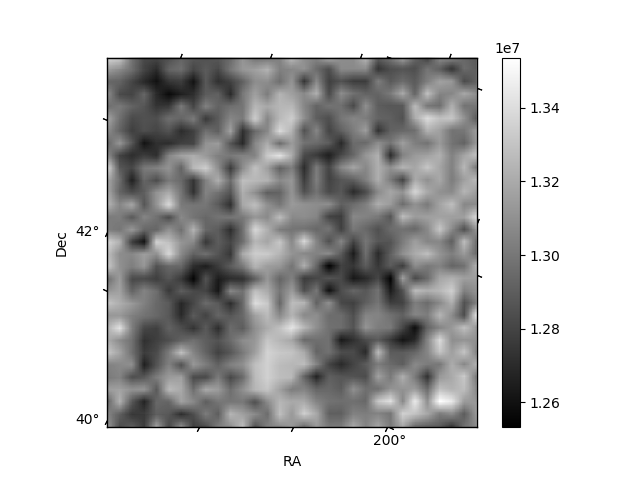
Histogram calculated using DETX and DETY for each event in the final _common_clean file
| Quadrant A | 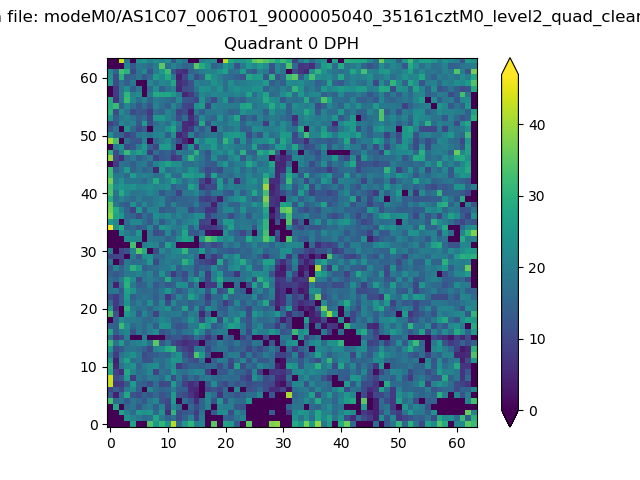 |
 |
Quadrant B |
|---|---|---|---|
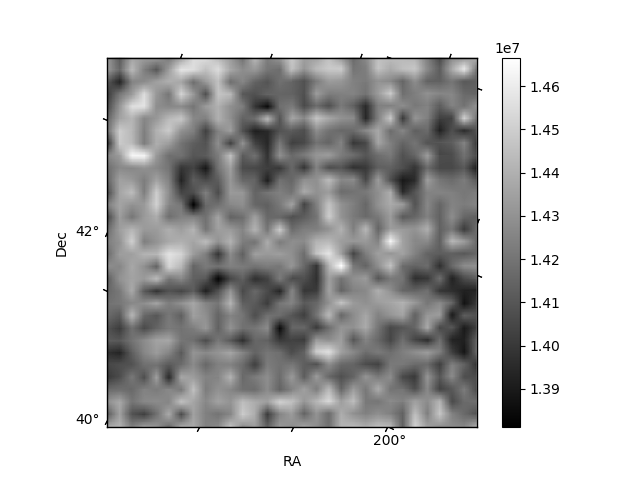
| Quadrant D | 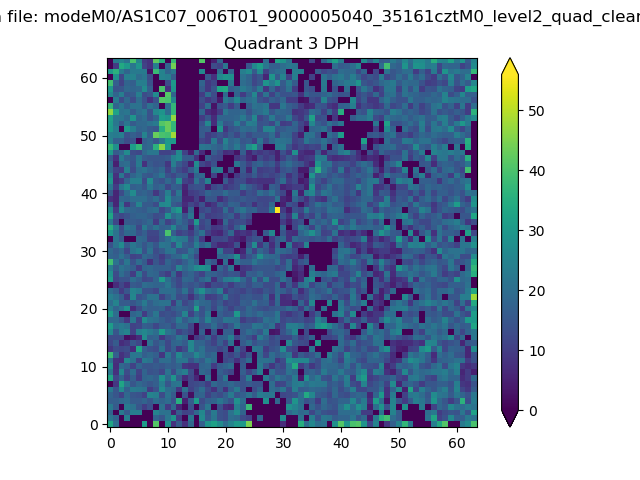 |
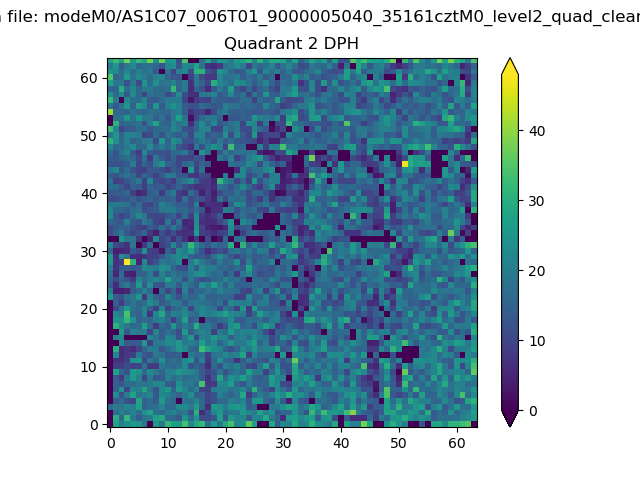 |
Quadrant C |
| Plot type | Count rate plots | Images |
|---|---|---|
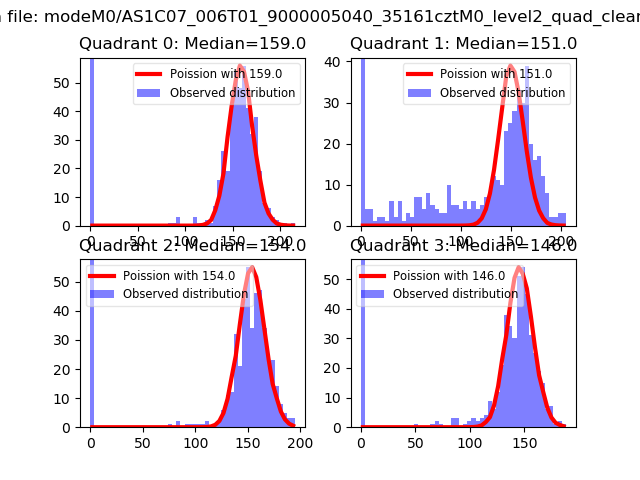
| Comparison with Poisson distribution Blue bars denote a histogram of data divided into 1 sec bins. Red curve is a Poisson curve with rate = median count rate of data. |
 |
 |
| Quadrant-wise count rates Data is divided into 100 sec bins |
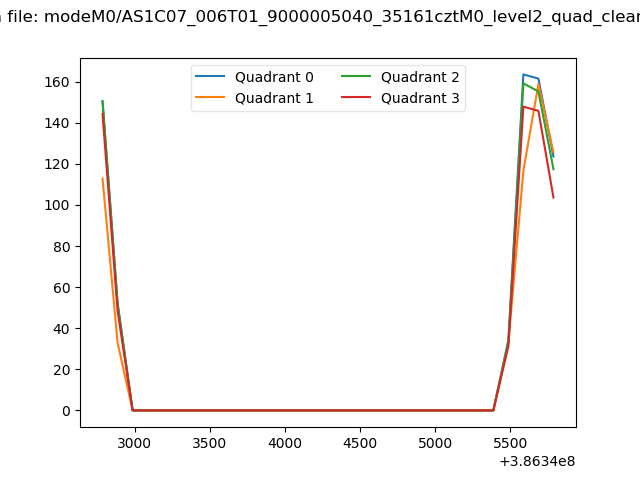 |
|
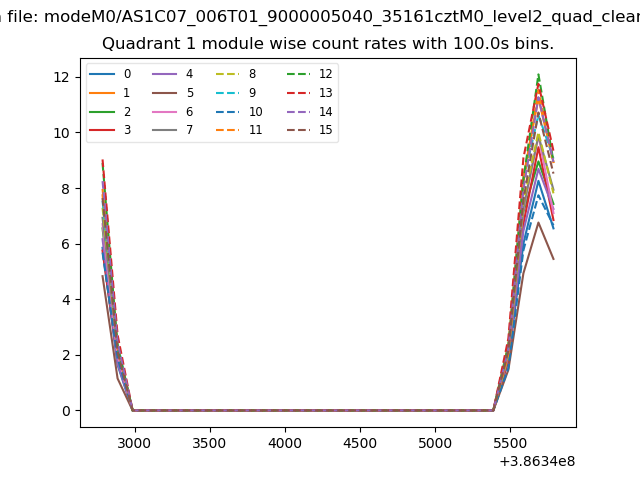
| Module-wise count rates for Quadrant A Data is divided into 100 sec bins |
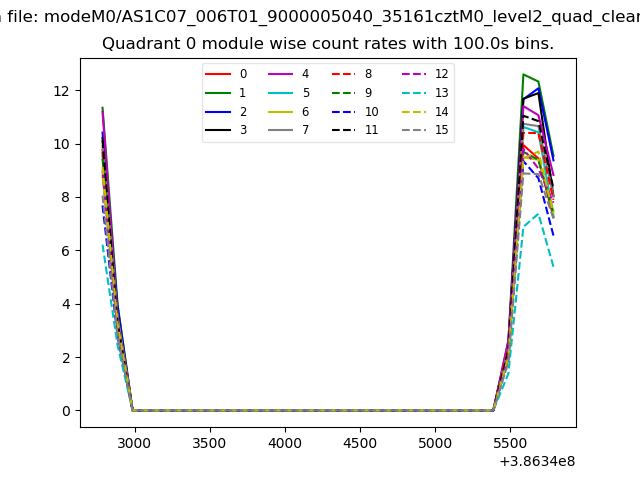 |
 |
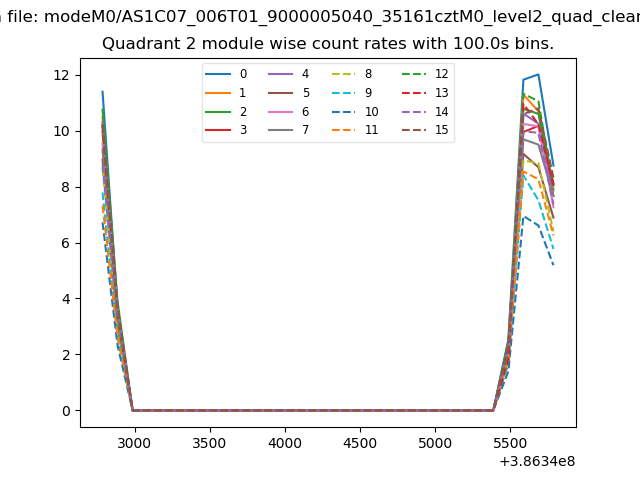
| Module-wise count rates for Quadrant B Data is divided into 100 sec bins |
 |
 |
| Module-wise count rates for Quadrant C Data is divided into 100 sec bins |
 |
 |
| Module-wise count rates for Quadrant D Data is divided into 100 sec bins |
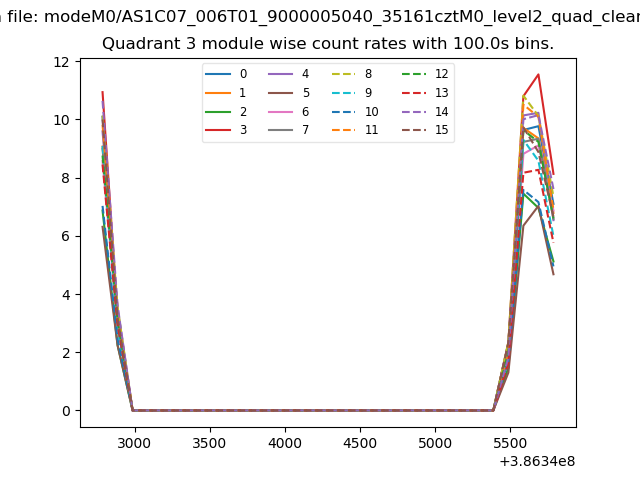 |
 |
| Parameter | Plot |
|---|---|
| CZT HV Monitor | 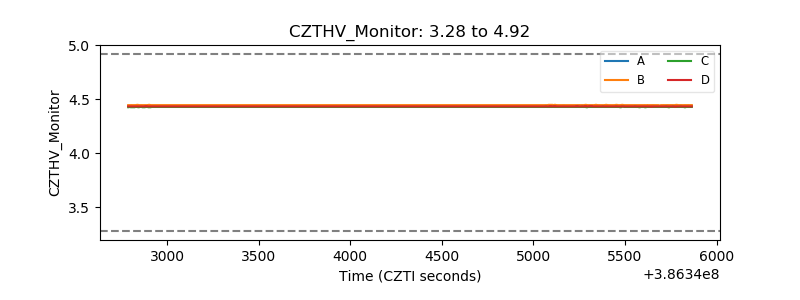 |
| D_VDD | 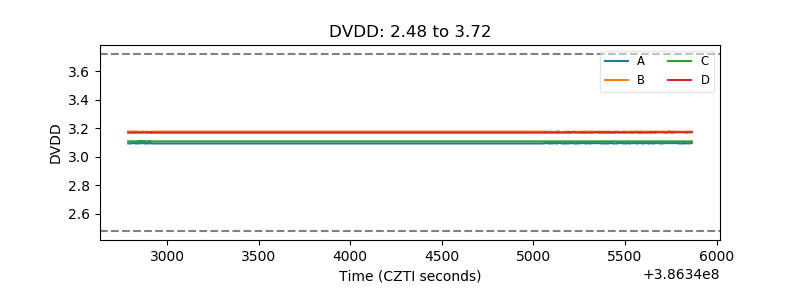 |
| Temperature 1 |  |
| Veto HV Monitor | 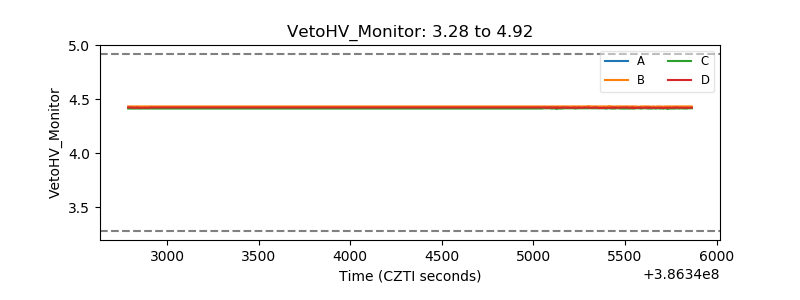 |
| Veto LLD | 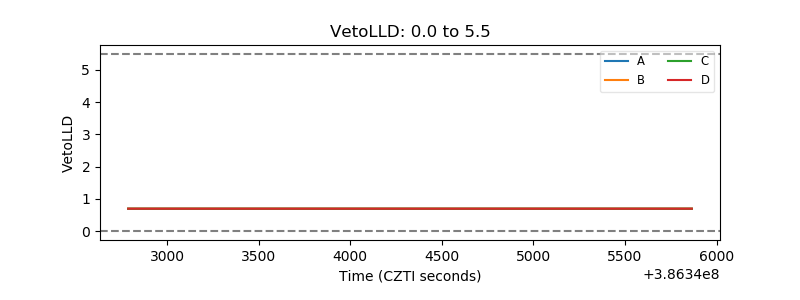 |
| Alpha Counter | 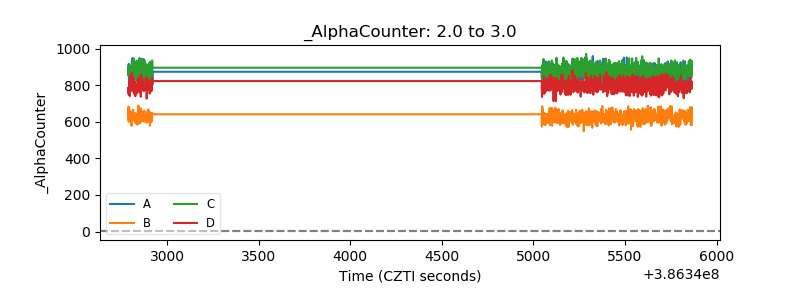 |
| _CPM_Rate | 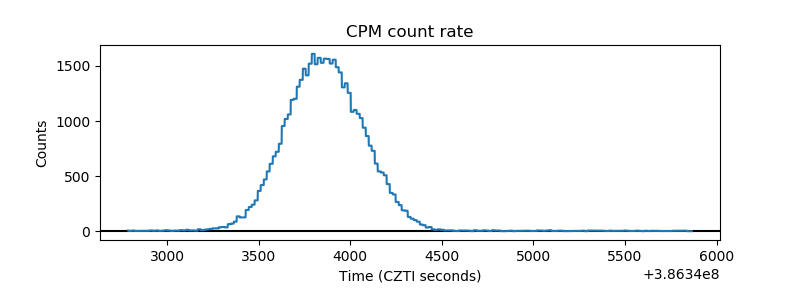 |
| CZT Counter | 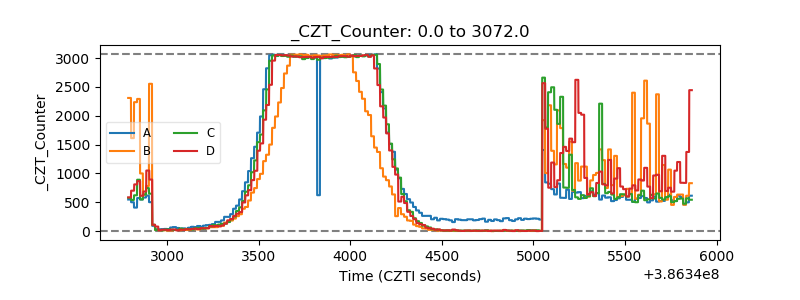 |
| +2.5 Volts monitor | 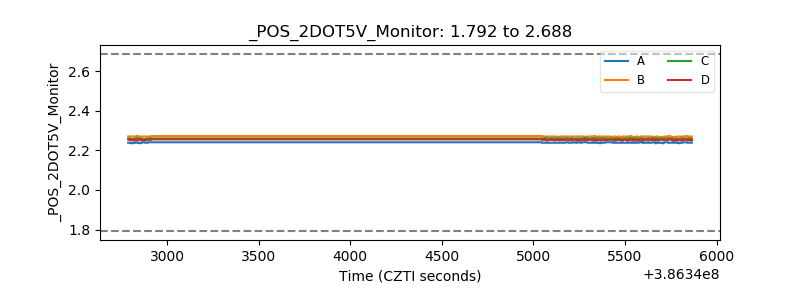 |
| +5 Volts monitor | 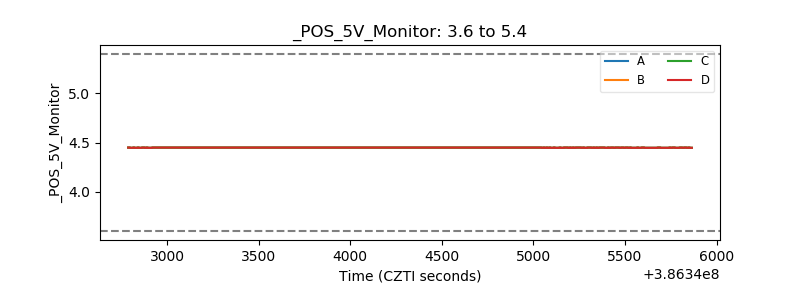 |
| _ROLL_ROT | 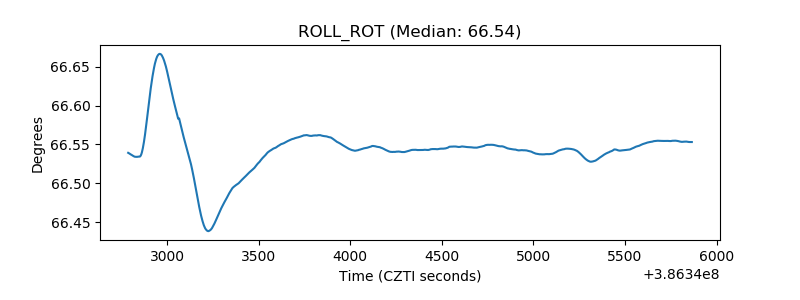 |
| _Roll_DEC | 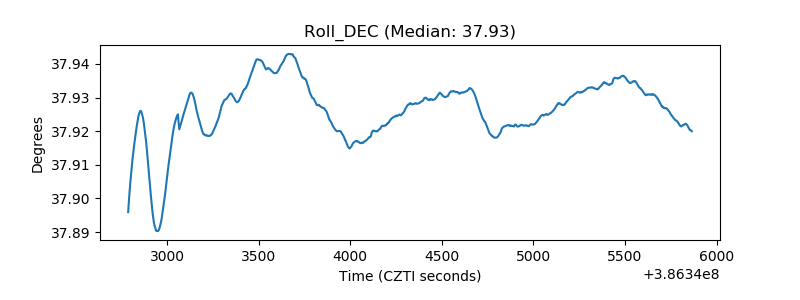 |
| _Roll_RA | 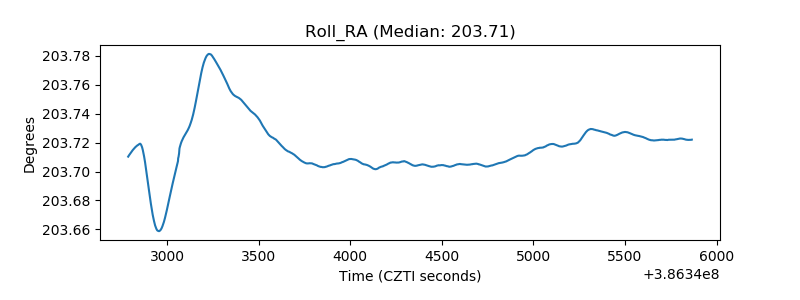 |
| Veto Counter | 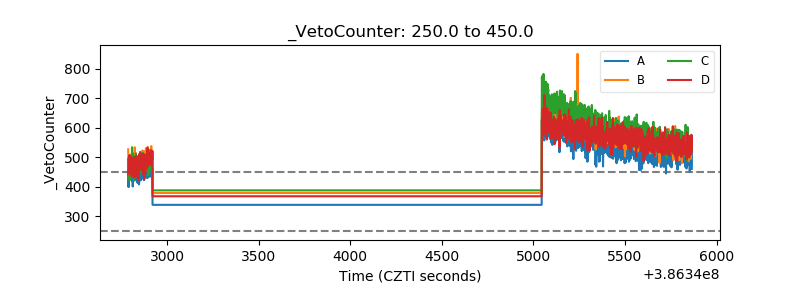 |