| Param | Original file | Final file |
|---|---|---|
| Filename | modeM0/AS1C07_004T01_9000005042_35166cztM0_level2.evt | modeM0/AS1C07_004T01_9000005042_35166cztM0_level2_quad_clean.evt |
| Size (bytes) | 725,420,160 | 72,351,360 |
| Size | 691.8 MB | 69.0 MB |
| Events in quadrant A | 2,968,409 | 476,104 |
| Events in quadrant B | 7,343,949 | 409,785 |
| Events in quadrant C | 3,344,072 | 474,442 |
| Events in quadrant D | 7,900,502 | 402,680 |
| Mode M9 | |||
|---|---|---|---|
| Quadrant | BADHDUFLAG | Total packets | Discarded packets |
| A | 0 | 27 | 0 |
| B | 0 | 27 | 0 |
| C | 0 | 27 | 0 |
| D | 0 | 27 | 0 |
| Mode M0 | |||
|---|---|---|---|
| Quadrant | BADHDUFLAG | Total packets | Discarded packets |
| A | 0 | 12756 | 3 |
| B | 0 | 25996 | 2 |
| C | 0 | 13540 | 2 |
| D | 0 | 27832 | 2 |
| Mode SS | |||
|---|---|---|---|
| Quadrant | BADHDUFLAG | Total packets | Discarded packets |
| A | 0 | 124 | 0 |
| B | 0 | 124 | 0 |
| C | 0 | 124 | 0 |
| D | 0 | 124 | 0 |
| Quadrant | Total seconds | Saturated seconds | Saturation percentage |
|---|---|---|---|
| A | 6112 | 11 | 0.179974% |
| B | 6112 | 1706 | 27.912304% |
| C | 6112 | 66 | 1.079843% |
| D | 6112 | 1066 | 17.441099% |
Noise dominated data is calculated using 1-second bins in cleaned event files. If a bin has >2000 counts, and if more than 50% of those come from <1% of pixels, then it is considered to be noise-dominated and hence unusable.
| Quadrant | # 1 sec bins | Bins with >0 counts | Bins with >2000 counts | High rate bins dominated by noise | Noise dominated (total time) | Noise dominated (detector-on time) | Marked lightcurve |
|---|---|---|---|---|---|---|---|
| A | 8828 | 6114 | 2 | 2 | 0.02% | 0.03% | 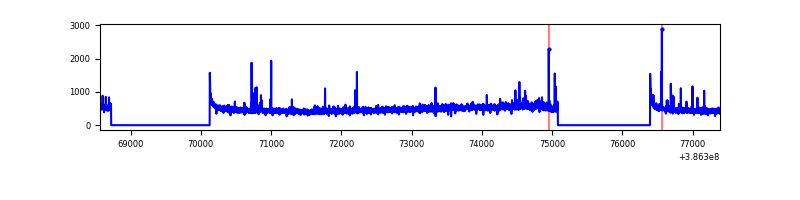 |
| B | 8828 | 6114 | 1086 | 1086 | 12.30% | 17.76% | 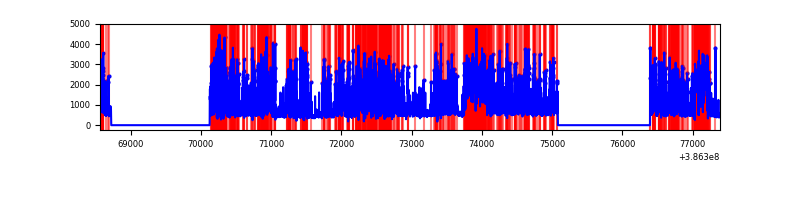 |
| C | 8828 | 6114 | 53 | 53 | 0.60% | 0.87% | 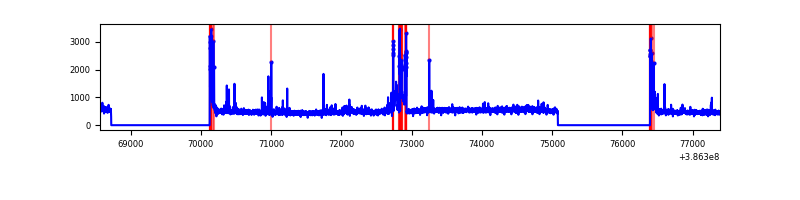 |
| D | 8828 | 6114 | 977 | 977 | 11.07% | 15.98% | 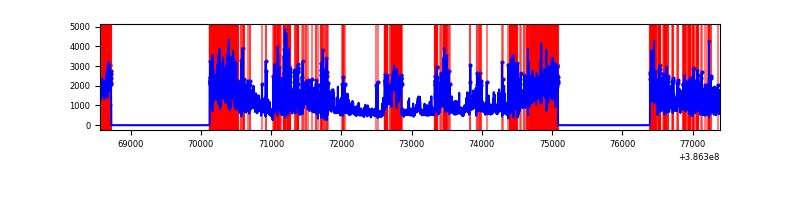 |
Top three noisy pixels from each quadrant. If the there are fewer than three noisy pixels in the level2.evt file, extra rows are filled as -1
| Pixel properties | Quadrant properties | ||||||
|---|---|---|---|---|---|---|---|
| Quadrant | DetID | PixID | Counts | Sigma | Mean | Median | Sigma |
| A | 10 | 83 | 99575 | 679.58 | 716 | 702 | 145.5 |
| A | 9 | 143 | 62048 | 421.65 | 716 | 702 | 145.5 |
| A | 13 | 6 | 18952 | 125.44 | 716 | 702 | 145.5 |
| B | 5 | 236 | 3597991 | 29661.47 | 626 | 609 | 121.3 |
| B | 5 | 172 | 427433 | 3519.29 | 626 | 609 | 121.3 |
| B | 5 | 200 | 352299 | 2899.79 | 626 | 609 | 121.3 |
| C | 15 | 214 | 253493 | 1557.02 | 692 | 696 | 162.4 |
| C | 0 | 207 | 225069 | 1381.96 | 692 | 696 | 162.4 |
| C | 0 | 10 | 140341 | 860.1 | 692 | 696 | 162.4 |
| D | 8 | 195 | 2786886 | 17320.08 | 654 | 636 | 160.9 |
| D | 5 | 223 | 719205 | 4466.82 | 654 | 636 | 160.9 |
| D | 7 | 80 | 495736 | 3077.68 | 654 | 636 | 160.9 |
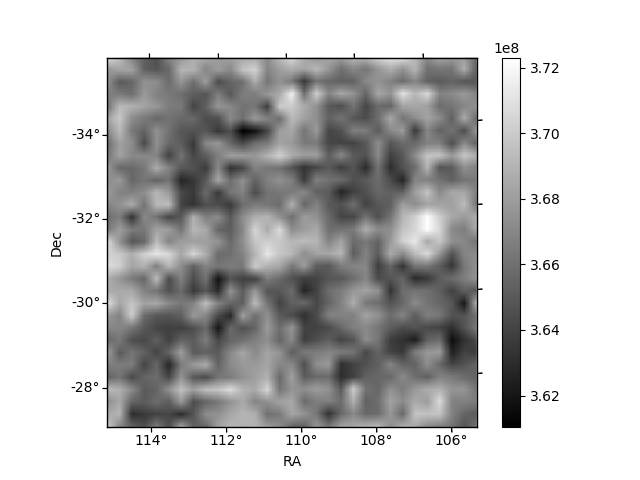
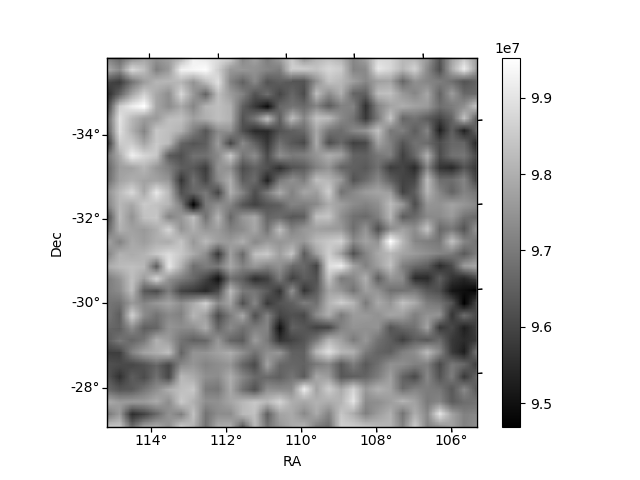
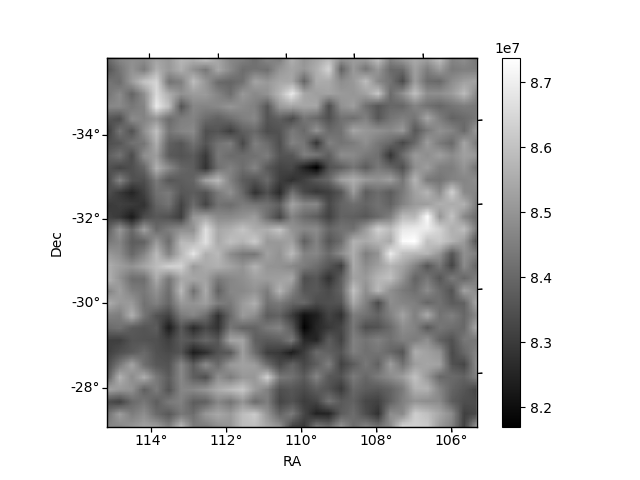
Histogram calculated using DETX and DETY for each event in the final _common_clean file
| Quadrant A | 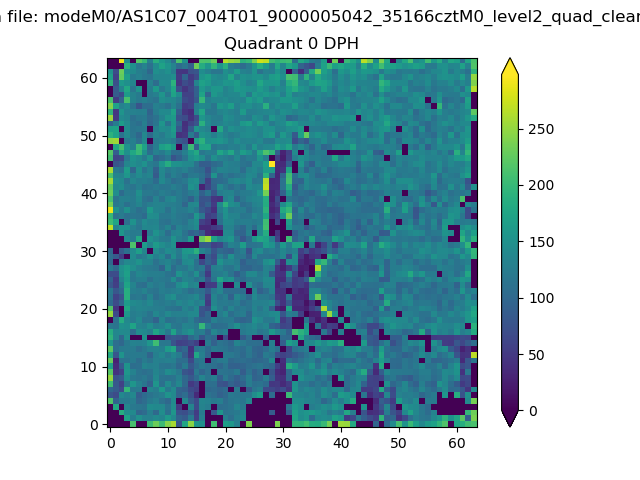 |
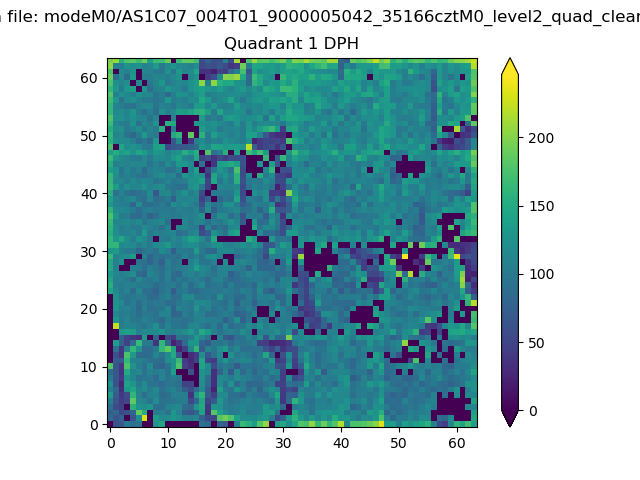 |
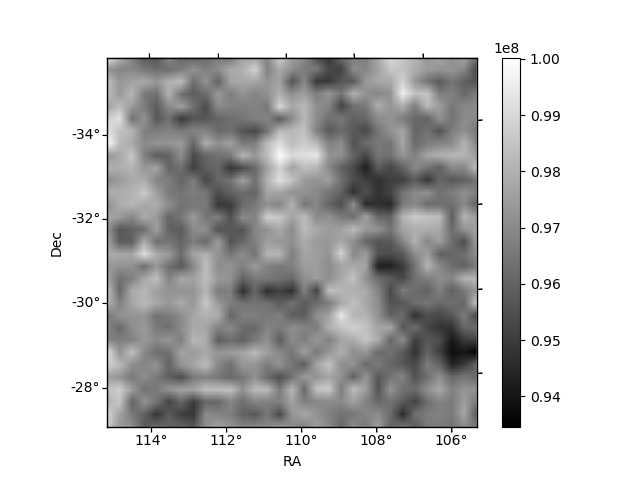
Quadrant B |
|---|---|---|---|
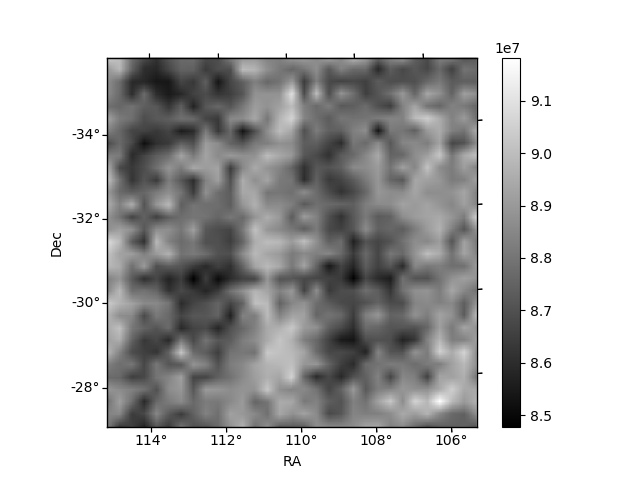
| Quadrant D | 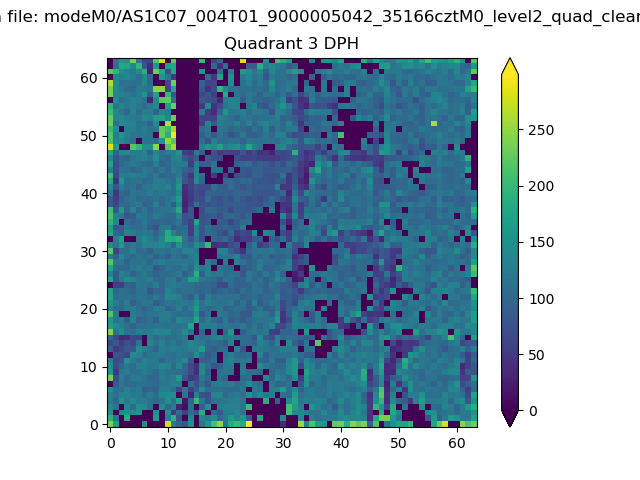 |
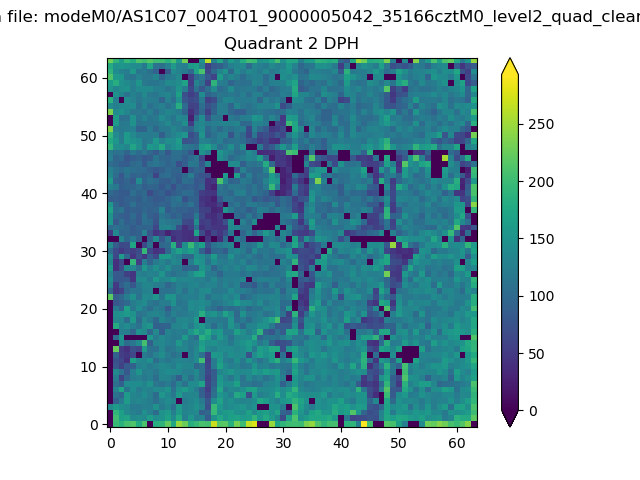 |
Quadrant C |
| Plot type | Count rate plots | Images |
|---|---|---|
| Comparison with Poisson distribution Blue bars denote a histogram of data divided into 1 sec bins. Red curve is a Poisson curve with rate = median count rate of data. |
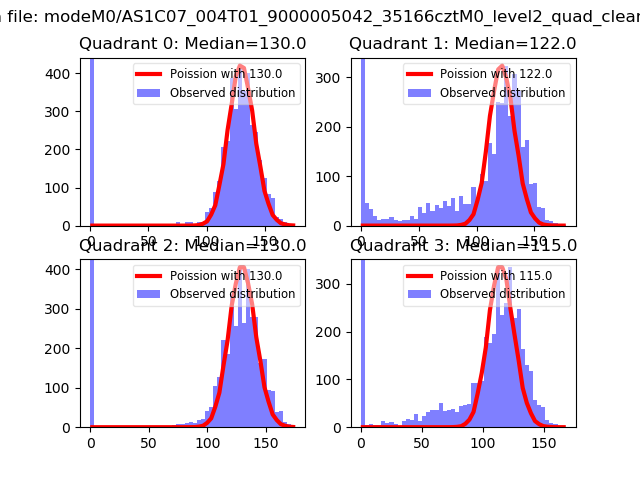 |
 |
| Quadrant-wise count rates Data is divided into 100 sec bins |
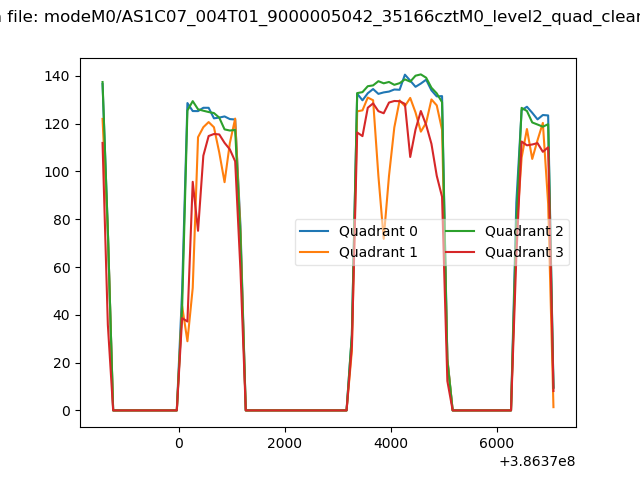 |
|
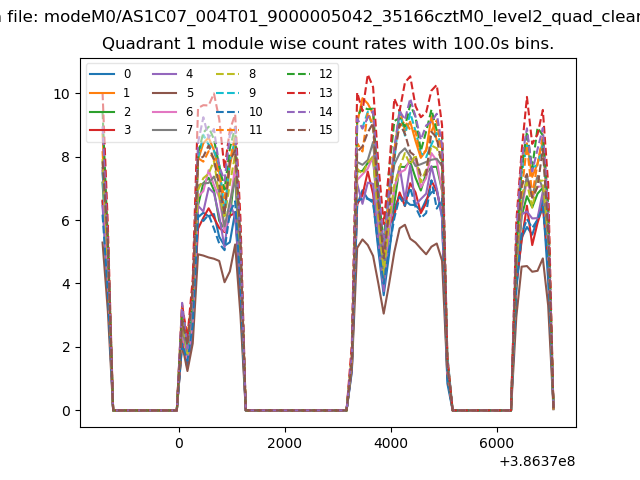
| Module-wise count rates for Quadrant A Data is divided into 100 sec bins |
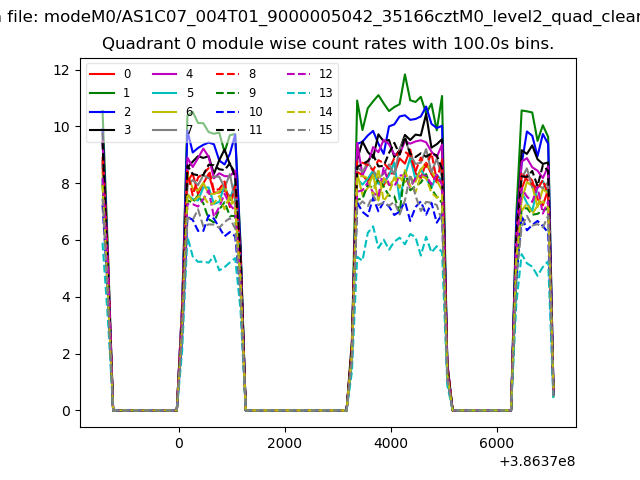 |
 |
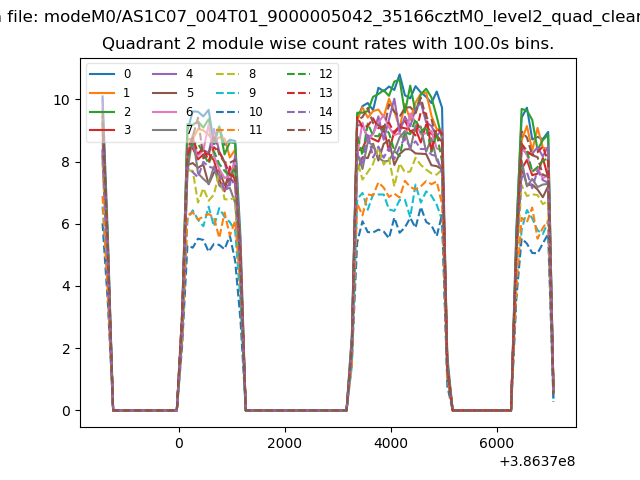
| Module-wise count rates for Quadrant B Data is divided into 100 sec bins |
 |
 |
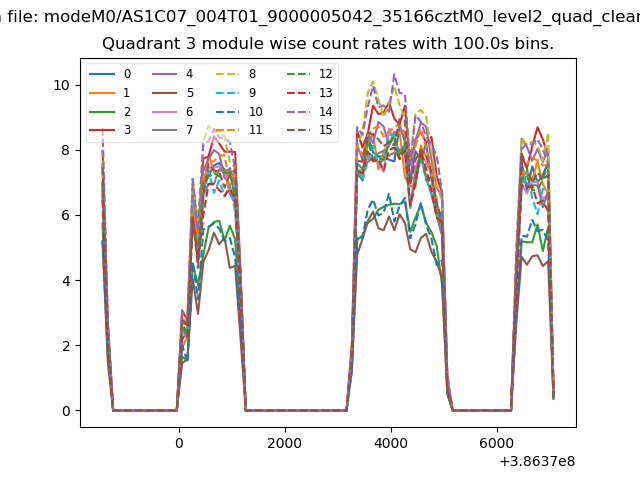
| Module-wise count rates for Quadrant C Data is divided into 100 sec bins |
 |
 |
| Module-wise count rates for Quadrant D Data is divided into 100 sec bins |
 |
 |
| Parameter | Plot |
|---|---|
| CZT HV Monitor | 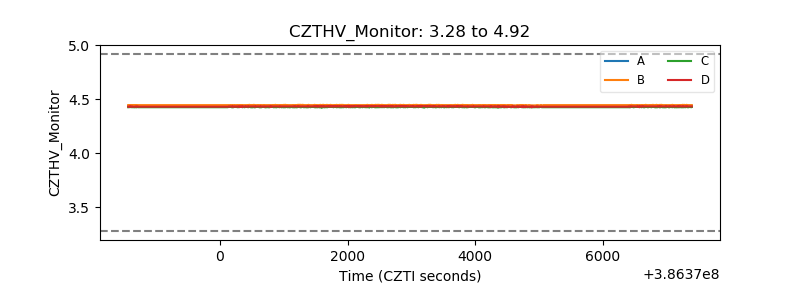 |
| D_VDD | 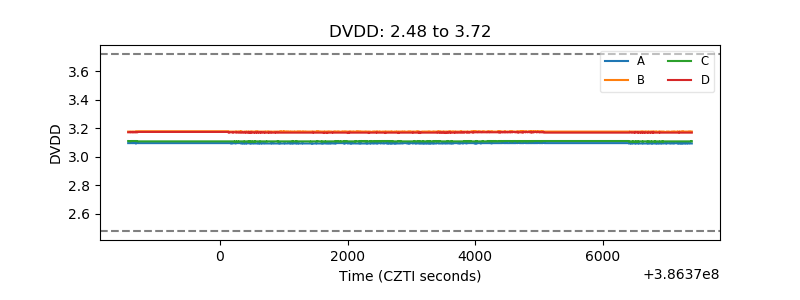 |
| Temperature 1 | 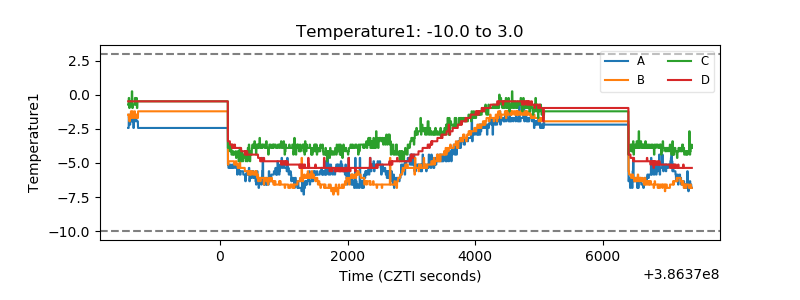 |
| Veto HV Monitor | 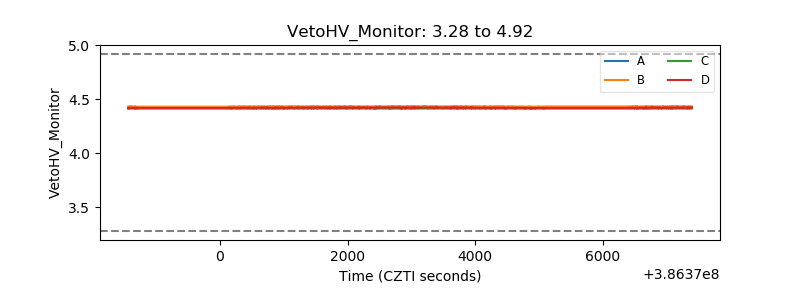 |
| Veto LLD | 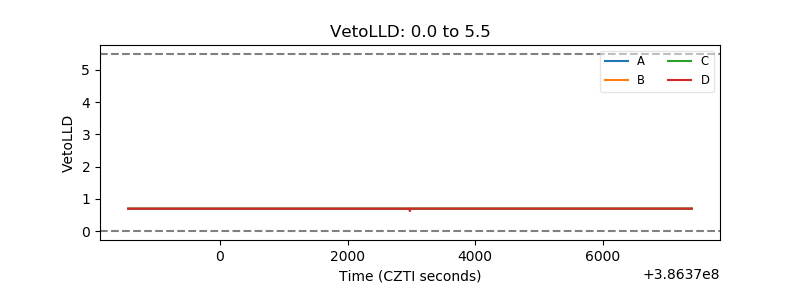 |
| Alpha Counter | 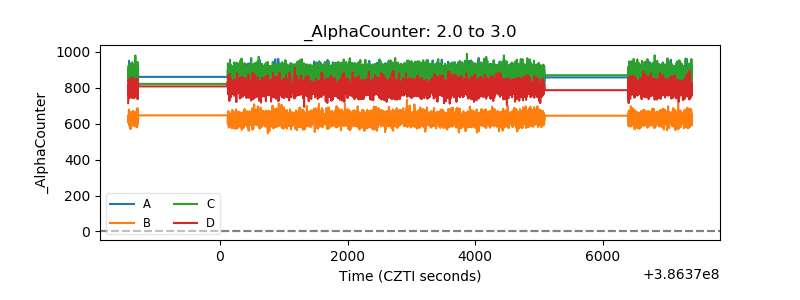 |
| _CPM_Rate | 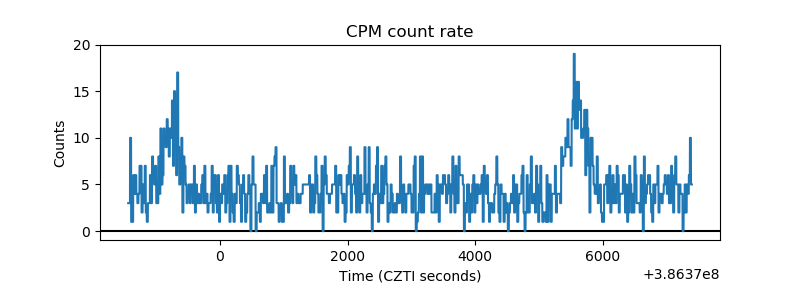 |
| CZT Counter | 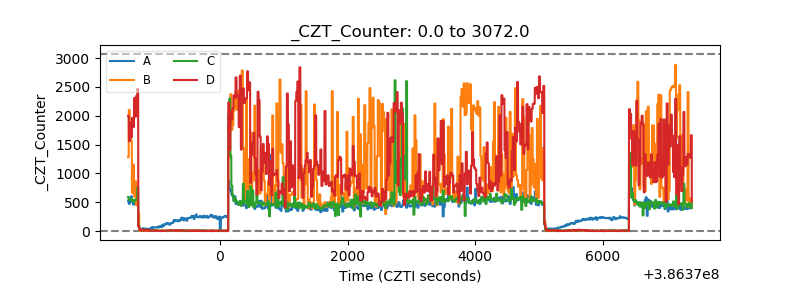 |
| +2.5 Volts monitor | 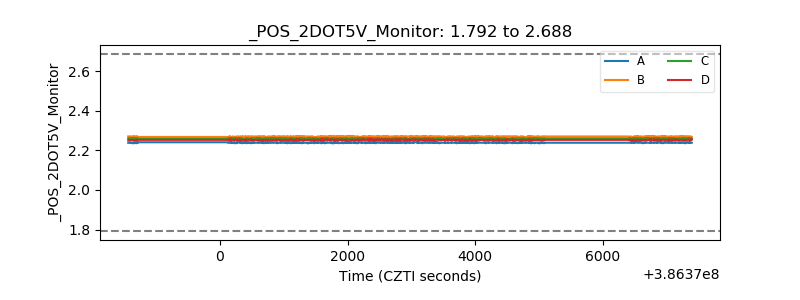 |
| +5 Volts monitor | 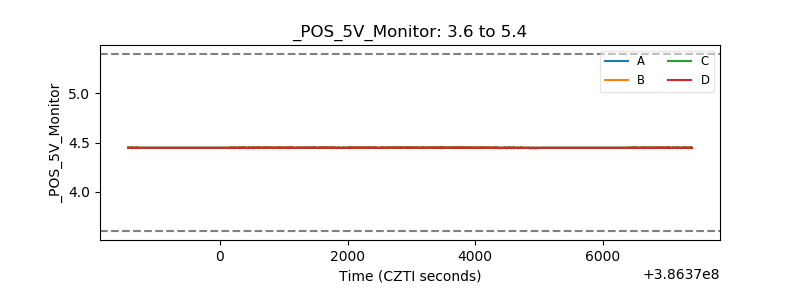 |
| _ROLL_ROT | 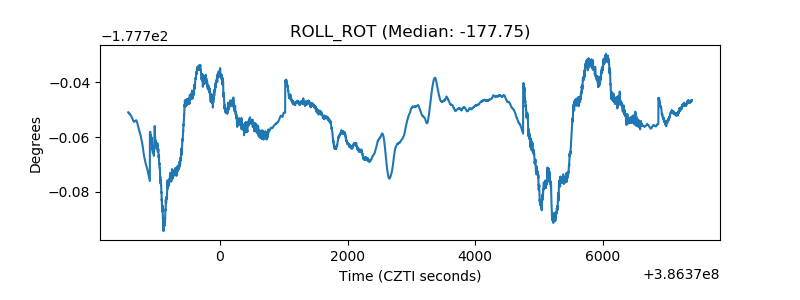 |
| _Roll_DEC | 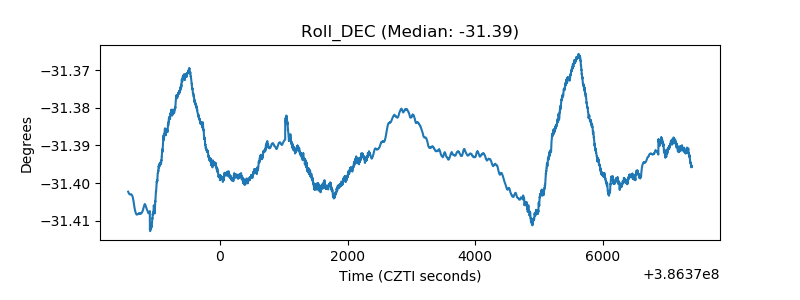 |
| _Roll_RA | 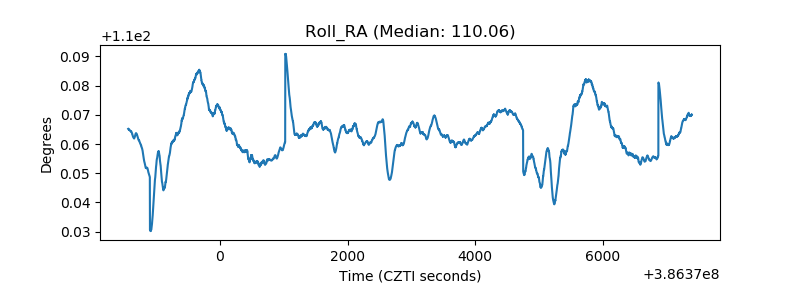 |
| Veto Counter | 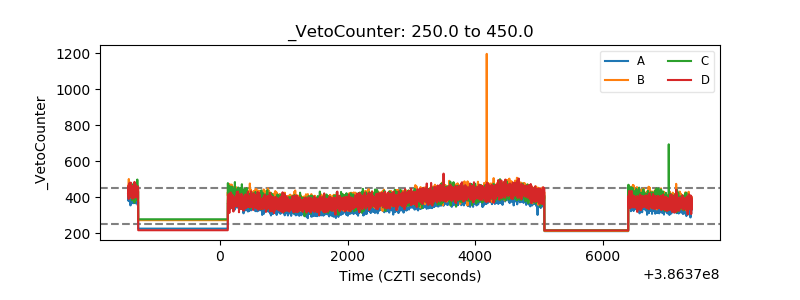 |