| Param | Original file | Final file |
|---|---|---|
| Filename | modeM0/AS1C07_004T01_9000005042cztM0_level2_bc.evt | modeM0/AS1C07_004T01_9000005042cztM0_level2_quad_clean.evt |
| Size (bytes) | 1,334,445,120 | 225,708,480 |
| Size | 1.2 GB | 215.3 MB |
| Events in quadrant A | 4,841,726 | 1,469,243 |
| Events in quadrant B | 12,267,273 | 1,319,648 |
| Events in quadrant C | 5,490,919 | 1,461,620 |
| Events in quadrant D | 16,471,549 | 1,227,056 |
| Mode M9 | |||
|---|---|---|---|
| Quadrant | BADHDUFLAG | Total packets | Discarded packets |
| A | 0 | 66 | 0 |
| B | 0 | 66 | 0 |
| C | 0 | 66 | 0 |
| D | 0 | 66 | 0 |
| Mode M0 | |||
|---|---|---|---|
| Quadrant | BADHDUFLAG | Total packets | Discarded packets |
| A | 0 | 42196 | 0 |
| B | 0 | 78793 | 0 |
| C | 0 | 43263 | 0 |
| D | 0 | 85724 | 0 |
| Mode SS | |||
|---|---|---|---|
| Quadrant | BADHDUFLAG | Total packets | Discarded packets |
| A | 0 | 400 | 0 |
| B | 0 | 400 | 0 |
| C | 0 | 400 | 0 |
| D | 0 | 400 | 0 |
| Quadrant | Total seconds | Saturated seconds | Saturation percentage |
|---|---|---|---|
| A | 19683 | 97 | 0.492811% |
| B | 19683 | 4279 | 21.739572% |
| C | 19683 | 228 | 1.158360% |
| D | 19683 | 3401 | 17.278870% |
Noise dominated data is calculated using 1-second bins in cleaned event files. If a bin has >2000 counts, and if more than 50% of those come from <1% of pixels, then it is considered to be noise-dominated and hence unusable.
| Quadrant | # 1 sec bins | Bins with >0 counts | Bins with >2000 counts | High rate bins dominated by noise | Noise dominated (total time) | Noise dominated (detector-on time) | Marked lightcurve |
|---|---|---|---|---|---|---|---|
| A | 26075 | 19686 | 4 | 4 | 0.02% | 0.02% | 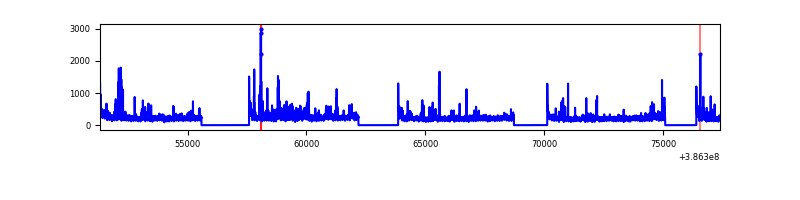 |
| B | 26075 | 19679 | 289 | 289 | 1.11% | 1.47% | 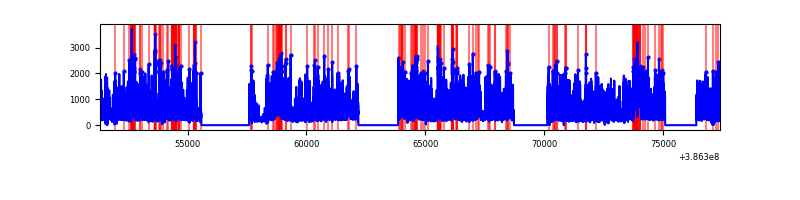 |
| C | 26075 | 19682 | 53 | 53 | 0.20% | 0.27% | 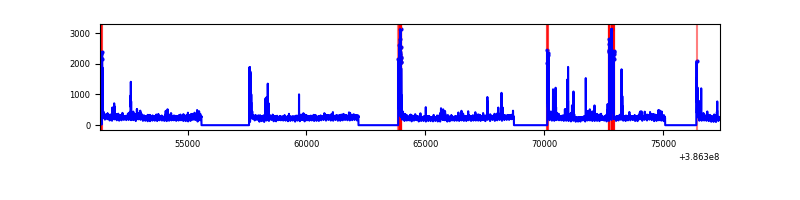 |
| D | 26075 | 19681 | 546 | 546 | 2.09% | 2.77% | 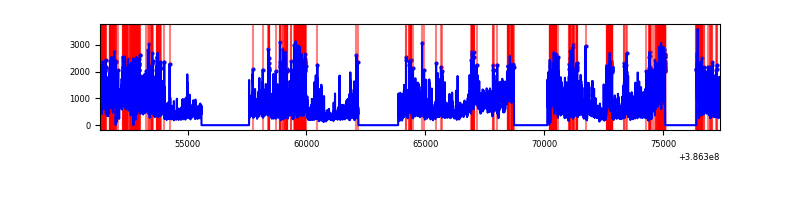 |
Top three noisy pixels from each quadrant. If the there are fewer than three noisy pixels in the level2.evt file, extra rows are filled as -1
| Pixel properties | Quadrant properties | ||||||
|---|---|---|---|---|---|---|---|
| Quadrant | DetID | PixID | Counts | Sigma | Mean | Median | Sigma |
| A | 15 | 169 | 346508 | 1513.45 | 1030 | 1016 | 228.3 |
| A | 10 | 83 | 265615 | 1159.1 | 1030 | 1016 | 228.3 |
| A | 9 | 143 | 149746 | 651.52 | 1030 | 1016 | 228.3 |
| B | 5 | 236 | 6107443 | 32336.15 | 940 | 920 | 188.8 |
| B | 5 | 172 | 1154833 | 6110.37 | 940 | 920 | 188.8 |
| B | 0 | 182 | 712054 | 3765.7 | 940 | 920 | 188.8 |
| C | 15 | 214 | 768855 | 3367.76 | 1000 | 991 | 228.0 |
| C | 0 | 10 | 469103 | 2053.08 | 1000 | 991 | 228.0 |
| C | 0 | 207 | 242305 | 1058.37 | 1000 | 991 | 228.0 |
| D | 8 | 195 | 5074530 | 22632.88 | 936 | 907 | 224.2 |
| D | 5 | 223 | 3508226 | 15645.77 | 936 | 907 | 224.2 |
| D | 7 | 80 | 1911505 | 8522.97 | 936 | 907 | 224.2 |
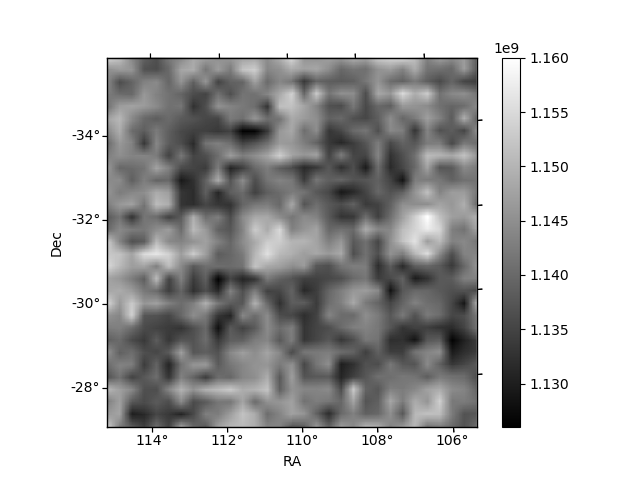
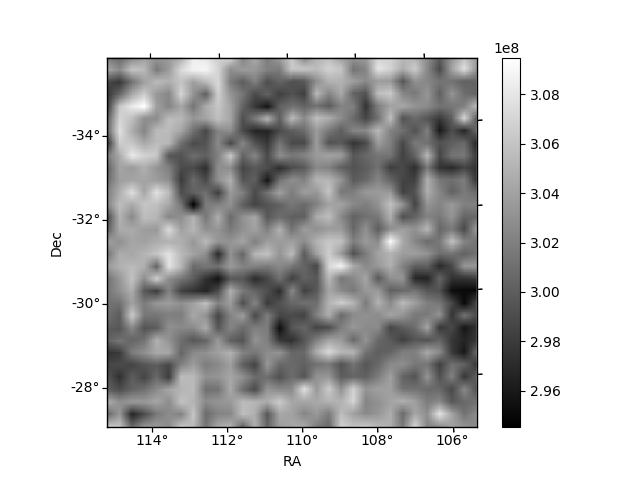
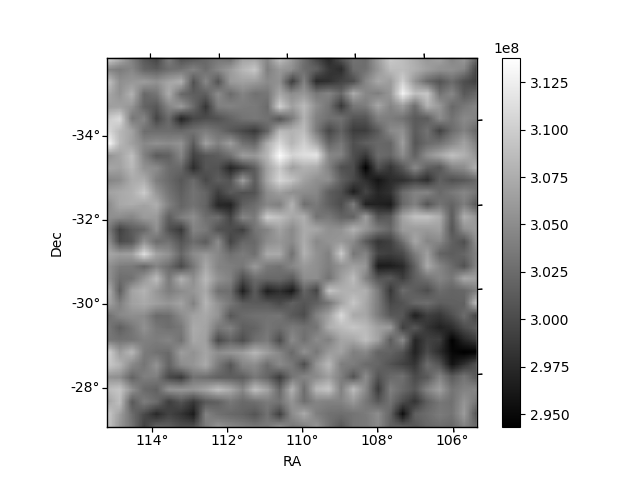
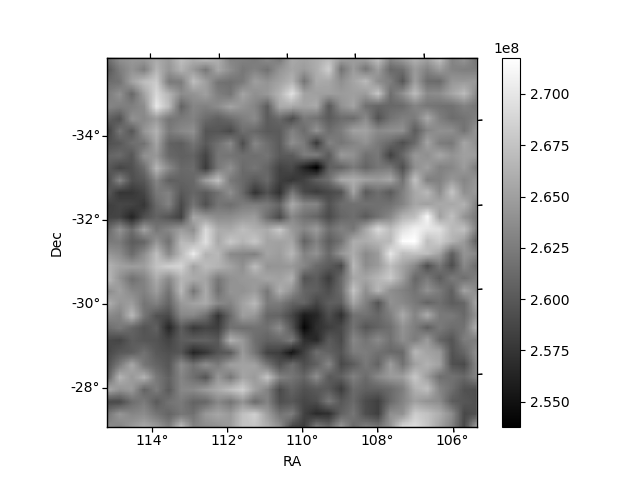
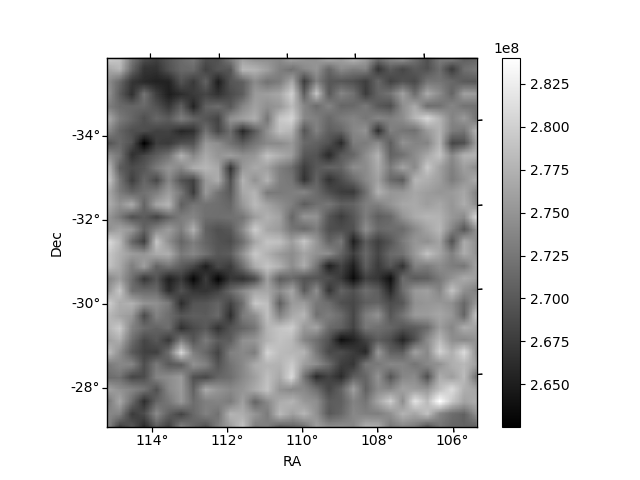
Histogram calculated using DETX and DETY for each event in the final _common_clean file
| Quadrant A | 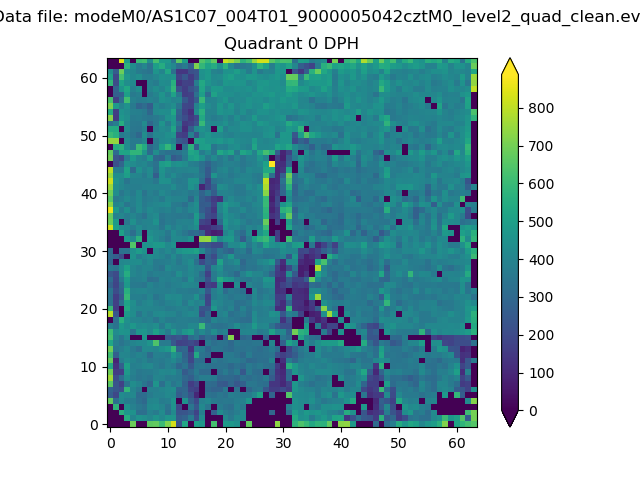 |
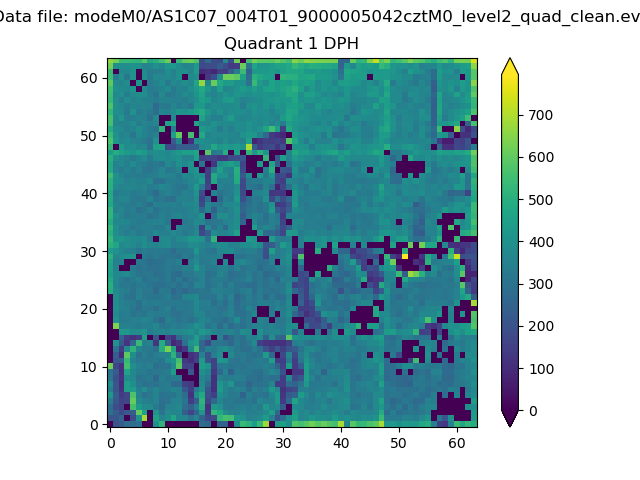 |
Quadrant B |
|---|---|---|---|
| Quadrant D | 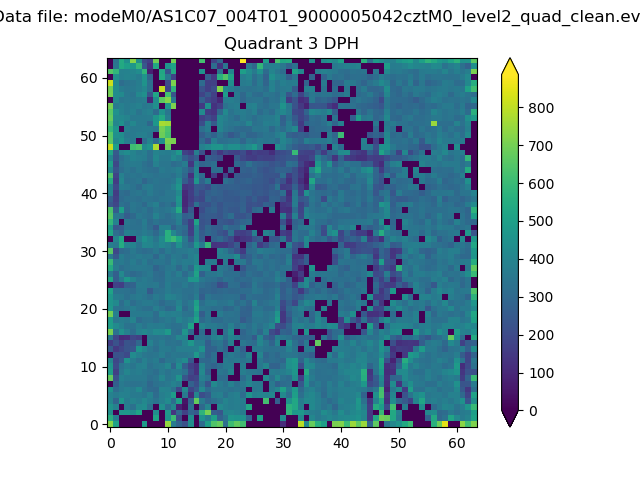 |
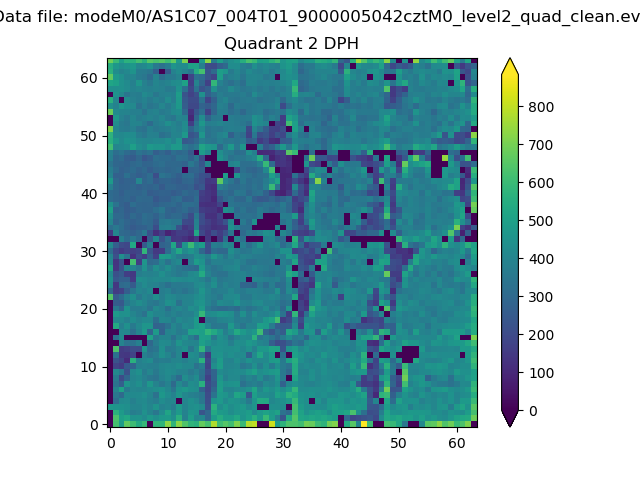 |
Quadrant C |
| Plot type | Count rate plots | Images |
|---|---|---|
| Comparison with Poisson distribution Blue bars denote a histogram of data divided into 1 sec bins. Red curve is a Poisson curve with rate = median count rate of data. |
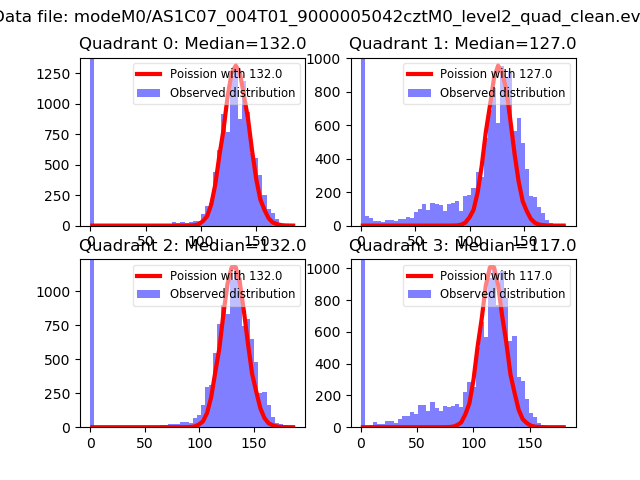 |
 |
| Quadrant-wise count rates Data is divided into 100 sec bins |
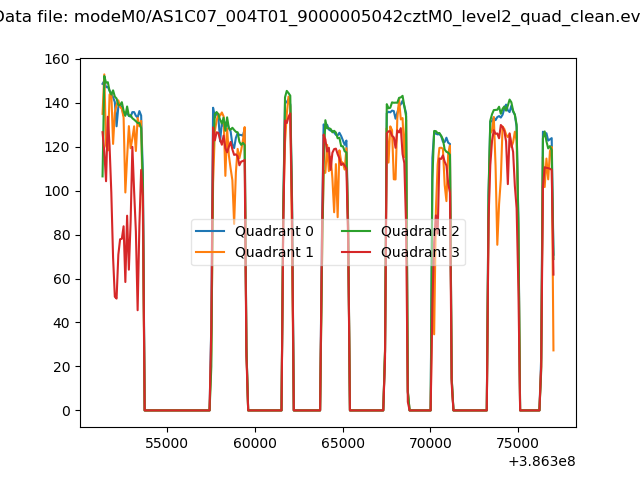 |
|
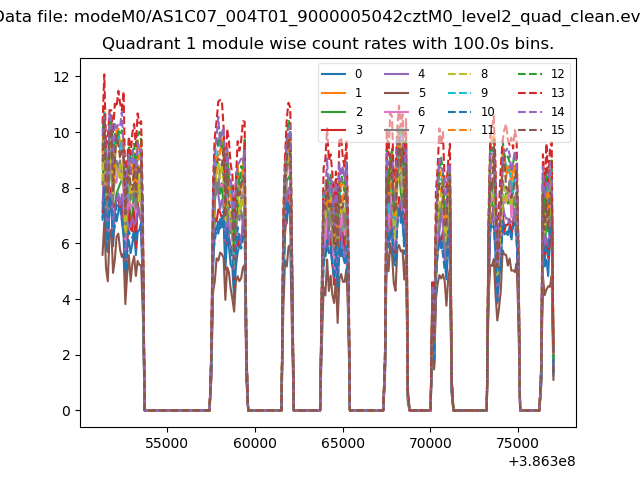
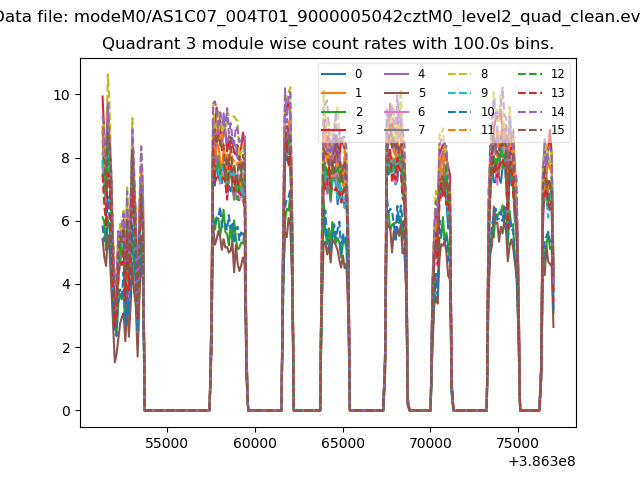
| Module-wise count rates for Quadrant A Data is divided into 100 sec bins |
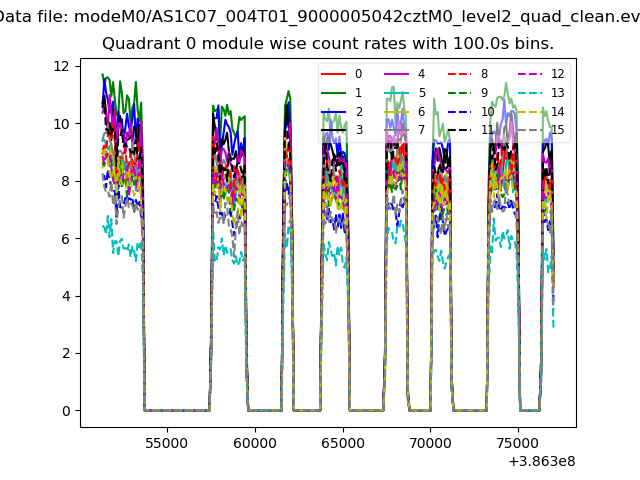 |
 |
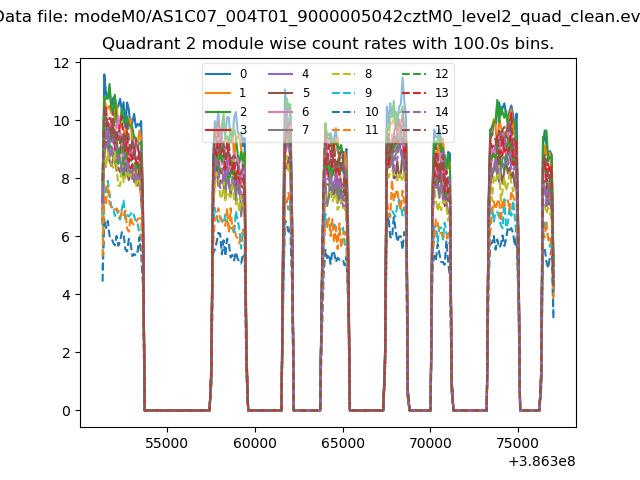
| Module-wise count rates for Quadrant B Data is divided into 100 sec bins |
 |
 |
| Module-wise count rates for Quadrant C Data is divided into 100 sec bins |
 |
 |
| Module-wise count rates for Quadrant D Data is divided into 100 sec bins |
 |
 |
| Parameter | Plot |
|---|---|
| CZT HV Monitor | 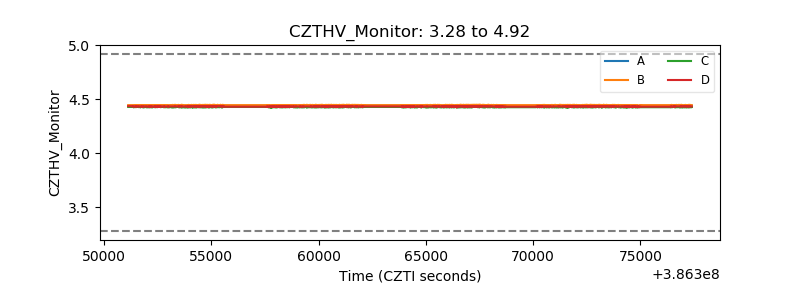 |
| D_VDD | 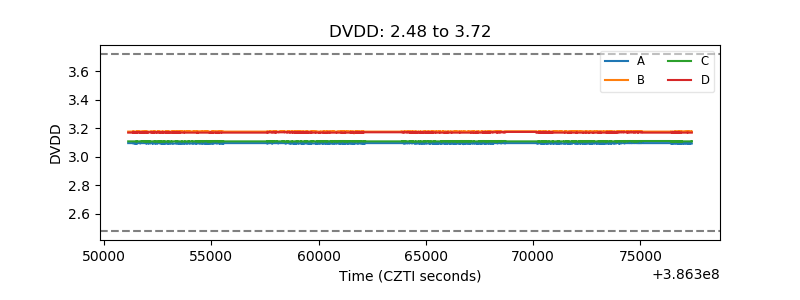 |
| Temperature 1 | 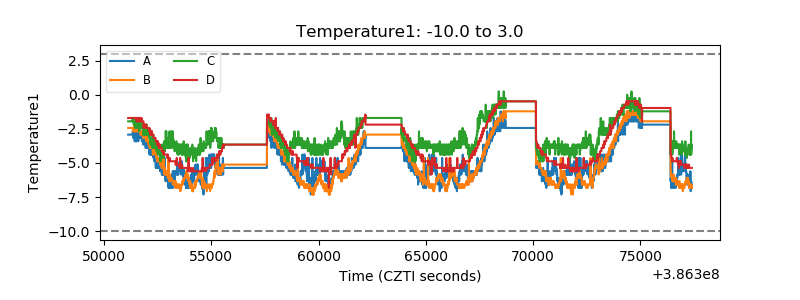 |
| Veto HV Monitor | 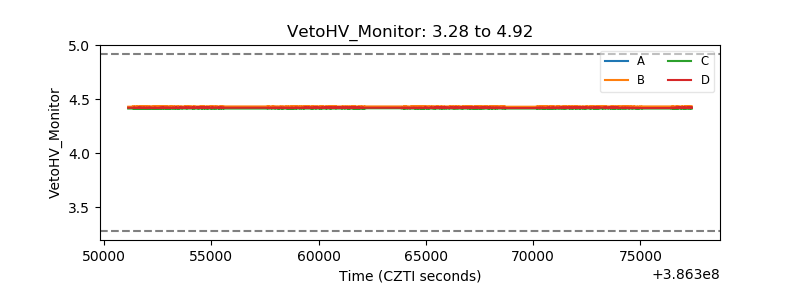 |
| Veto LLD | 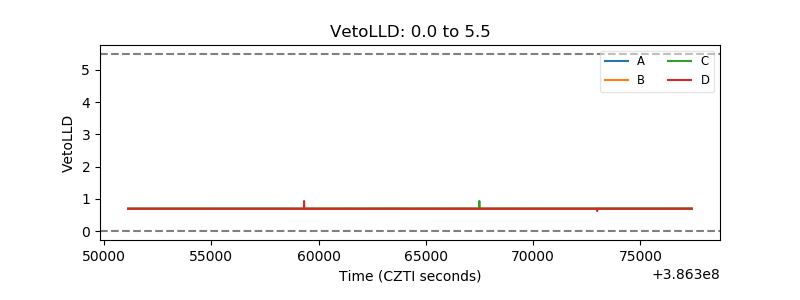 |
| Alpha Counter | 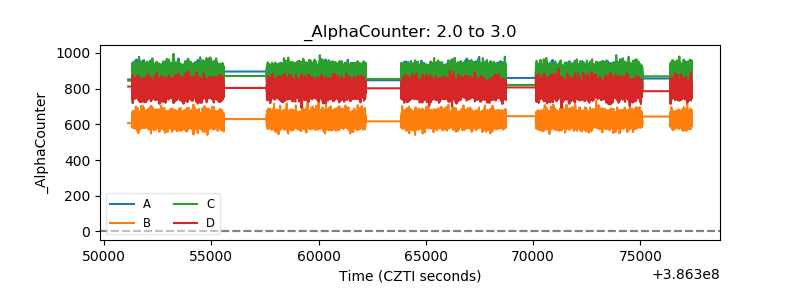 |
| _CPM_Rate | 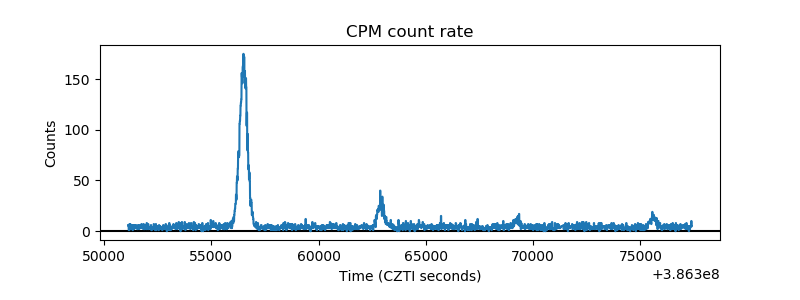 |
| CZT Counter | 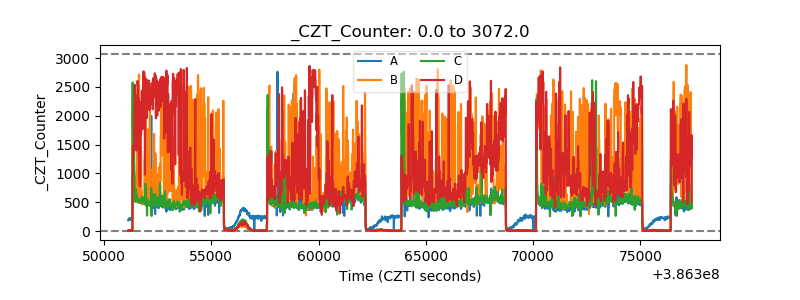 |
| +2.5 Volts monitor | 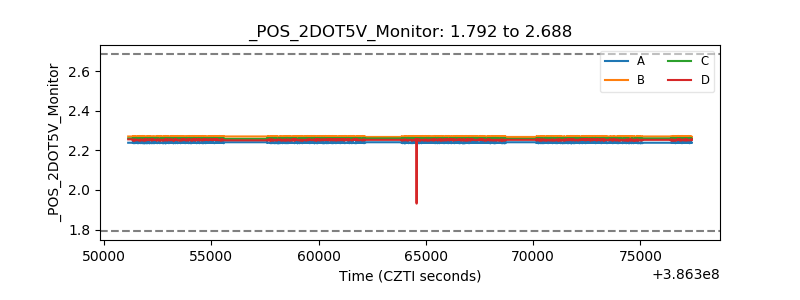 |
| +5 Volts monitor |  |
| _ROLL_ROT | 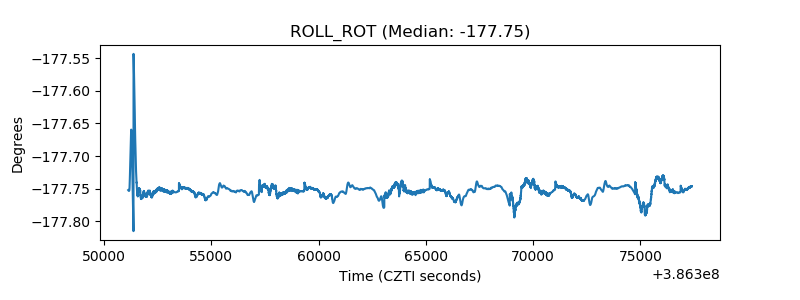 |
| _Roll_DEC | 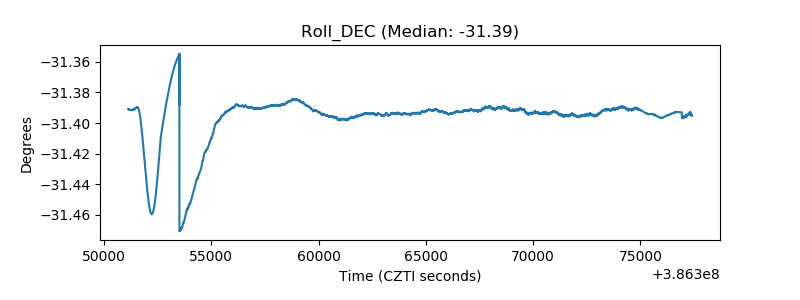 |
| _Roll_RA |  |
| Veto Counter | 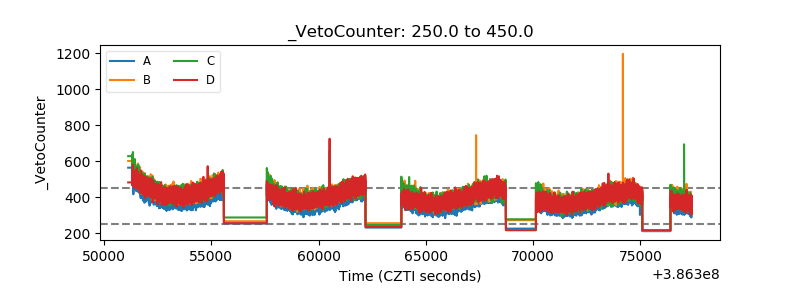 |