| Param | Original file | Final file |
|---|---|---|
| Filename | modeM0/AS1A11_069T05_9000005038_35161cztM0_level2.evt | modeM0/AS1A11_069T05_9000005038_35161cztM0_level2_quad_clean.evt |
| Size (bytes) | 410,472,000 | 64,128,960 |
| Size | 391.5 MB | 61.2 MB |
| Events in quadrant A | 1,807,115 | 471,577 |
| Events in quadrant B | 4,192,907 | 397,124 |
| Events in quadrant C | 2,003,703 | 447,964 |
| Events in quadrant D | 4,207,792 | 394,957 |
| Mode M9 | |||
|---|---|---|---|
| Quadrant | BADHDUFLAG | Total packets | Discarded packets |
| A | 0 | 21 | 0 |
| B | 0 | 21 | 0 |
| C | 0 | 21 | 0 |
| D | 0 | 21 | 0 |
| Mode SS | |||
|---|---|---|---|
| Quadrant | BADHDUFLAG | Total packets | Discarded packets |
| A | 0 | 66 | 0 |
| B | 0 | 66 | 0 |
| C | 0 | 66 | 0 |
| D | 0 | 66 | 0 |
| Mode M0 | |||
|---|---|---|---|
| Quadrant | BADHDUFLAG | Total packets | Discarded packets |
| A | 0 | 7330 | 1 |
| B | 0 | 14739 | 1 |
| C | 0 | 7920 | 1 |
| D | 0 | 14782 | 1 |
| Quadrant | Total seconds | Saturated seconds | Saturation percentage |
|---|---|---|---|
| A | 3237 | 8 | 0.247142% |
| B | 3237 | 923 | 28.514056% |
| C | 3237 | 61 | 1.884461% |
| D | 3237 | 454 | 14.025332% |
Noise dominated data is calculated using 1-second bins in cleaned event files. If a bin has >2000 counts, and if more than 50% of those come from <1% of pixels, then it is considered to be noise-dominated and hence unusable.
| Quadrant | # 1 sec bins | Bins with >0 counts | Bins with >2000 counts | High rate bins dominated by noise | Noise dominated (total time) | Noise dominated (detector-on time) | Marked lightcurve |
|---|---|---|---|---|---|---|---|
| A | 5301 | 3238 | 5 | 5 | 0.09% | 0.15% | 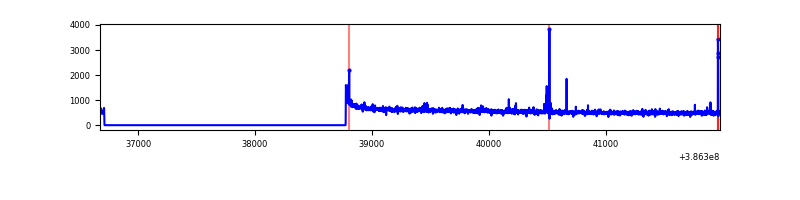 |
| B | 5301 | 3238 | 628 | 628 | 11.85% | 19.39% | 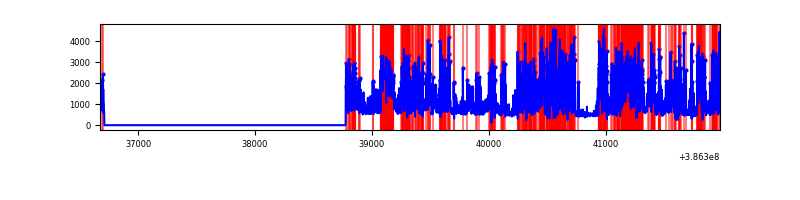 |
| C | 5301 | 3238 | 42 | 42 | 0.79% | 1.30% | 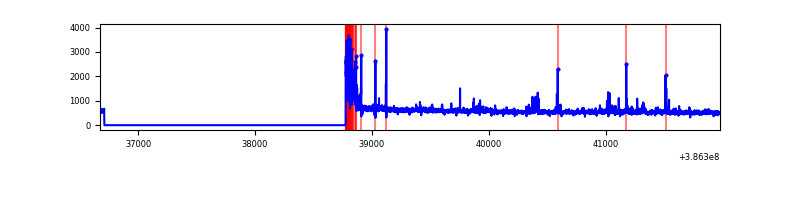 |
| D | 5301 | 3238 | 418 | 418 | 7.89% | 12.91% | 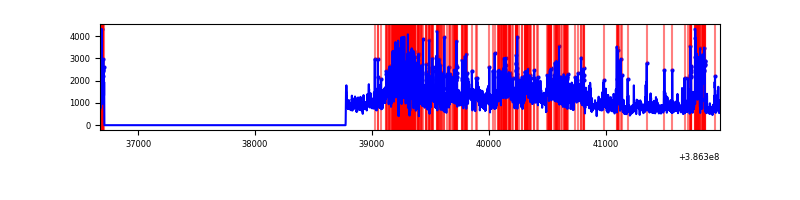 |
Top three noisy pixels from each quadrant. If the there are fewer than three noisy pixels in the level2.evt file, extra rows are filled as -1
| Pixel properties | Quadrant properties | ||||||
|---|---|---|---|---|---|---|---|
| Quadrant | DetID | PixID | Counts | Sigma | Mean | Median | Sigma |
| A | 10 | 83 | 52192 | 579.89 | 443 | 436 | 89.3 |
| A | 9 | 143 | 36867 | 408.18 | 443 | 436 | 89.3 |
| A | 13 | 6 | 6781 | 71.09 | 443 | 436 | 89.3 |
| B | 5 | 236 | 2022993 | 28000.23 | 379 | 372 | 72.2 |
| B | 5 | 172 | 445138 | 6157.13 | 379 | 372 | 72.2 |
| B | 0 | 182 | 172237 | 2379.22 | 379 | 372 | 72.2 |
| C | 0 | 10 | 179306 | 1869.05 | 413 | 418 | 95.7 |
| C | 15 | 214 | 136820 | 1425.15 | 413 | 418 | 95.7 |
| C | 0 | 207 | 54452 | 564.56 | 413 | 418 | 95.7 |
| D | 8 | 195 | 1371830 | 13974.29 | 404 | 396 | 98.1 |
| D | 7 | 80 | 737422 | 7509.96 | 404 | 396 | 98.1 |
| D | 10 | 118 | 237108 | 2411.99 | 404 | 396 | 98.1 |
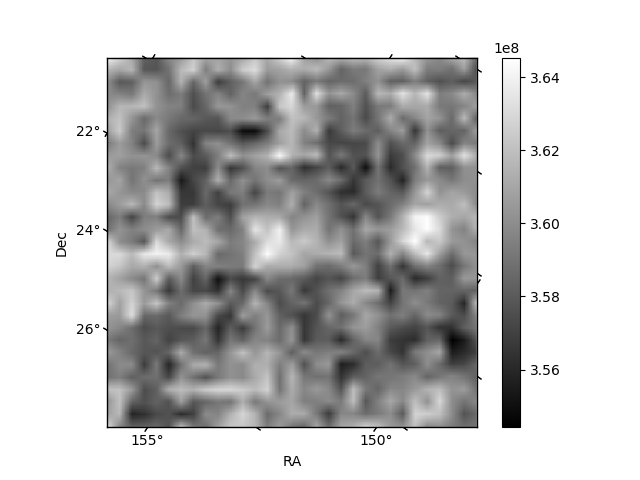
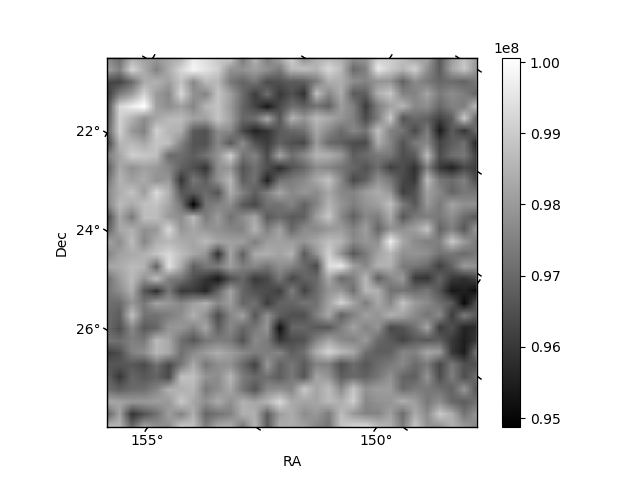
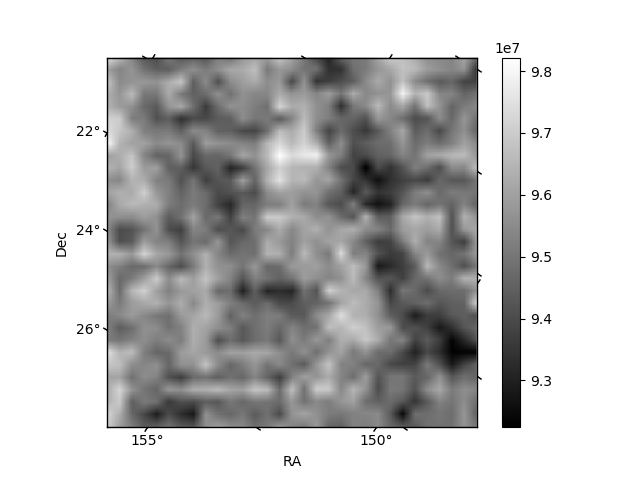
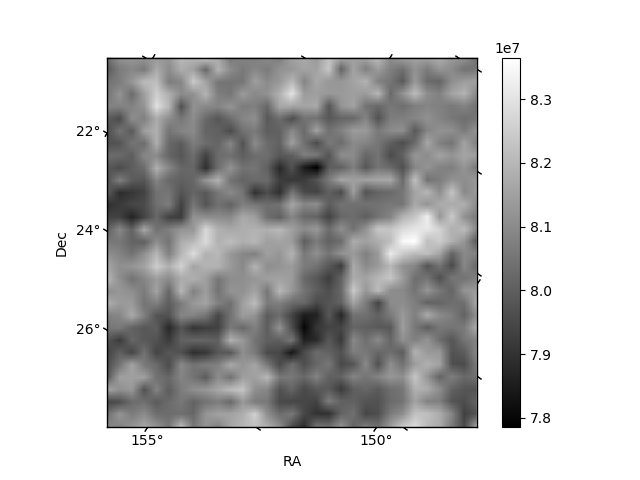
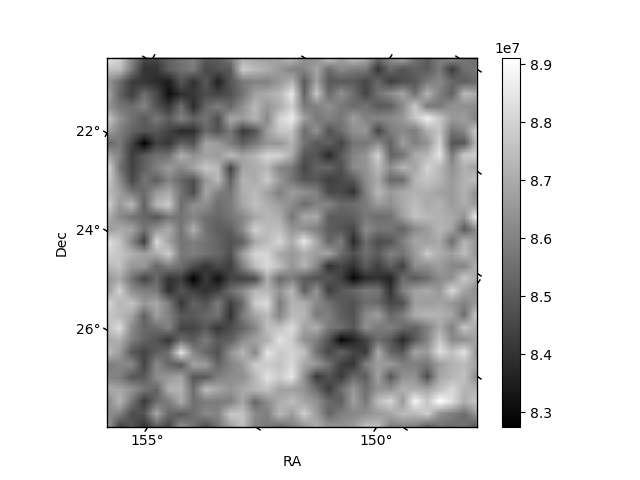
Histogram calculated using DETX and DETY for each event in the final _common_clean file
| Quadrant A | 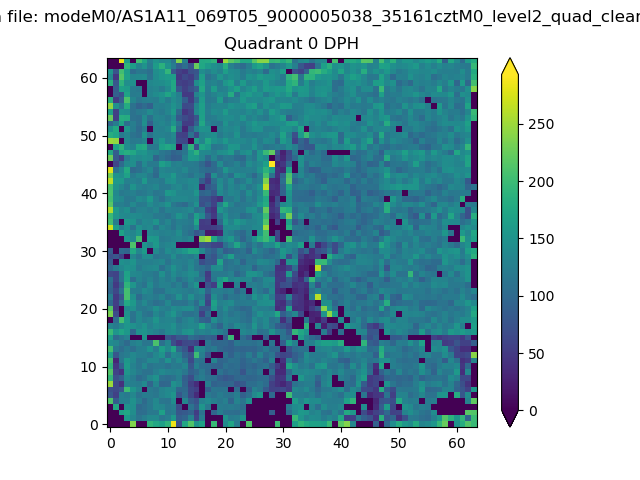 |
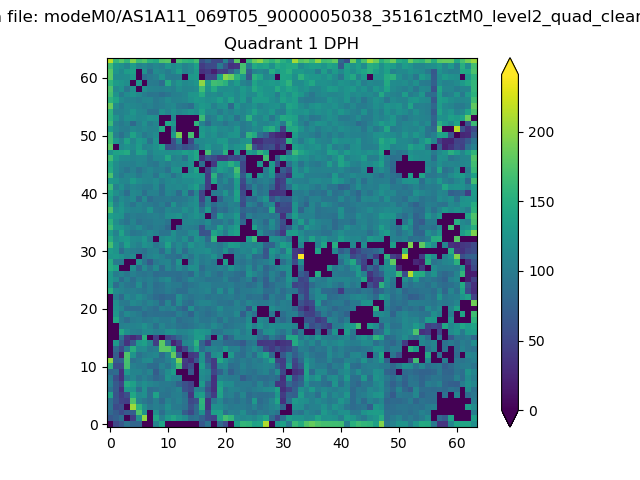 |
Quadrant B |
|---|---|---|---|
| Quadrant D | 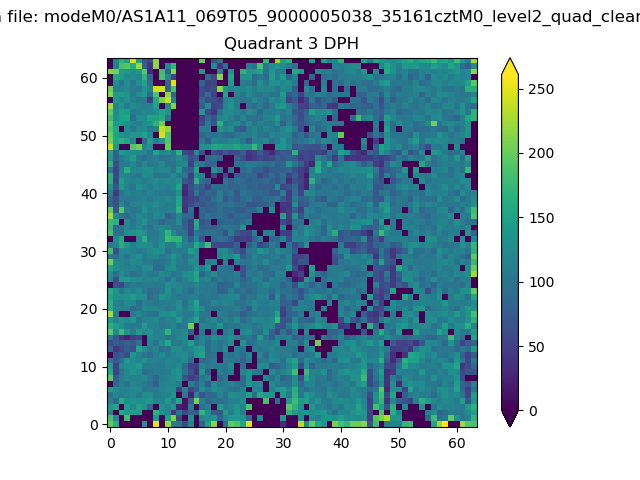 |
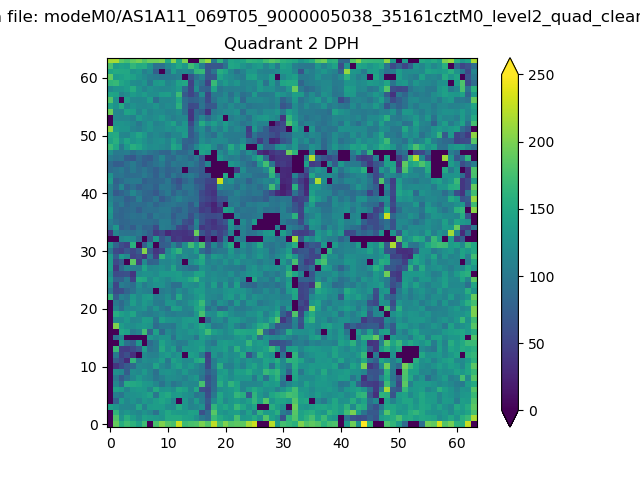 |
Quadrant C |
| Plot type | Count rate plots | Images |
|---|---|---|
| Comparison with Poisson distribution Blue bars denote a histogram of data divided into 1 sec bins. Red curve is a Poisson curve with rate = median count rate of data. |
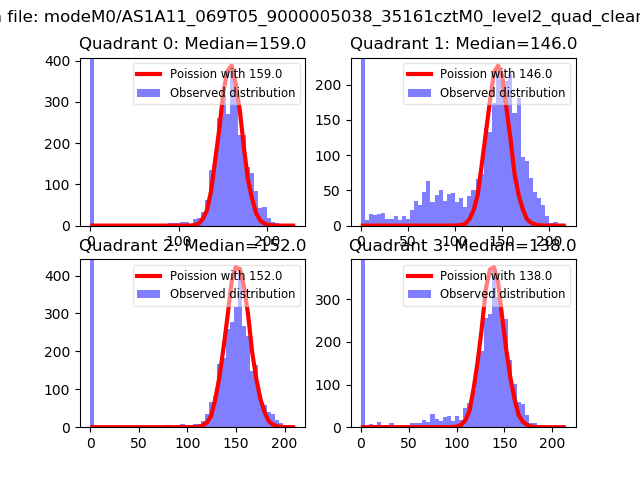 |
 |
| Quadrant-wise count rates Data is divided into 100 sec bins |
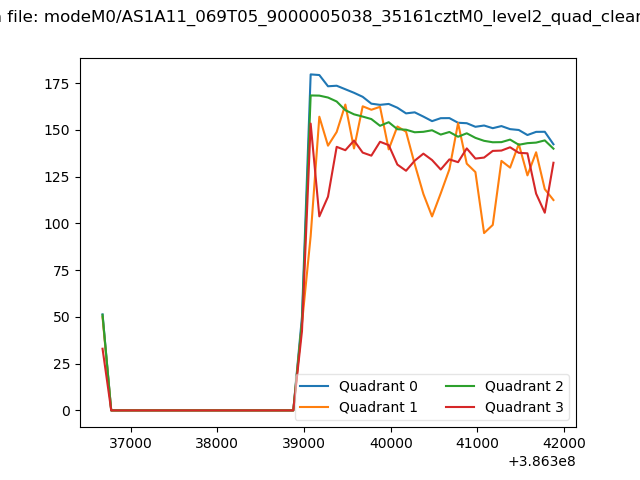 |
|
| Module-wise count rates for Quadrant A Data is divided into 100 sec bins |
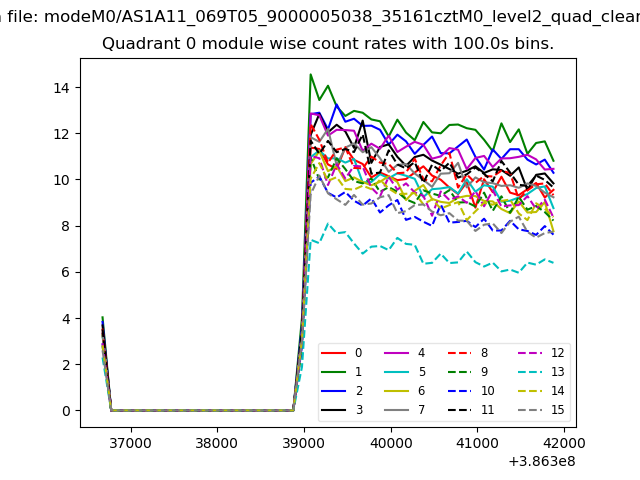 |
 |
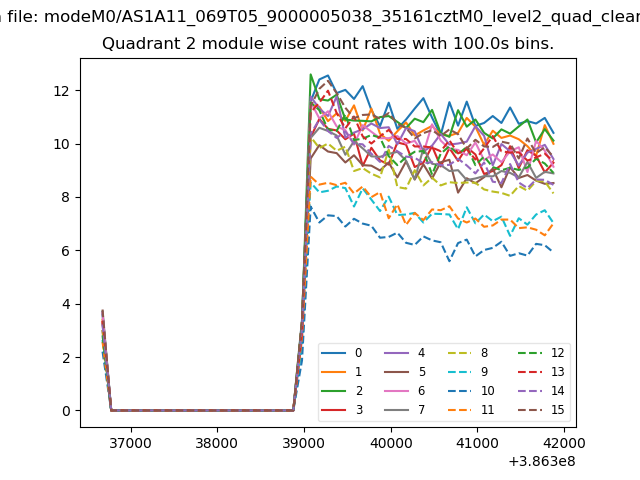
| Module-wise count rates for Quadrant B Data is divided into 100 sec bins |
 |
 |
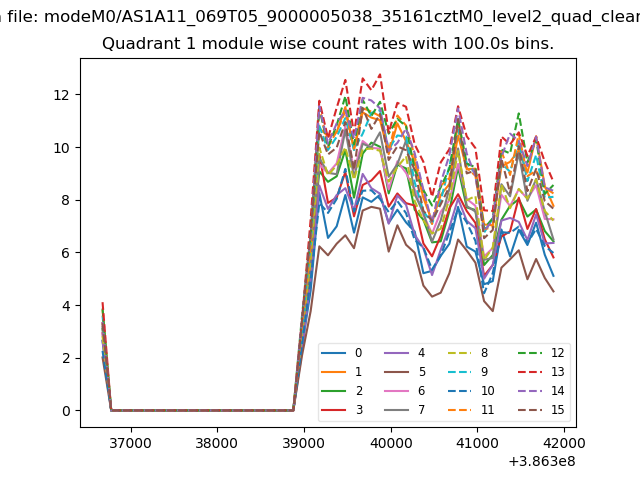
| Module-wise count rates for Quadrant C Data is divided into 100 sec bins |
 |
 |
| Module-wise count rates for Quadrant D Data is divided into 100 sec bins |
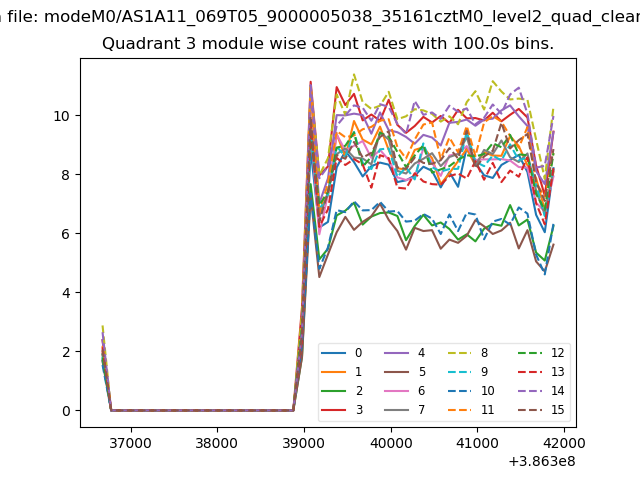 |
 |
| Parameter | Plot |
|---|---|
| CZT HV Monitor | 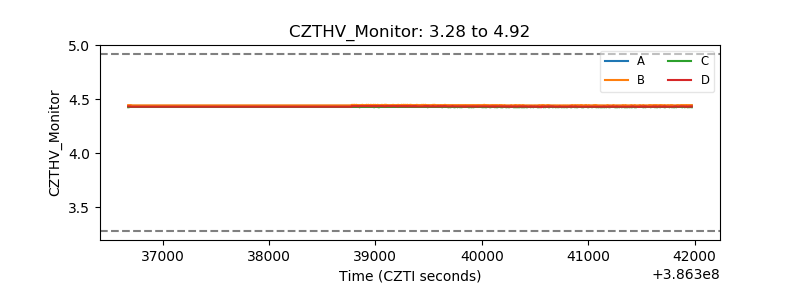 |
| D_VDD | 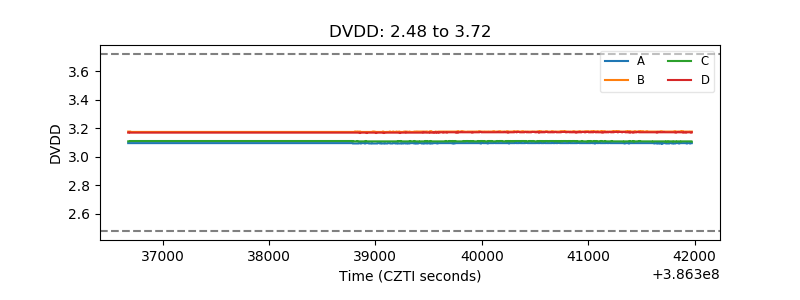 |
| Temperature 1 | 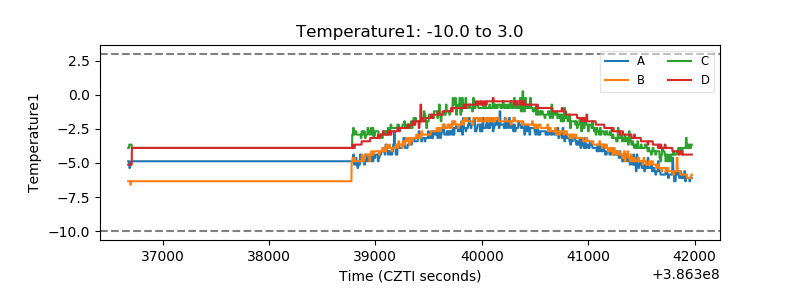 |
| Veto HV Monitor | 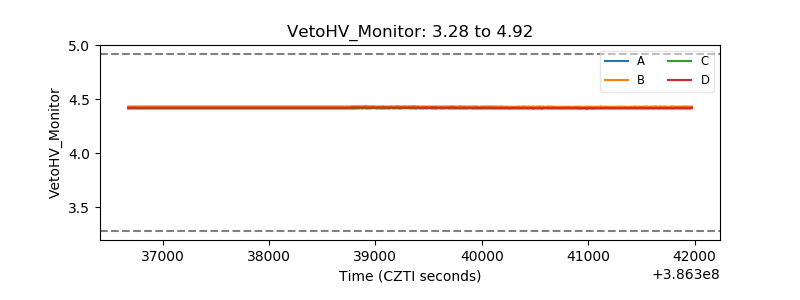 |
| Veto LLD | 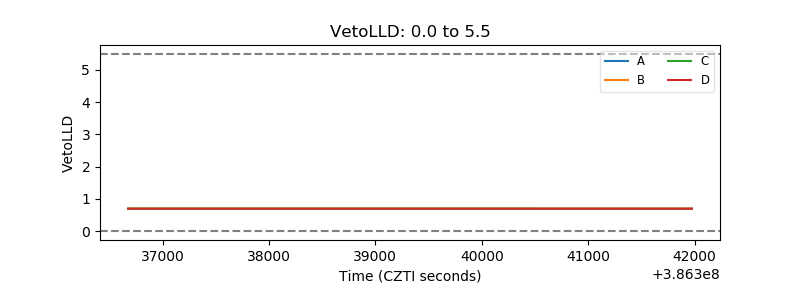 |
| Alpha Counter |  |
| _CPM_Rate | 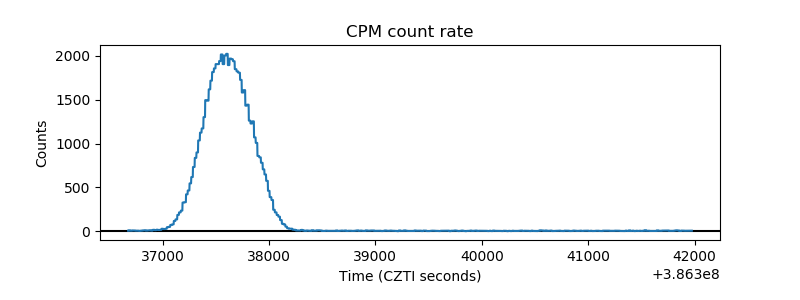 |
| CZT Counter | 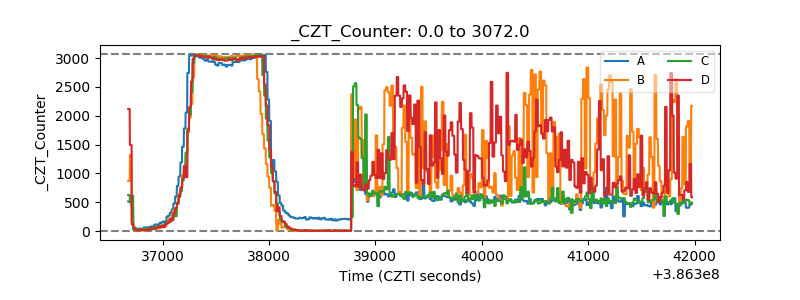 |
| +2.5 Volts monitor | 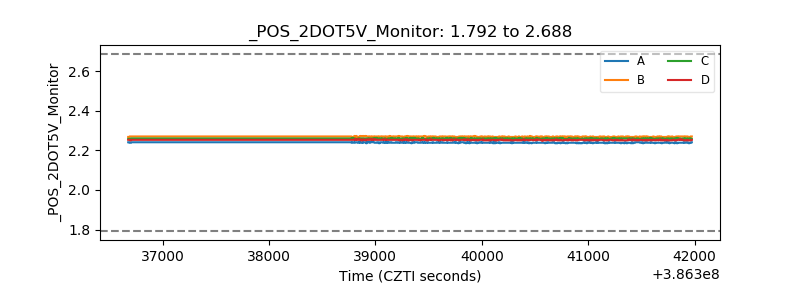 |
| +5 Volts monitor | 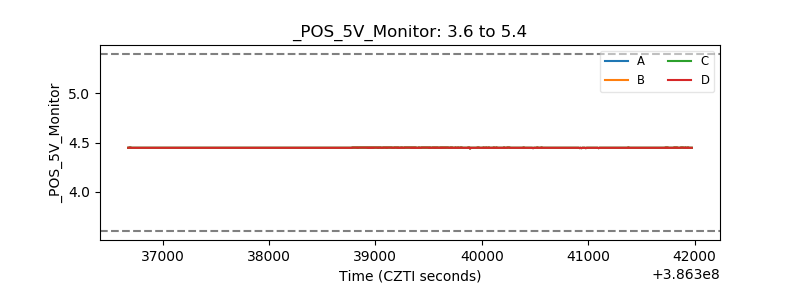 |
| _ROLL_ROT | 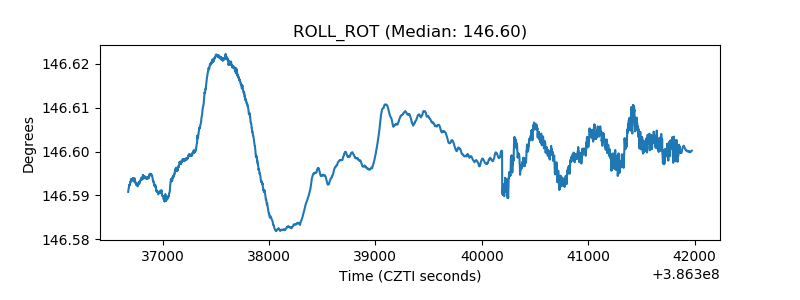 |
| _Roll_DEC | 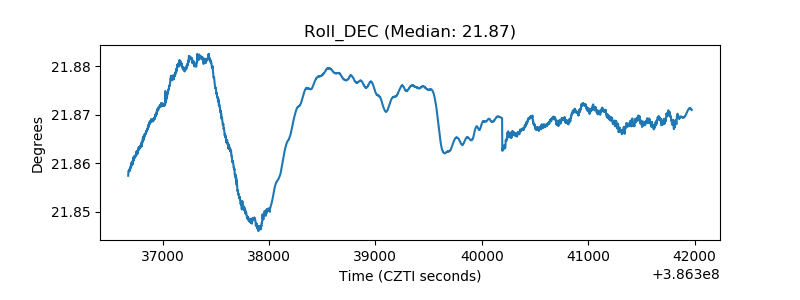 |
| _Roll_RA | 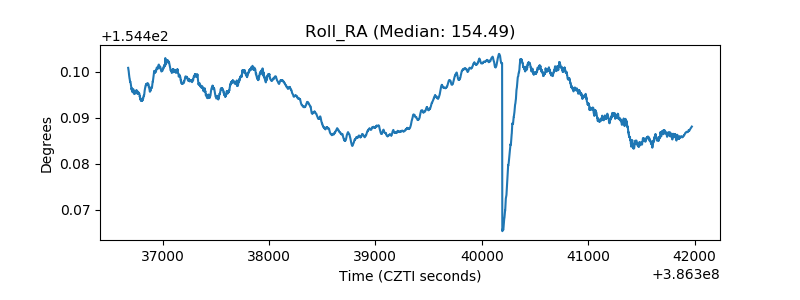 |
| Veto Counter | 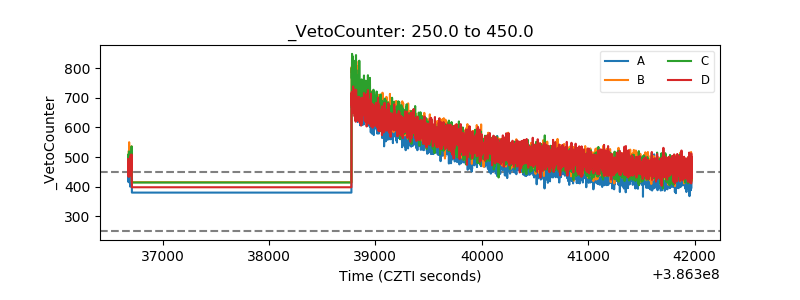 |