| Param | Original file | Final file |
|---|---|---|
| Filename | modeM0/AS1A11_069T05_9000005038_35160cztM0_level2.evt | modeM0/AS1A11_069T05_9000005038_35160cztM0_level2_quad_clean.evt |
| Size (bytes) | 667,059,840 | 91,313,280 |
| Size | 636.2 MB | 87.1 MB |
| Events in quadrant A | 2,990,942 | 657,477 |
| Events in quadrant B | 5,616,914 | 594,233 |
| Events in quadrant C | 3,406,991 | 625,944 |
| Events in quadrant D | 7,838,207 | 524,483 |
| Mode M9 | |||
|---|---|---|---|
| Quadrant | BADHDUFLAG | Total packets | Discarded packets |
| A | 0 | 40 | 0 |
| B | 0 | 40 | 0 |
| C | 0 | 40 | 0 |
| D | 0 | 40 | 0 |
| Mode SS | |||
|---|---|---|---|
| Quadrant | BADHDUFLAG | Total packets | Discarded packets |
| A | 0 | 108 | 0 |
| B | 0 | 108 | 0 |
| C | 0 | 108 | 0 |
| D | 0 | 108 | 0 |
| Mode M0 | |||
|---|---|---|---|
| Quadrant | BADHDUFLAG | Total packets | Discarded packets |
| A | 0 | 12041 | 3 |
| B | 0 | 20347 | 2 |
| C | 0 | 13362 | 2 |
| D | 0 | 26930 | 2 |
| Quadrant | Total seconds | Saturated seconds | Saturation percentage |
|---|---|---|---|
| A | 5171 | 26 | 0.502804% |
| B | 5171 | 907 | 17.540128% |
| C | 5171 | 151 | 2.920132% |
| D | 5171 | 1349 | 26.087797% |
Noise dominated data is calculated using 1-second bins in cleaned event files. If a bin has >2000 counts, and if more than 50% of those come from <1% of pixels, then it is considered to be noise-dominated and hence unusable.
| Quadrant | # 1 sec bins | Bins with >0 counts | Bins with >2000 counts | High rate bins dominated by noise | Noise dominated (total time) | Noise dominated (detector-on time) | Marked lightcurve |
|---|---|---|---|---|---|---|---|
| A | 9208 | 5173 | 8 | 8 | 0.09% | 0.15% | 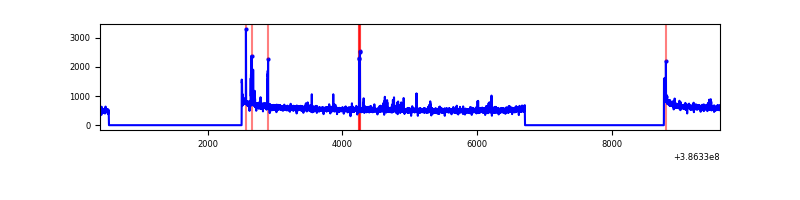 |
| B | 9208 | 5173 | 627 | 627 | 6.81% | 12.12% | 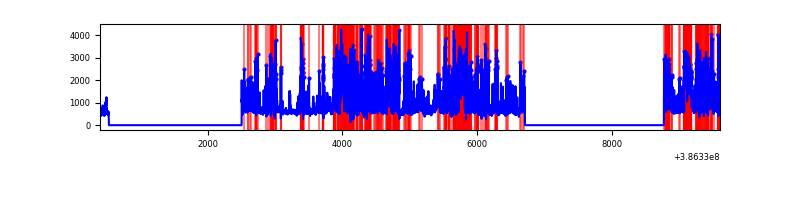 |
| C | 9208 | 5173 | 103 | 103 | 1.12% | 1.99% | 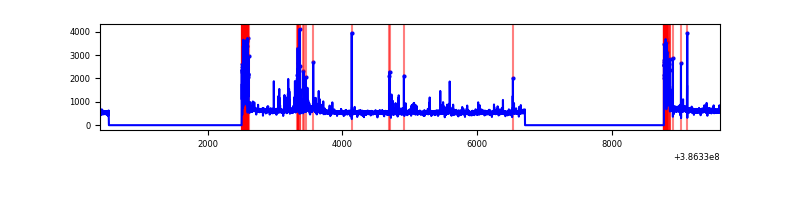 |
| D | 9208 | 5173 | 1132 | 1132 | 12.29% | 21.88% | 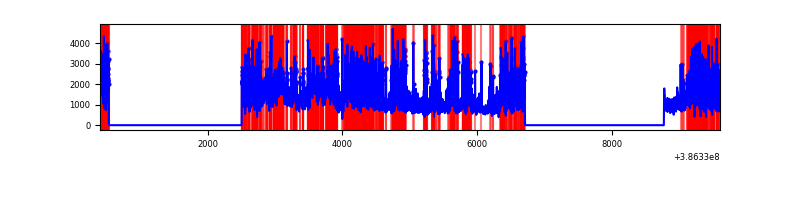 |
Top three noisy pixels from each quadrant. If the there are fewer than three noisy pixels in the level2.evt file, extra rows are filled as -1
| Pixel properties | Quadrant properties | ||||||
|---|---|---|---|---|---|---|---|
| Quadrant | DetID | PixID | Counts | Sigma | Mean | Median | Sigma |
| A | 10 | 83 | 92517 | 643.31 | 721 | 712 | 142.7 |
| A | 9 | 143 | 58032 | 401.66 | 721 | 712 | 142.7 |
| A | 15 | 169 | 40108 | 276.06 | 721 | 712 | 142.7 |
| B | 5 | 236 | 2424407 | 19832.38 | 655 | 641 | 122.2 |
| B | 5 | 172 | 382830 | 3127.25 | 655 | 641 | 122.2 |
| B | 0 | 182 | 170941 | 1393.47 | 655 | 641 | 122.2 |
| C | 0 | 10 | 330029 | 2148.07 | 669 | 676 | 153.3 |
| C | 15 | 214 | 219169 | 1425.03 | 669 | 676 | 153.3 |
| C | 1 | 23 | 116482 | 755.3 | 669 | 676 | 153.3 |
| D | 7 | 80 | 2015545 | 13118.29 | 630 | 616 | 153.6 |
| D | 8 | 195 | 1805619 | 11751.56 | 630 | 616 | 153.6 |
| D | 2 | 250 | 522178 | 3395.65 | 630 | 616 | 153.6 |
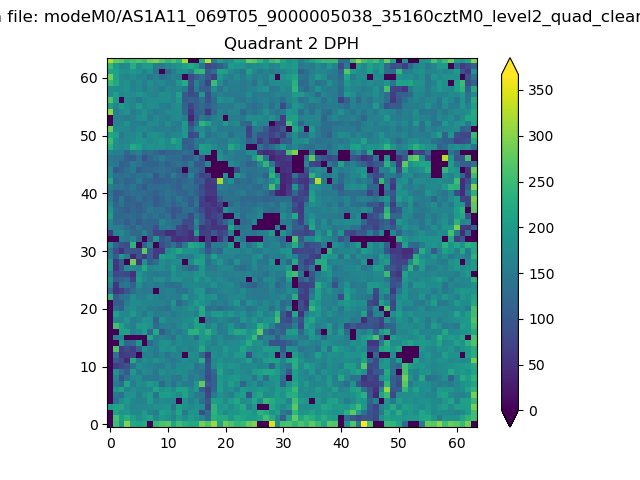
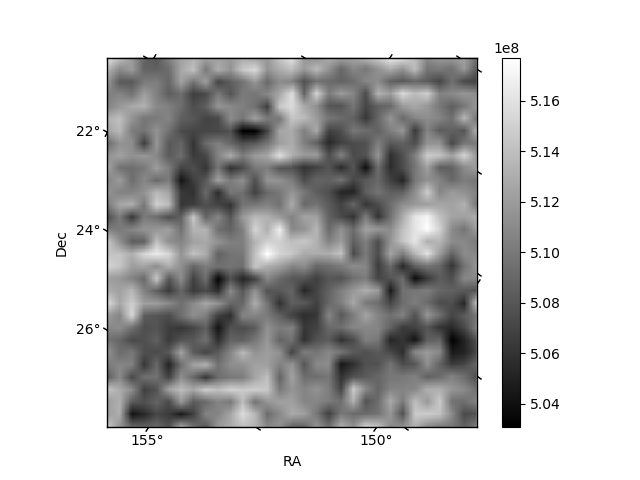
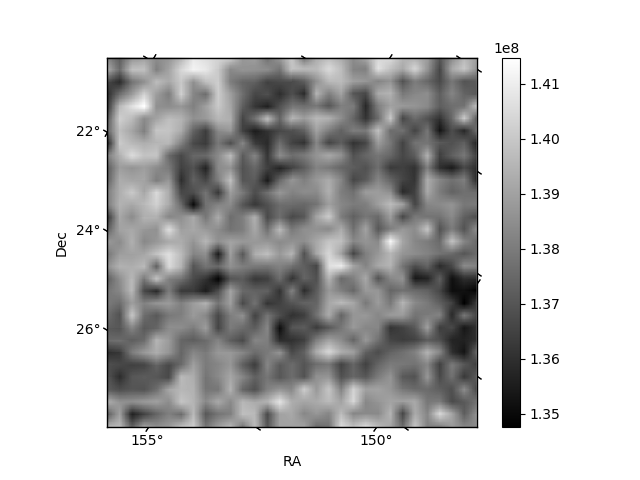
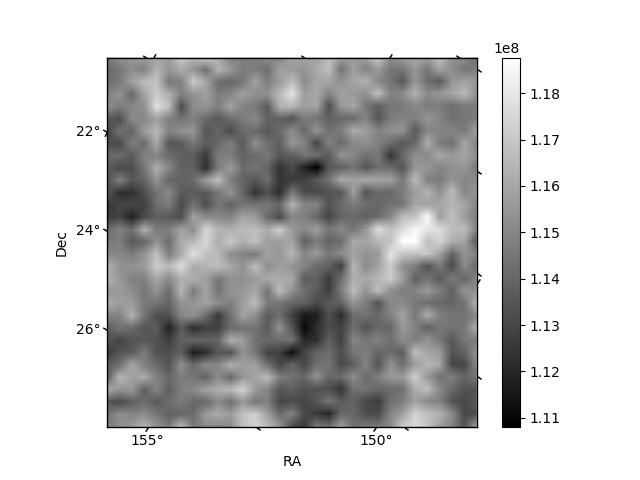
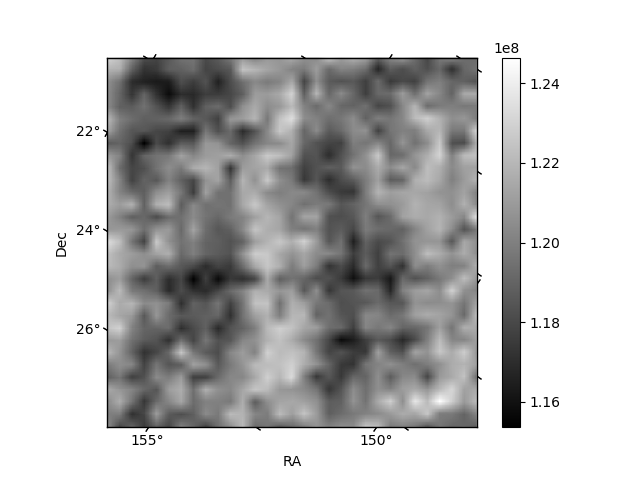
Histogram calculated using DETX and DETY for each event in the final _common_clean file
| Quadrant A | 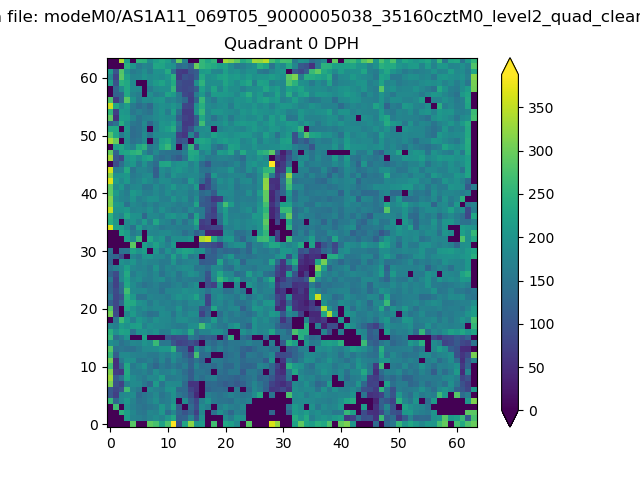 |
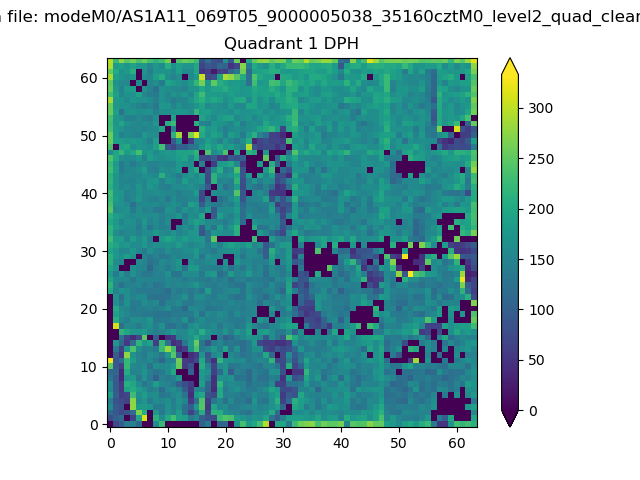 |
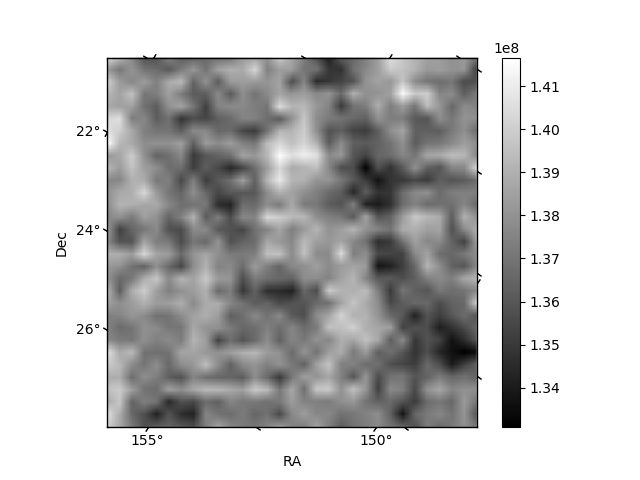
Quadrant B |
|---|---|---|---|
| Quadrant D | 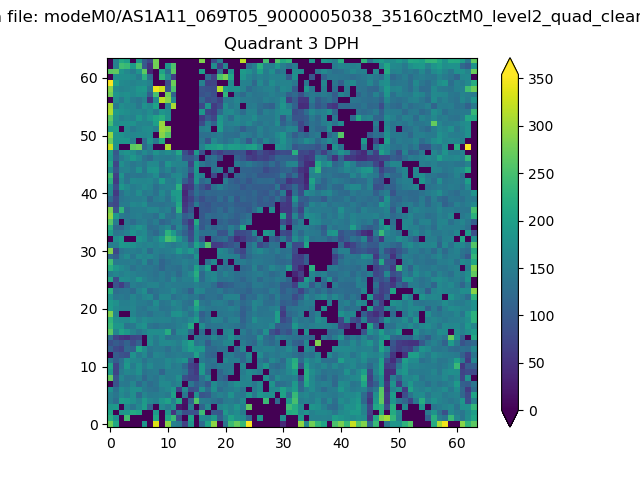 |
 |
Quadrant C |
| Plot type | Count rate plots | Images |
|---|---|---|
| Comparison with Poisson distribution Blue bars denote a histogram of data divided into 1 sec bins. Red curve is a Poisson curve with rate = median count rate of data. |
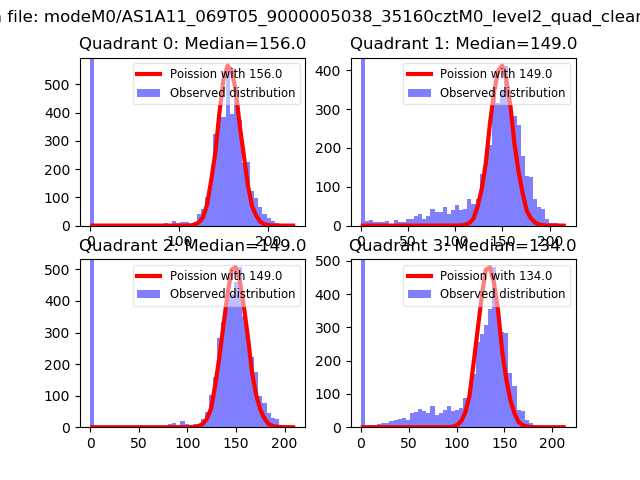 |
 |
| Quadrant-wise count rates Data is divided into 100 sec bins |
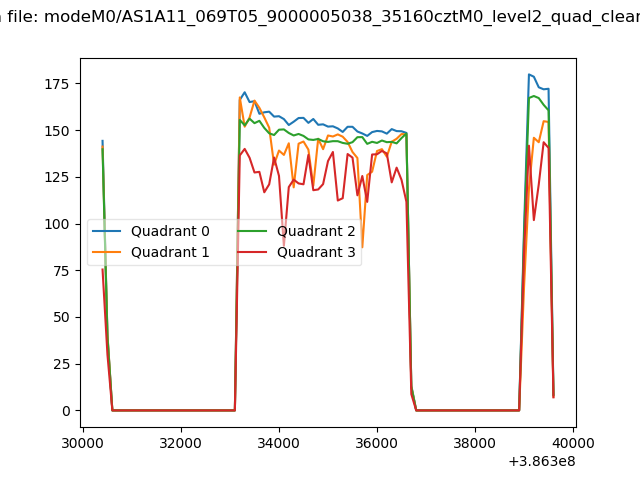 |
|
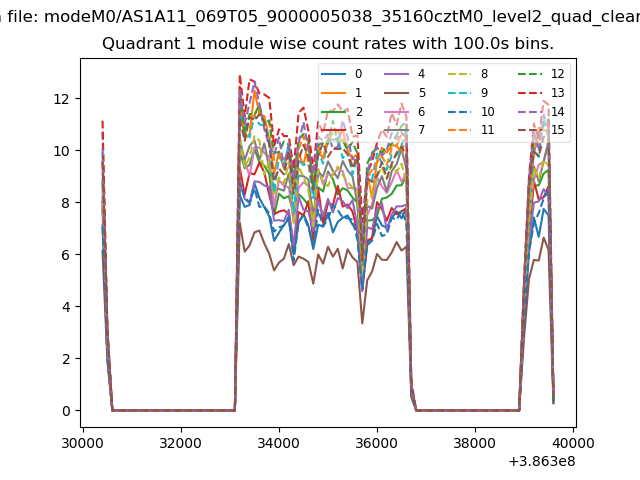
| Module-wise count rates for Quadrant A Data is divided into 100 sec bins |
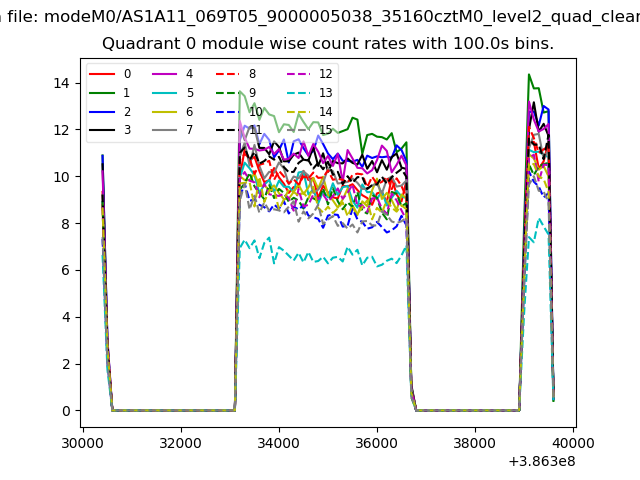 |
 |
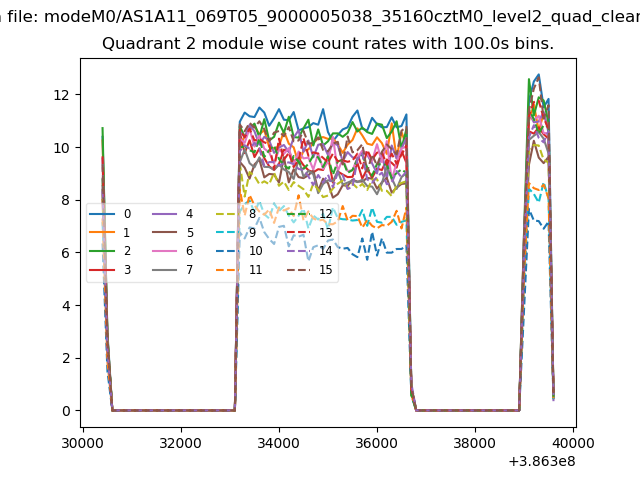
| Module-wise count rates for Quadrant B Data is divided into 100 sec bins |
 |
 |
| Module-wise count rates for Quadrant C Data is divided into 100 sec bins |
 |
 |
| Module-wise count rates for Quadrant D Data is divided into 100 sec bins |
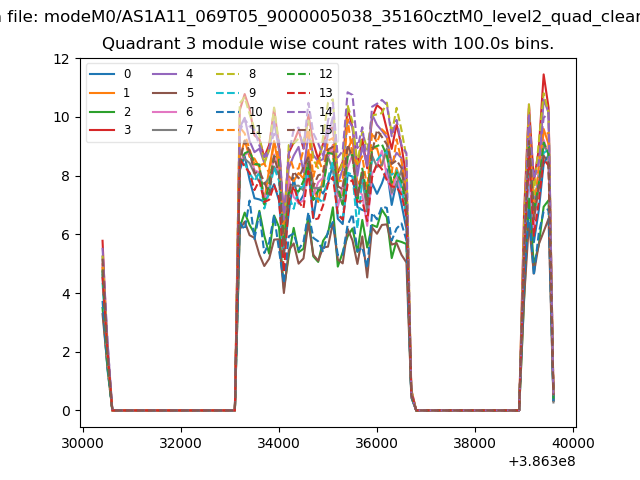 |
 |
| Parameter | Plot |
|---|---|
| CZT HV Monitor | 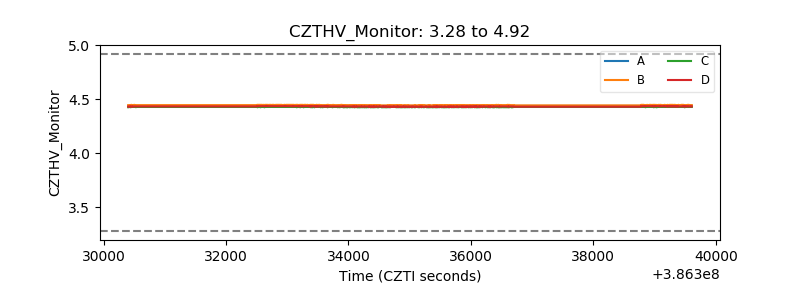 |
| D_VDD | 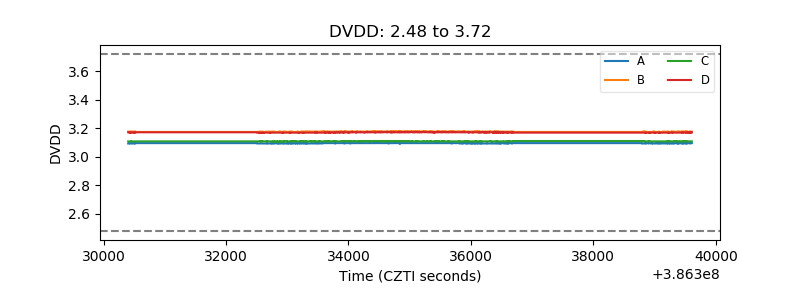 |
| Temperature 1 | 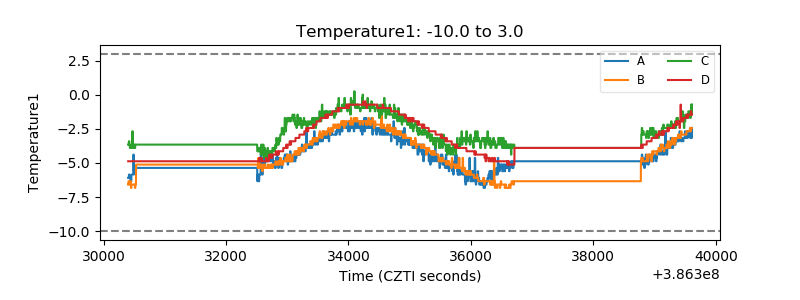 |
| Veto HV Monitor | 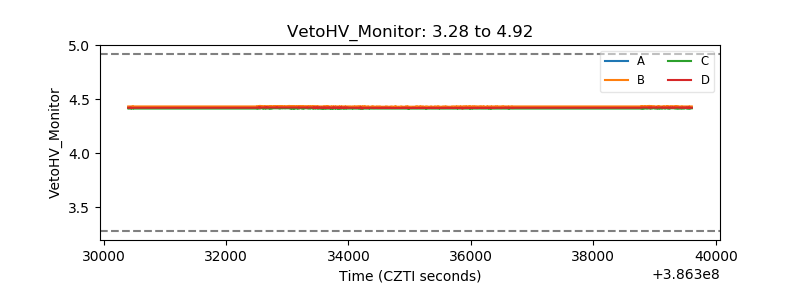 |
| Veto LLD | 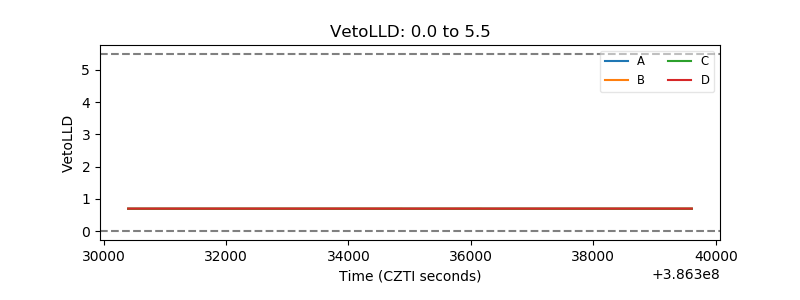 |
| Alpha Counter | 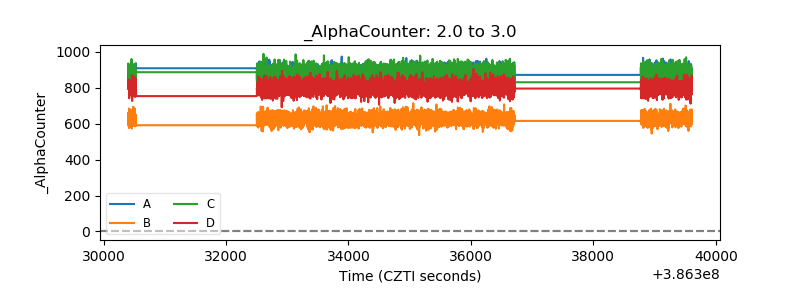 |
| _CPM_Rate | 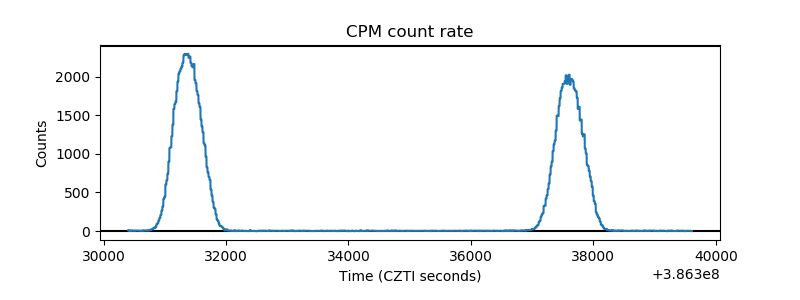 |
| CZT Counter | 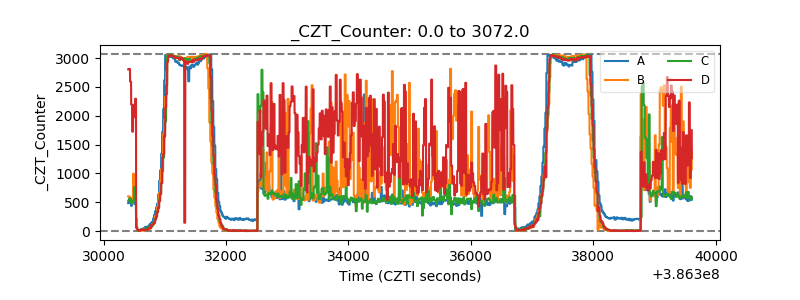 |
| +2.5 Volts monitor | 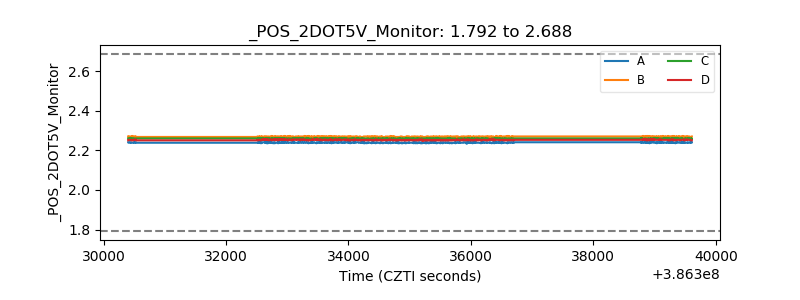 |
| +5 Volts monitor | 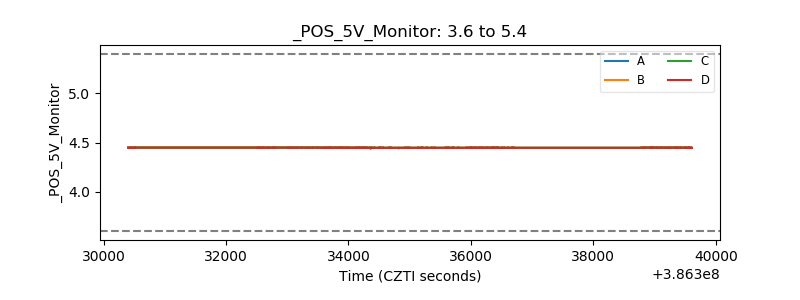 |
| _ROLL_ROT | 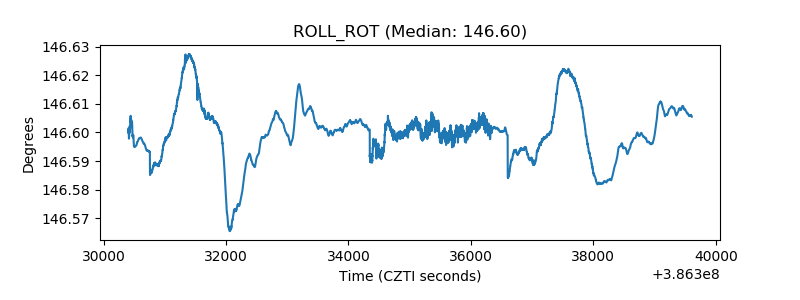 |
| _Roll_DEC | 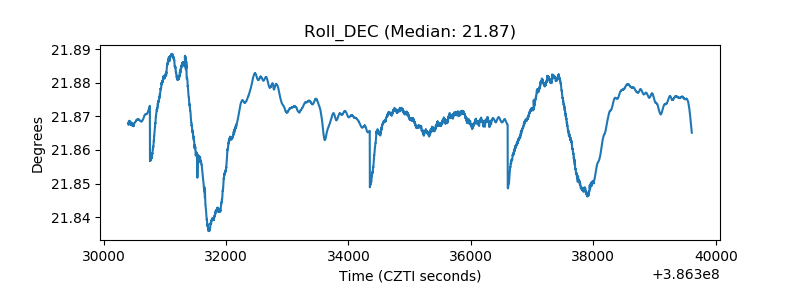 |
| _Roll_RA | 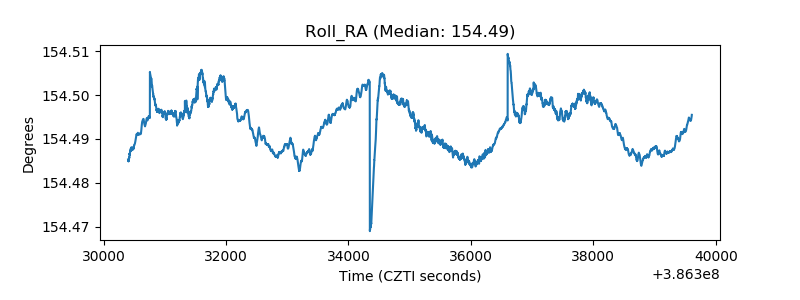 |
| Veto Counter | 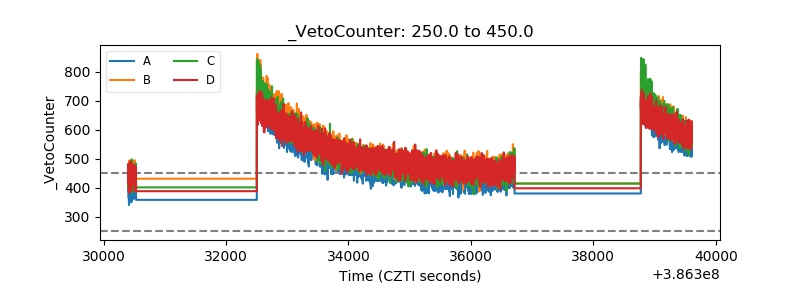 |