| Param | Original file | Final file |
|---|---|---|
| Filename | modeM0/AS1A11_069T05_9000005038_35159cztM0_level2.evt | modeM0/AS1A11_069T05_9000005038_35159cztM0_level2_quad_clean.evt |
| Size (bytes) | 637,928,640 | 73,319,040 |
| Size | 608.4 MB | 69.9 MB |
| Events in quadrant A | 2,976,027 | 503,405 |
| Events in quadrant B | 4,689,073 | 471,516 |
| Events in quadrant C | 3,363,078 | 484,943 |
| Events in quadrant D | 7,934,767 | 389,658 |
| Mode M9 | |||
|---|---|---|---|
| Quadrant | BADHDUFLAG | Total packets | Discarded packets |
| A | 0 | 38 | 0 |
| B | 0 | 38 | 0 |
| C | 0 | 38 | 0 |
| D | 0 | 38 | 0 |
| Mode SS | |||
|---|---|---|---|
| Quadrant | BADHDUFLAG | Total packets | Discarded packets |
| A | 0 | 110 | 0 |
| B | 0 | 110 | 0 |
| C | 0 | 110 | 0 |
| D | 0 | 110 | 0 |
| Mode M0 | |||
|---|---|---|---|
| Quadrant | BADHDUFLAG | Total packets | Discarded packets |
| A | 0 | 11985 | 3 |
| B | 0 | 17534 | 2 |
| C | 0 | 13073 | 2 |
| D | 0 | 27335 | 2 |
| Quadrant | Total seconds | Saturated seconds | Saturation percentage |
|---|---|---|---|
| A | 5281 | 27 | 0.511267% |
| B | 5281 | 597 | 11.304677% |
| C | 5281 | 143 | 2.707820% |
| D | 5281 | 1408 | 26.661617% |
Noise dominated data is calculated using 1-second bins in cleaned event files. If a bin has >2000 counts, and if more than 50% of those come from <1% of pixels, then it is considered to be noise-dominated and hence unusable.
| Quadrant | # 1 sec bins | Bins with >0 counts | Bins with >2000 counts | High rate bins dominated by noise | Noise dominated (total time) | Noise dominated (detector-on time) | Marked lightcurve |
|---|---|---|---|---|---|---|---|
| A | 9077 | 5283 | 4 | 4 | 0.04% | 0.08% | 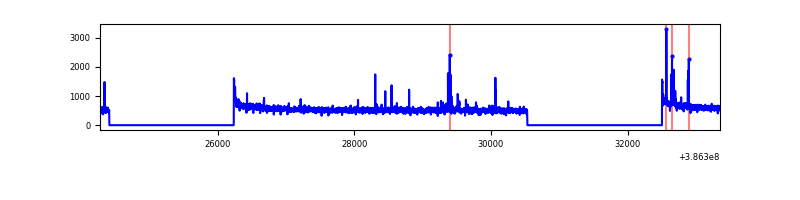 |
| B | 9077 | 5283 | 354 | 354 | 3.90% | 6.70% | 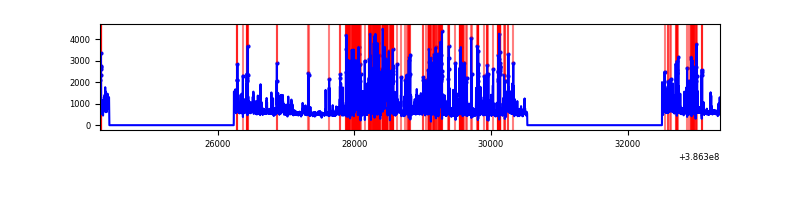 |
| C | 9077 | 5283 | 100 | 100 | 1.10% | 1.89% | 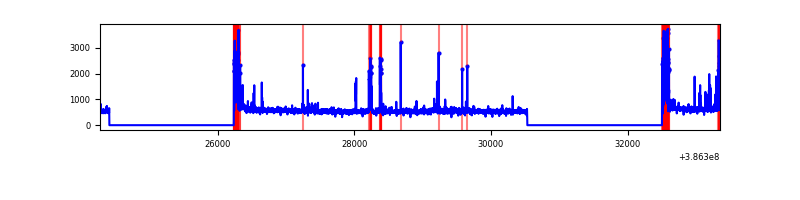 |
| D | 9077 | 5283 | 1321 | 1321 | 14.55% | 25.00% | 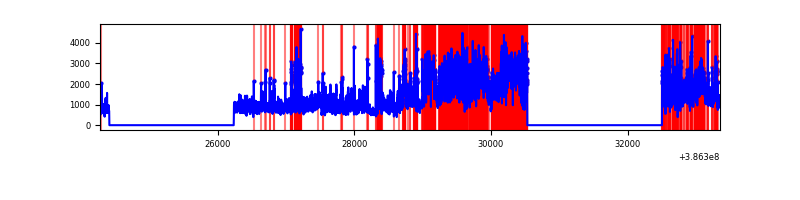 |
Top three noisy pixels from each quadrant. If the there are fewer than three noisy pixels in the level2.evt file, extra rows are filled as -1
| Pixel properties | Quadrant properties | ||||||
|---|---|---|---|---|---|---|---|
| Quadrant | DetID | PixID | Counts | Sigma | Mean | Median | Sigma |
| A | 10 | 83 | 91818 | 642.14 | 715 | 705 | 141.9 |
| A | 9 | 143 | 59359 | 413.38 | 715 | 705 | 141.9 |
| A | 15 | 169 | 45190 | 313.52 | 715 | 705 | 141.9 |
| B | 5 | 236 | 1808133 | 14238.44 | 673 | 658 | 126.9 |
| B | 5 | 172 | 136436 | 1069.6 | 673 | 658 | 126.9 |
| B | 4 | 232 | 46787 | 363.38 | 673 | 658 | 126.9 |
| C | 0 | 10 | 280910 | 1830.45 | 670 | 677 | 153.1 |
| C | 15 | 214 | 223835 | 1457.64 | 670 | 677 | 153.1 |
| C | 0 | 207 | 155690 | 1012.53 | 670 | 677 | 153.1 |
| D | 7 | 80 | 3160265 | 21060.5 | 620 | 605 | 150.0 |
| D | 8 | 195 | 1783956 | 11886.81 | 620 | 605 | 150.0 |
| D | 12 | 79 | 202188 | 1343.64 | 620 | 605 | 150.0 |
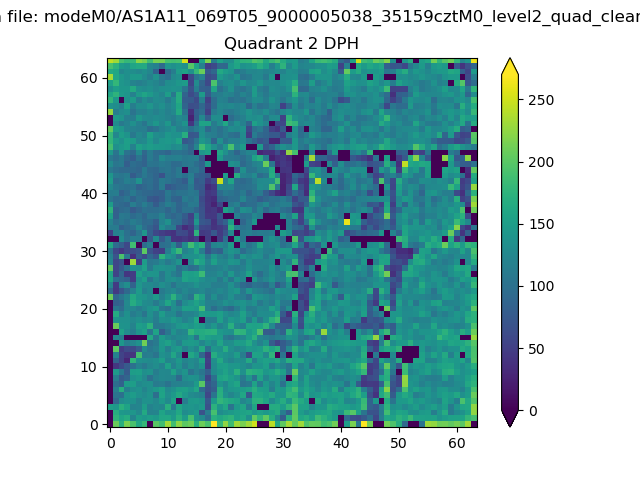
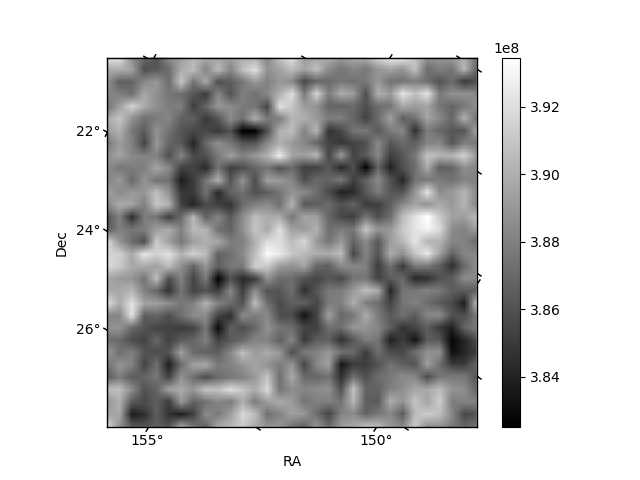
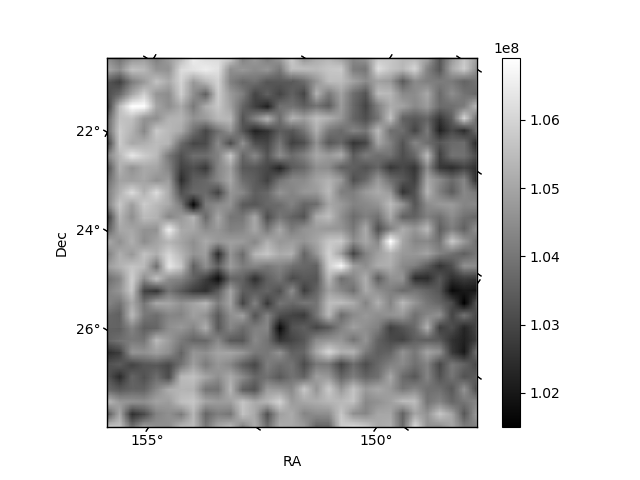
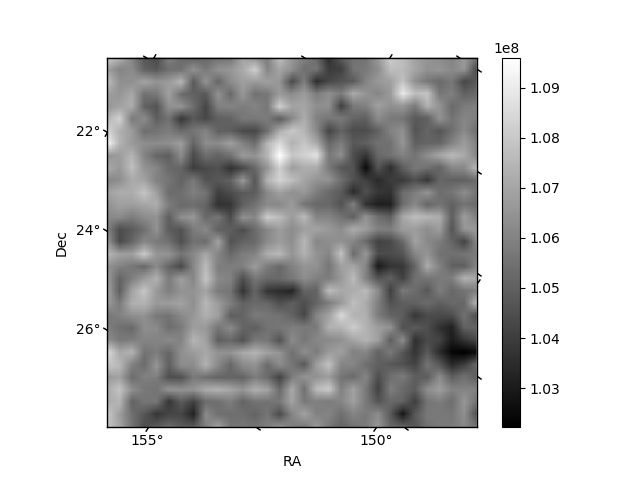
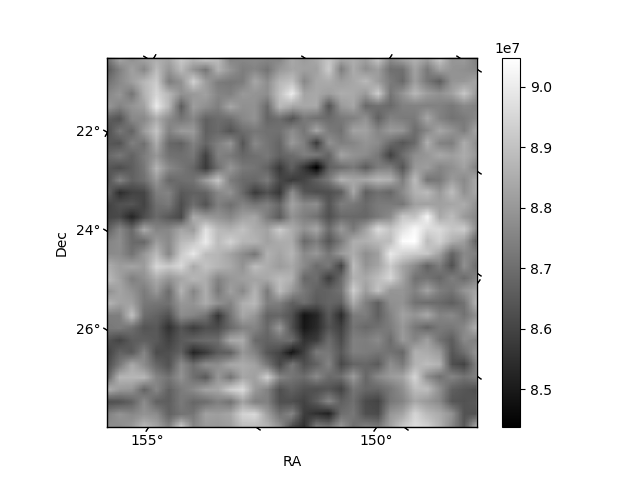
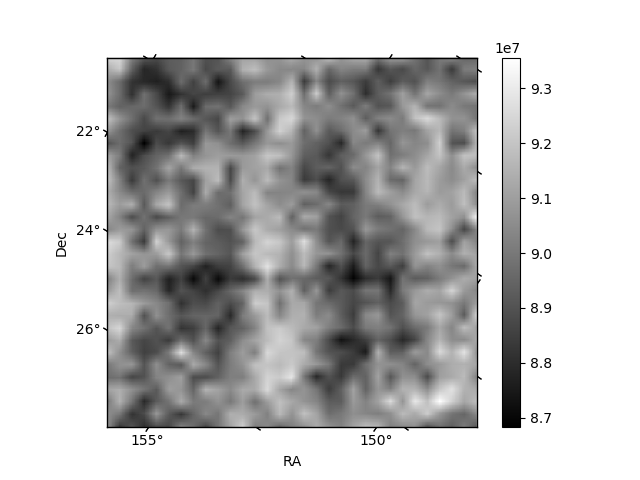
Histogram calculated using DETX and DETY for each event in the final _common_clean file
| Quadrant A | 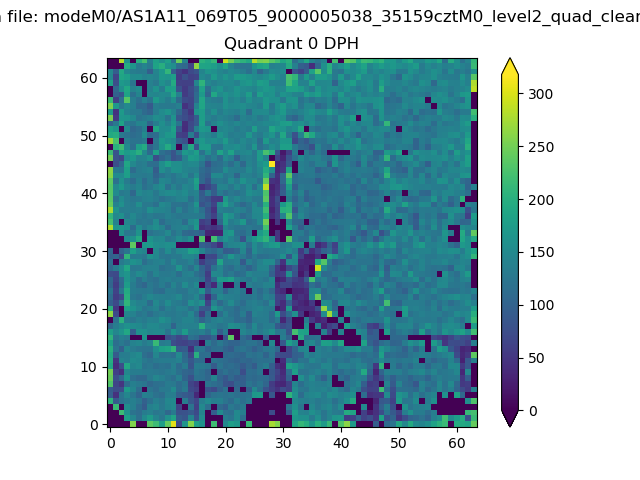 |
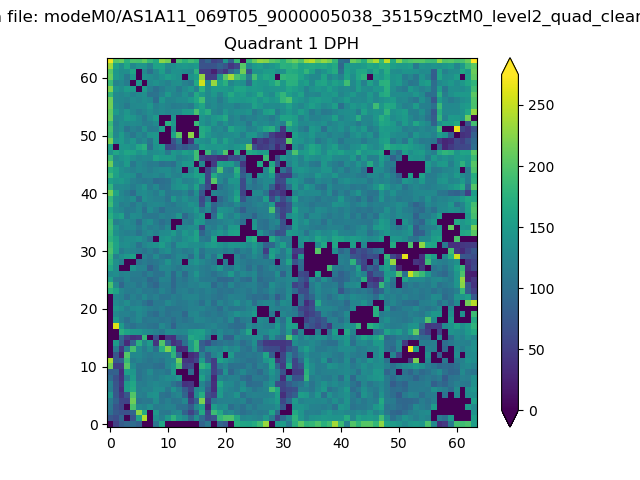 |
Quadrant B |
|---|---|---|---|
| Quadrant D | 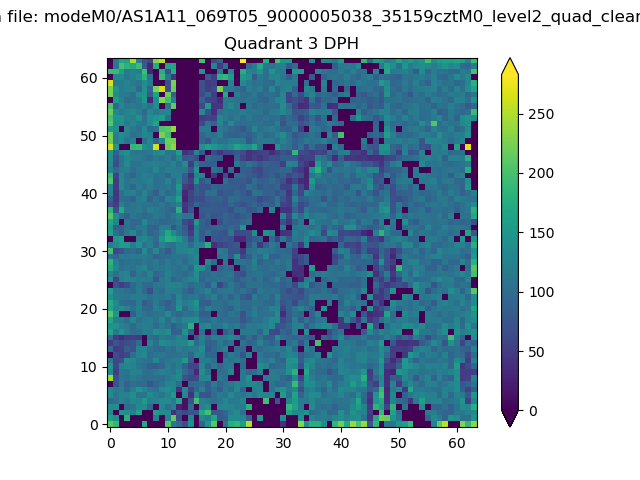 |
 |
Quadrant C |
| Plot type | Count rate plots | Images |
|---|---|---|
| Comparison with Poisson distribution Blue bars denote a histogram of data divided into 1 sec bins. Red curve is a Poisson curve with rate = median count rate of data. |
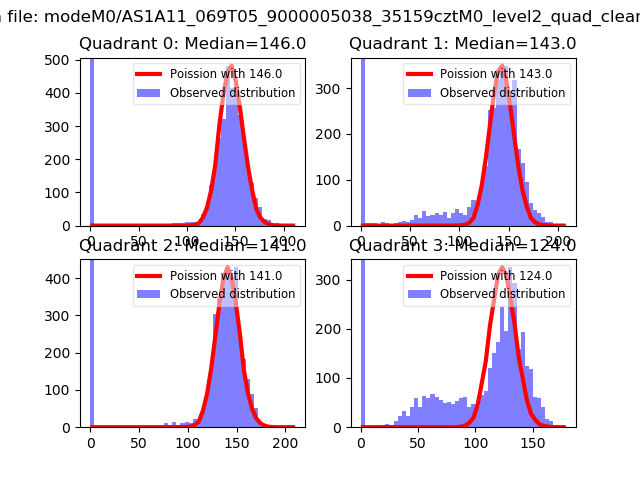 |
 |
| Quadrant-wise count rates Data is divided into 100 sec bins |
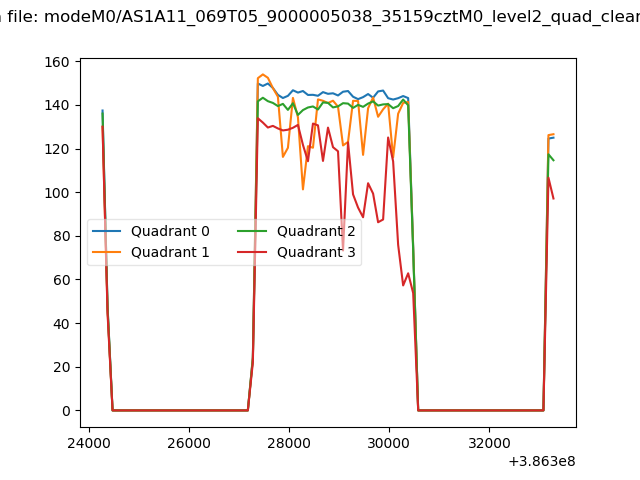 |
|
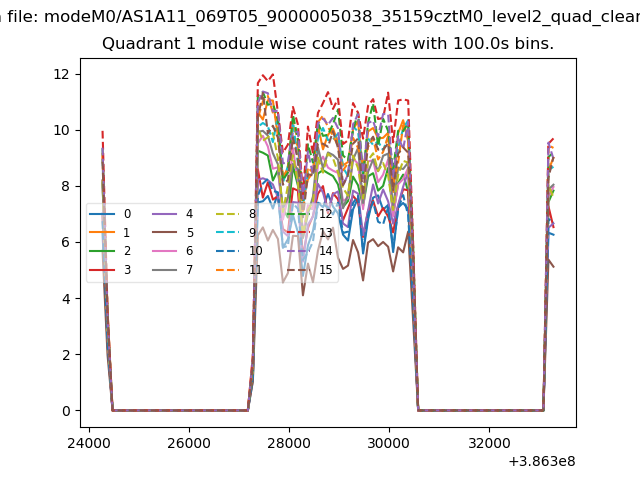
| Module-wise count rates for Quadrant A Data is divided into 100 sec bins |
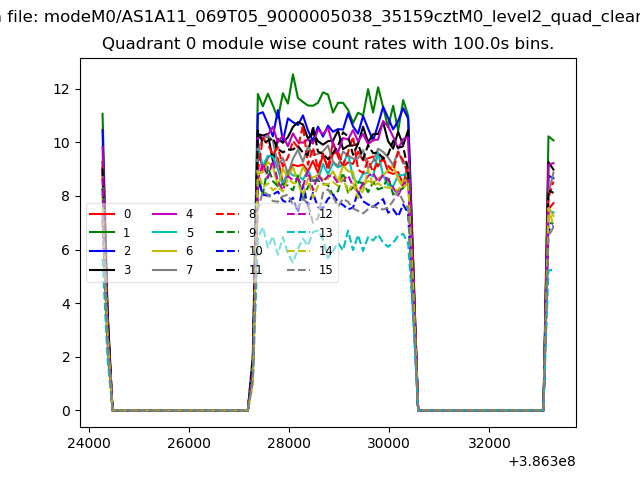 |
 |
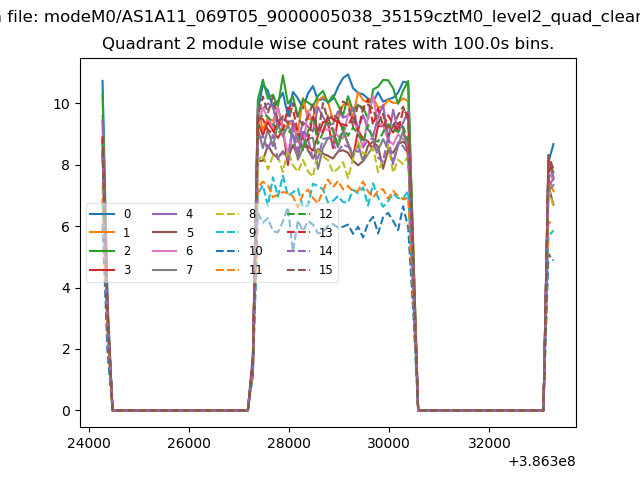
| Module-wise count rates for Quadrant B Data is divided into 100 sec bins |
 |
 |
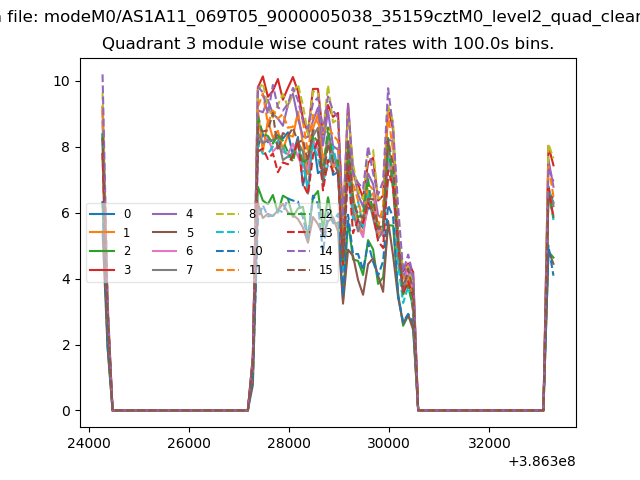
| Module-wise count rates for Quadrant C Data is divided into 100 sec bins |
 |
 |
| Module-wise count rates for Quadrant D Data is divided into 100 sec bins |
 |
 |
| Parameter | Plot |
|---|---|
| CZT HV Monitor | 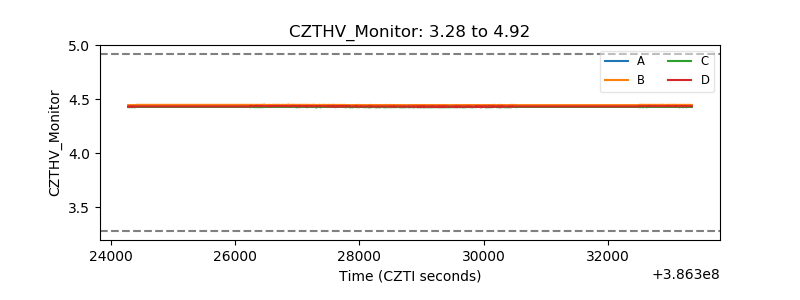 |
| D_VDD | 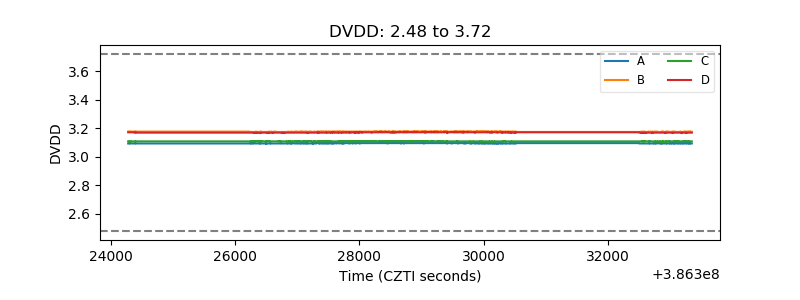 |
| Temperature 1 | 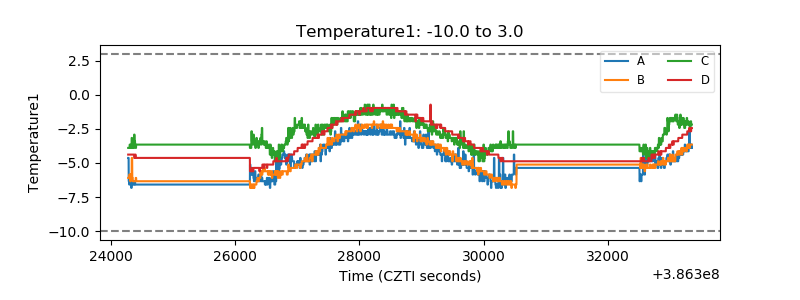 |
| Veto HV Monitor | 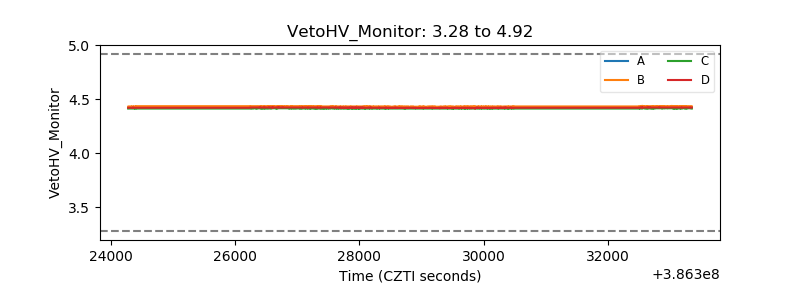 |
| Veto LLD | 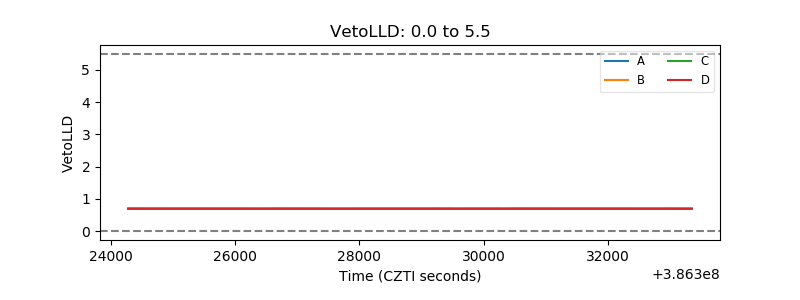 |
| Alpha Counter | 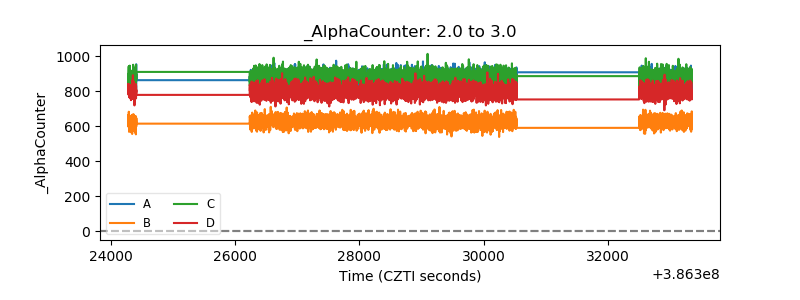 |
| _CPM_Rate | 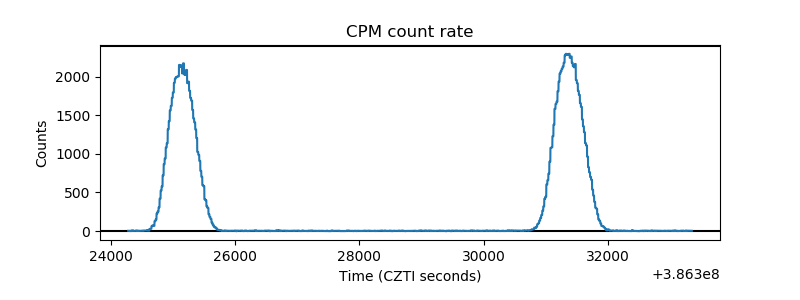 |
| CZT Counter | 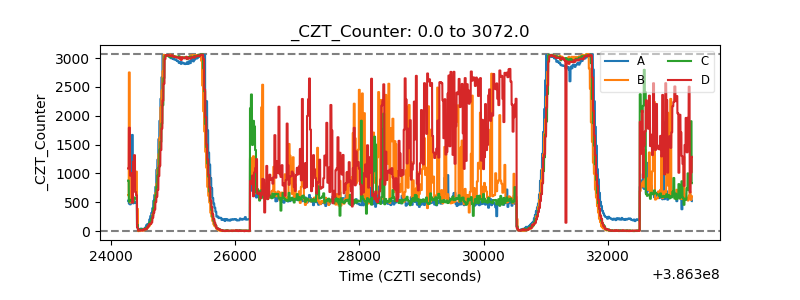 |
| +2.5 Volts monitor | 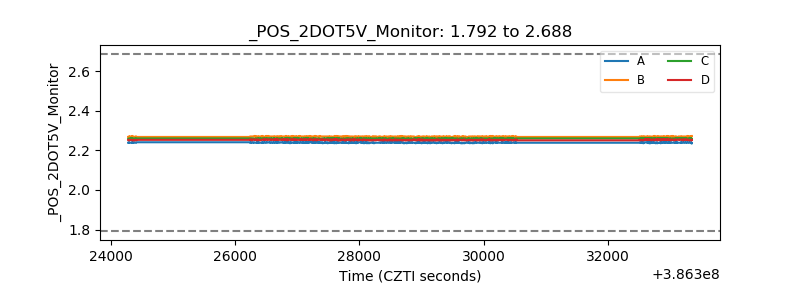 |
| +5 Volts monitor | 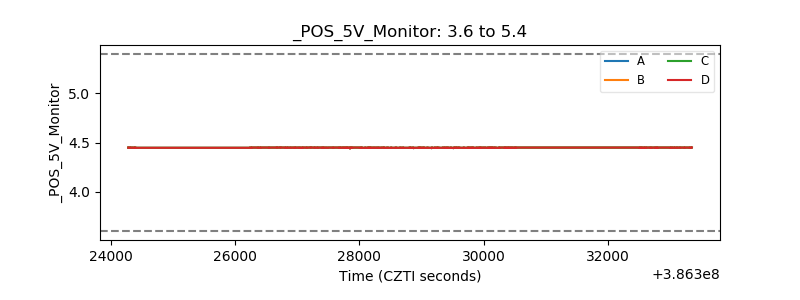 |
| _ROLL_ROT | 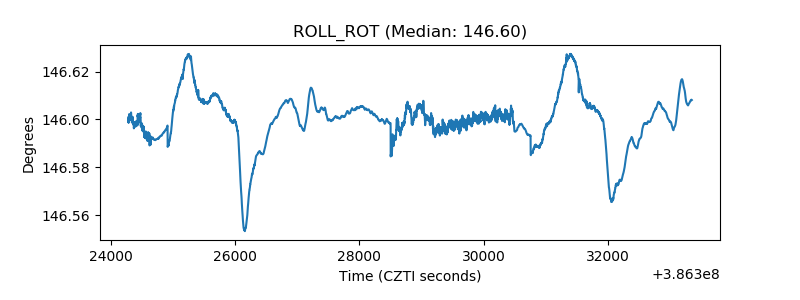 |
| _Roll_DEC | 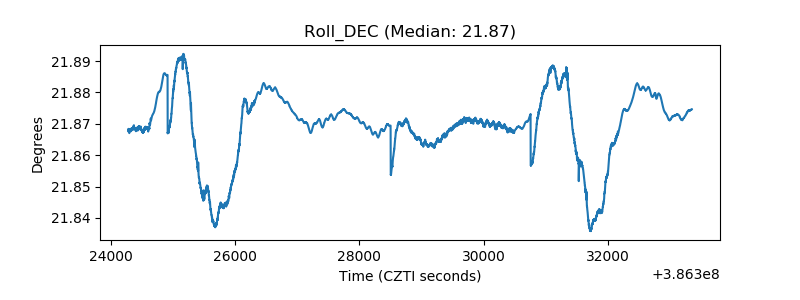 |
| _Roll_RA | 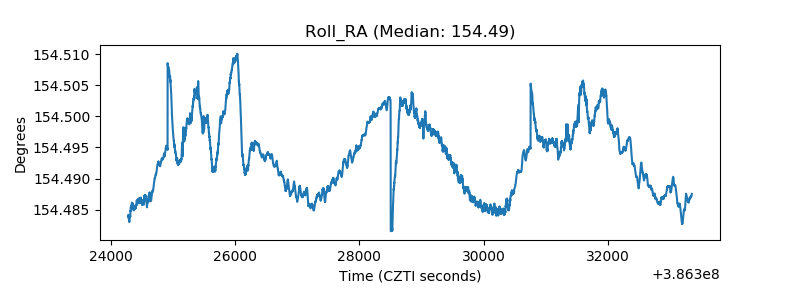 |
| Veto Counter | 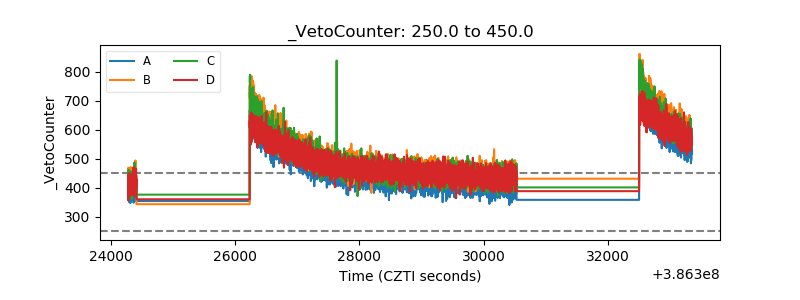 |