| Param | Original file | Final file |
|---|---|---|
| Filename | modeM0/AS1A11_069T01_9000005034_35151cztM0_level2.evt | modeM0/AS1A11_069T01_9000005034_35151cztM0_level2_quad_clean.evt |
| Size (bytes) | 773,015,040 | 73,558,080 |
| Size | 737.2 MB | 70.2 MB |
| Events in quadrant A | 3,882,429 | 483,433 |
| Events in quadrant B | 9,351,381 | 374,523 |
| Events in quadrant C | 3,397,498 | 488,475 |
| Events in quadrant D | 6,366,259 | 452,093 |
| Mode M0 | |||
|---|---|---|---|
| Quadrant | BADHDUFLAG | Total packets | Discarded packets |
| A | 0 | 15388 | 3 |
| B | 0 | 31964 | 2 |
| C | 0 | 13805 | 2 |
| D | 0 | 23294 | 2 |
| Mode M9 | |||
|---|---|---|---|
| Quadrant | BADHDUFLAG | Total packets | Discarded packets |
| A | 0 | 28 | 0 |
| B | 0 | 28 | 0 |
| C | 0 | 28 | 0 |
| D | 0 | 28 | 0 |
| Mode SS | |||
|---|---|---|---|
| Quadrant | BADHDUFLAG | Total packets | Discarded packets |
| A | 0 | 126 | 0 |
| B | 0 | 126 | 0 |
| C | 0 | 126 | 0 |
| D | 0 | 126 | 0 |
| Quadrant | Total seconds | Saturated seconds | Saturation percentage |
|---|---|---|---|
| A | 6126 | 291 | 4.750245% |
| B | 6126 | 2768 | 45.184460% |
| C | 6126 | 69 | 1.126347% |
| D | 6126 | 520 | 8.488410% |
Noise dominated data is calculated using 1-second bins in cleaned event files. If a bin has >2000 counts, and if more than 50% of those come from <1% of pixels, then it is considered to be noise-dominated and hence unusable.
| Quadrant | # 1 sec bins | Bins with >0 counts | Bins with >2000 counts | High rate bins dominated by noise | Noise dominated (total time) | Noise dominated (detector-on time) | Marked lightcurve |
|---|---|---|---|---|---|---|---|
| A | 8932 | 6128 | 223 | 223 | 2.50% | 3.64% | 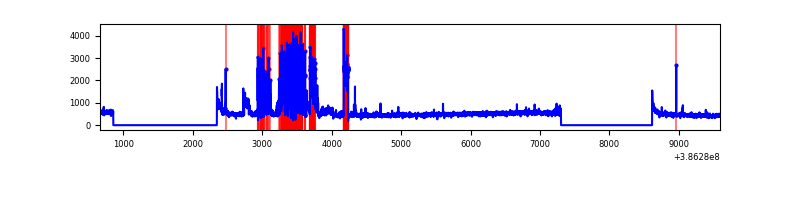 |
| B | 8931 | 6126 | 1802 | 1802 | 20.18% | 29.42% | 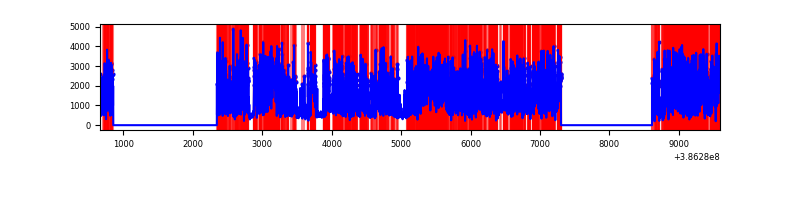 |
| C | 8932 | 6128 | 56 | 56 | 0.63% | 0.91% | 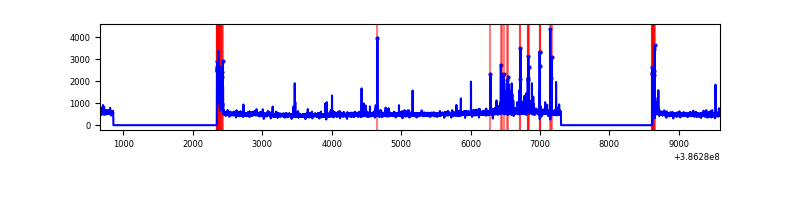 |
| D | 8932 | 6128 | 497 | 497 | 5.56% | 8.11% | 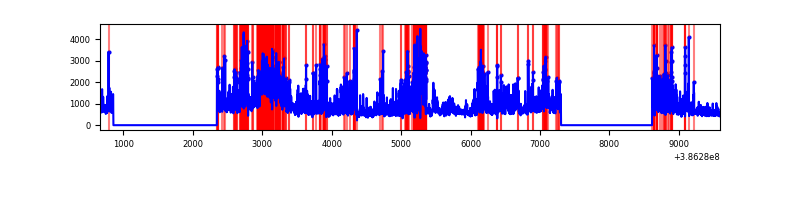 |
Top three noisy pixels from each quadrant. If the there are fewer than three noisy pixels in the level2.evt file, extra rows are filled as -1
| Pixel properties | Quadrant properties | ||||||
|---|---|---|---|---|---|---|---|
| Quadrant | DetID | PixID | Counts | Sigma | Mean | Median | Sigma |
| A | 15 | 169 | 1013577 | 7115.79 | 704 | 690 | 142.3 |
| A | 10 | 83 | 94248 | 657.27 | 704 | 690 | 142.3 |
| A | 9 | 143 | 33504 | 230.53 | 704 | 690 | 142.3 |
| B | 5 | 236 | 6758411 | 60573.92 | 570 | 554 | 111.6 |
| B | 5 | 172 | 293330 | 2624.29 | 570 | 554 | 111.6 |
| B | 4 | 232 | 34819 | 307.13 | 570 | 554 | 111.6 |
| C | 0 | 10 | 304480 | 1854.03 | 698 | 703 | 163.8 |
| C | 15 | 214 | 259202 | 1577.69 | 698 | 703 | 163.8 |
| C | 0 | 207 | 74649 | 451.31 | 698 | 703 | 163.8 |
| D | 8 | 195 | 1874637 | 11191.86 | 681 | 664 | 167.4 |
| D | 5 | 223 | 561219 | 3347.78 | 681 | 664 | 167.4 |
| D | 13 | 249 | 383869 | 2288.6 | 681 | 664 | 167.4 |
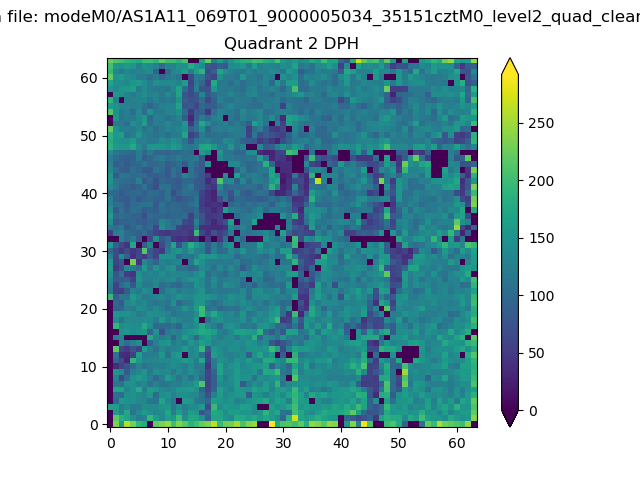
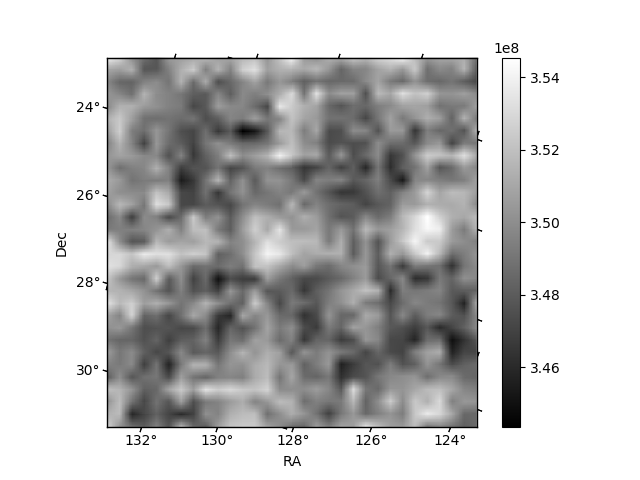
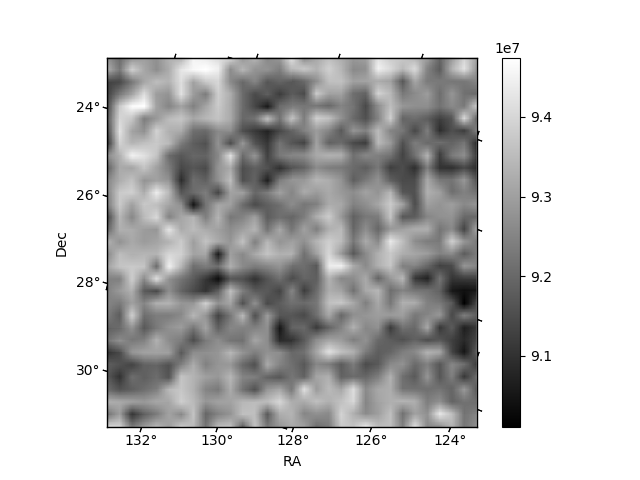
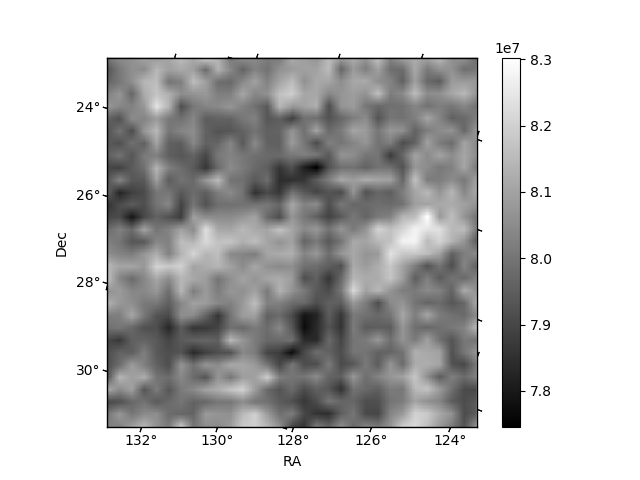
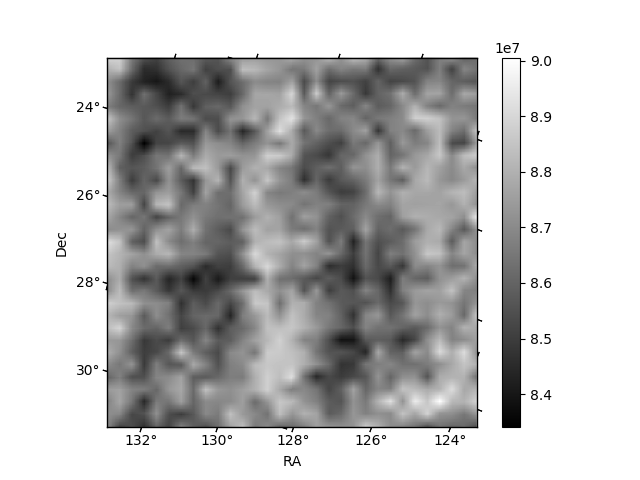
Histogram calculated using DETX and DETY for each event in the final _common_clean file
| Quadrant A | 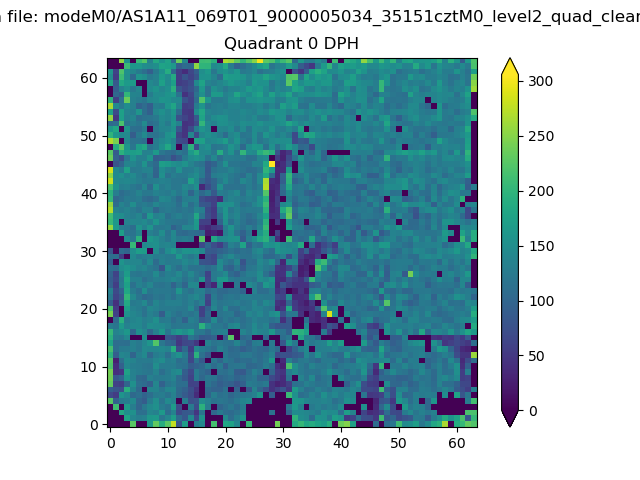 |
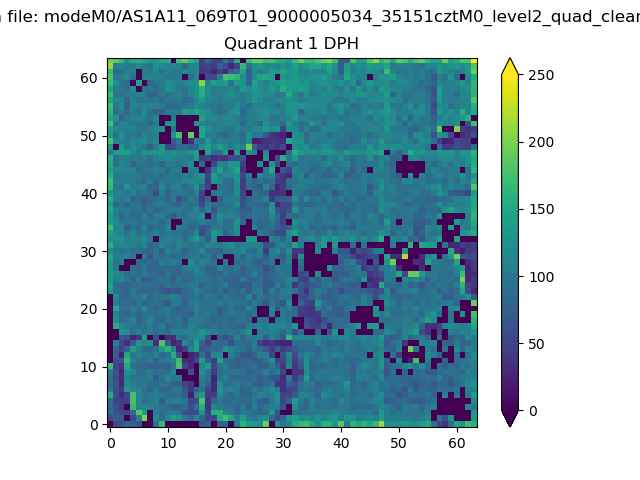 |
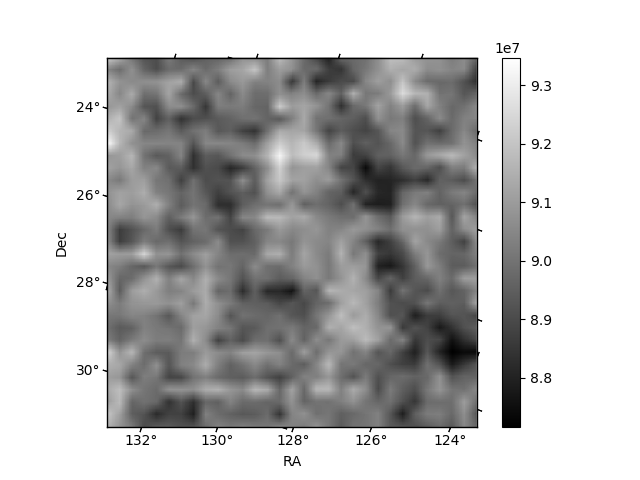
Quadrant B |
|---|---|---|---|
| Quadrant D | 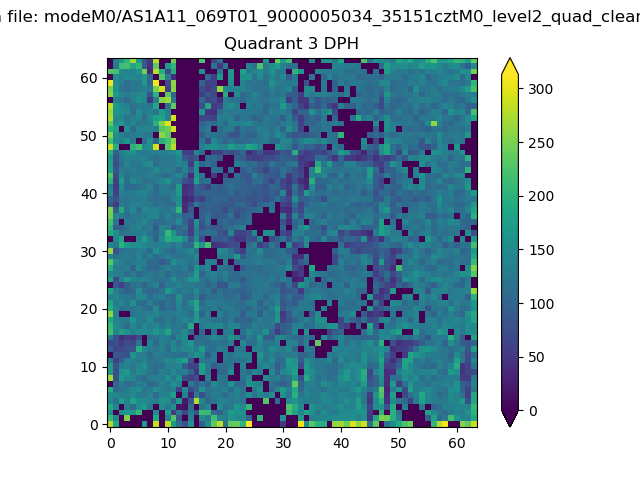 |
 |
Quadrant C |
| Plot type | Count rate plots | Images |
|---|---|---|
| Comparison with Poisson distribution Blue bars denote a histogram of data divided into 1 sec bins. Red curve is a Poisson curve with rate = median count rate of data. |
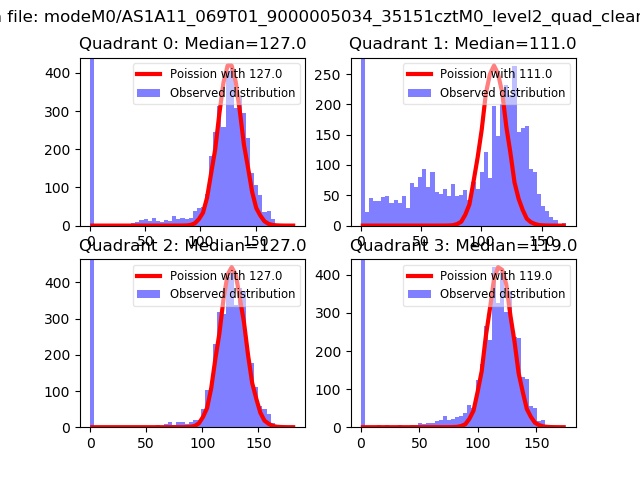 |
 |
| Quadrant-wise count rates Data is divided into 100 sec bins |
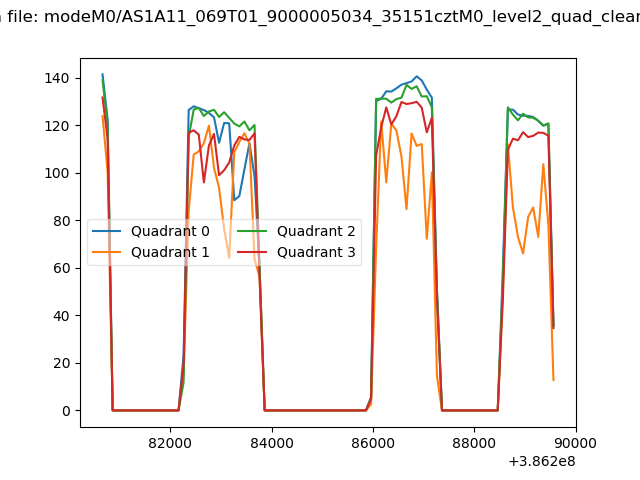 |
|
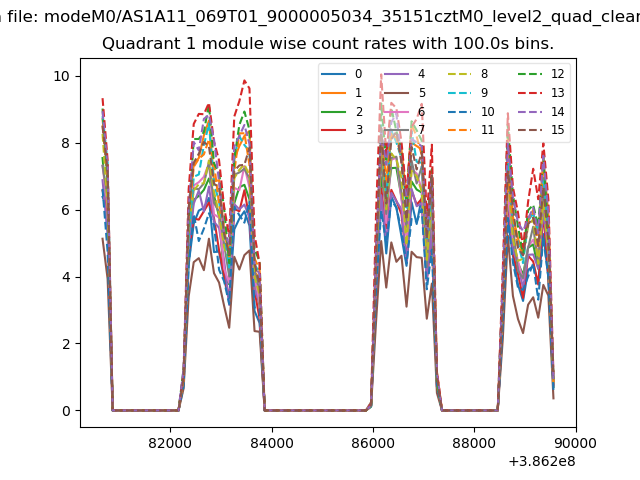
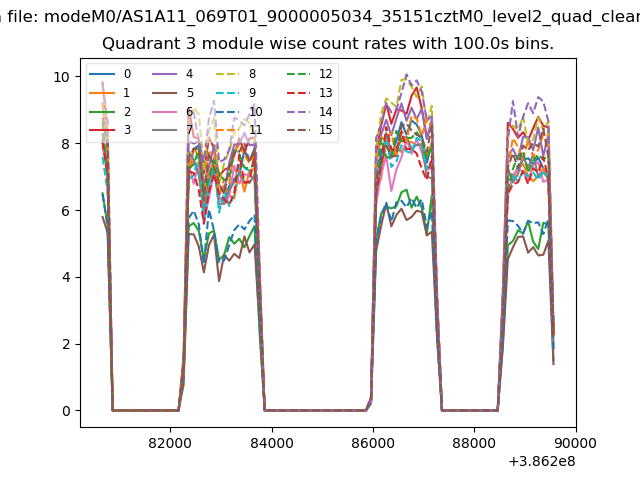
| Module-wise count rates for Quadrant A Data is divided into 100 sec bins |
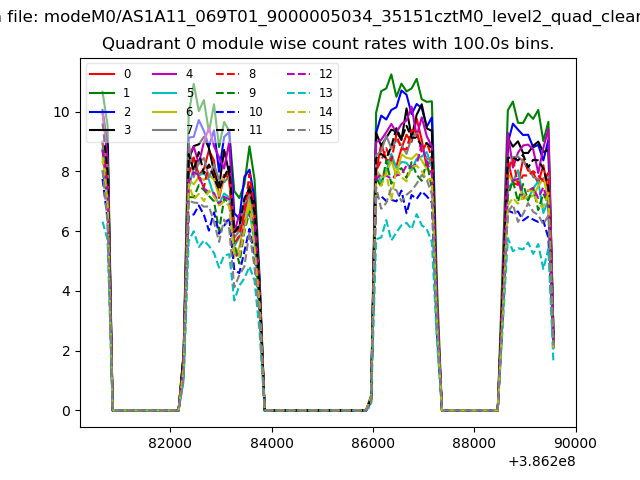 |
 |
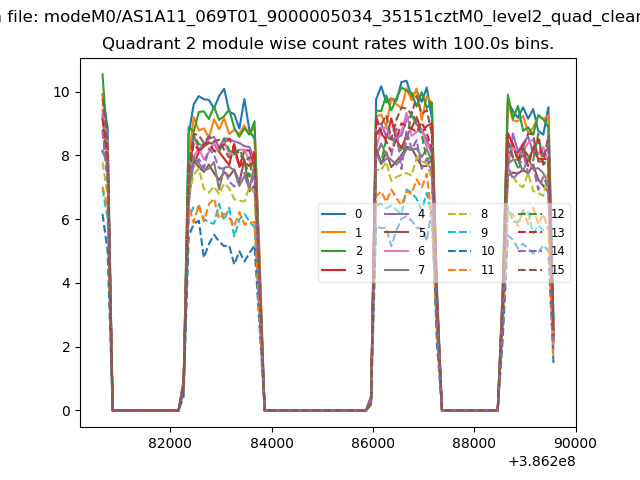
| Module-wise count rates for Quadrant B Data is divided into 100 sec bins |
 |
 |
| Module-wise count rates for Quadrant C Data is divided into 100 sec bins |
 |
 |
| Module-wise count rates for Quadrant D Data is divided into 100 sec bins |
 |
 |
| Parameter | Plot |
|---|---|
| CZT HV Monitor | 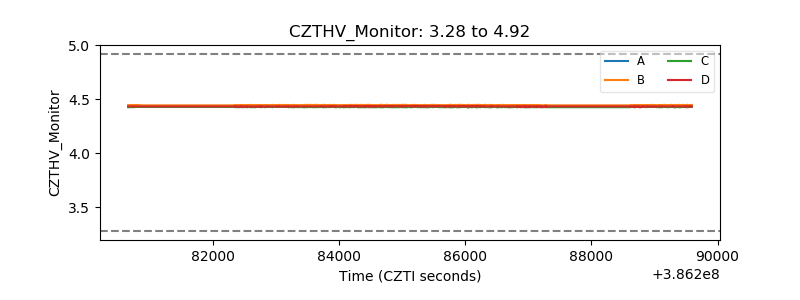 |
| D_VDD | 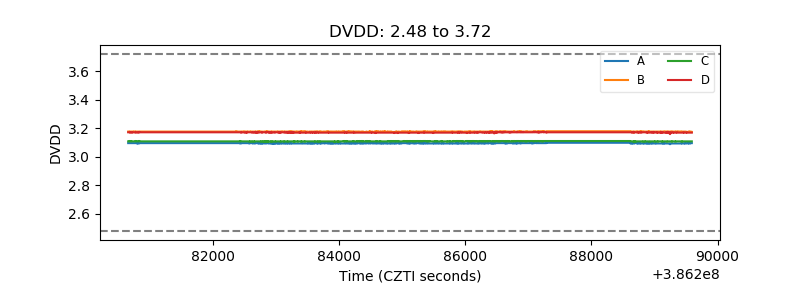 |
| Temperature 1 | 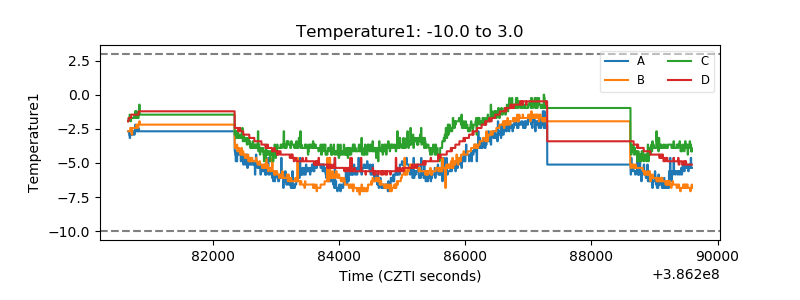 |
| Veto HV Monitor | 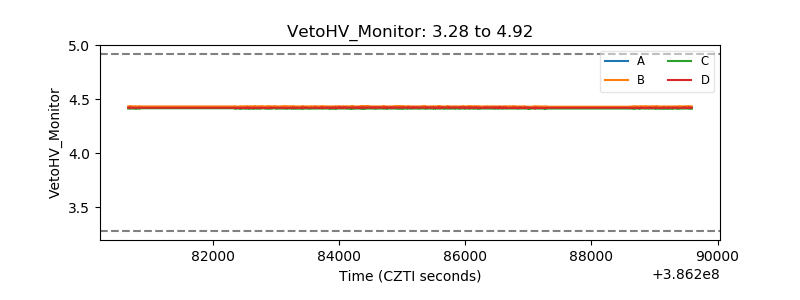 |
| Veto LLD | 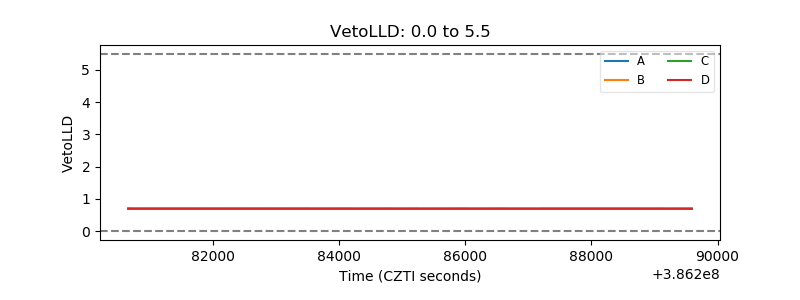 |
| Alpha Counter | 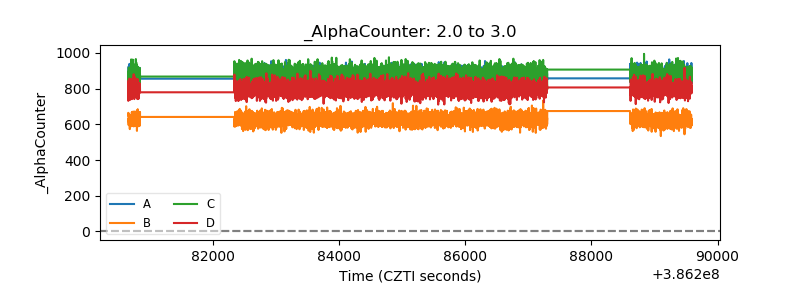 |
| _CPM_Rate | 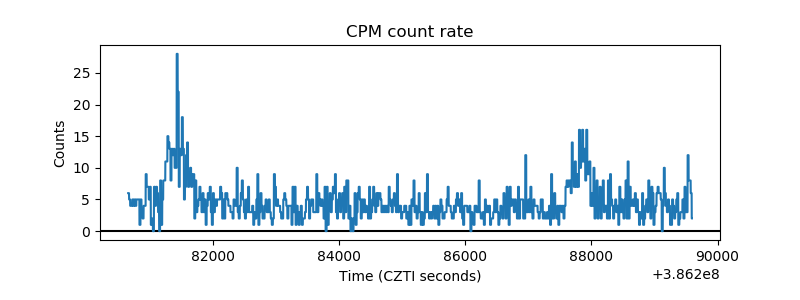 |
| CZT Counter | 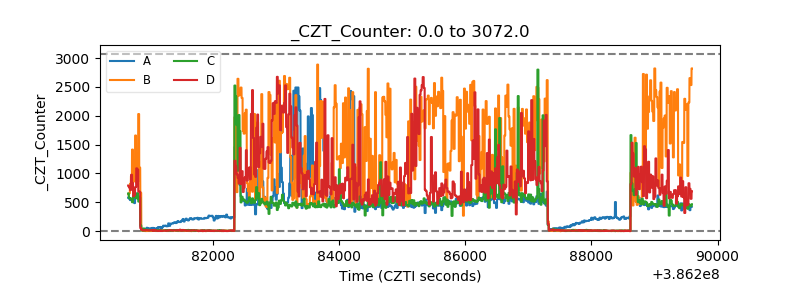 |
| +2.5 Volts monitor | 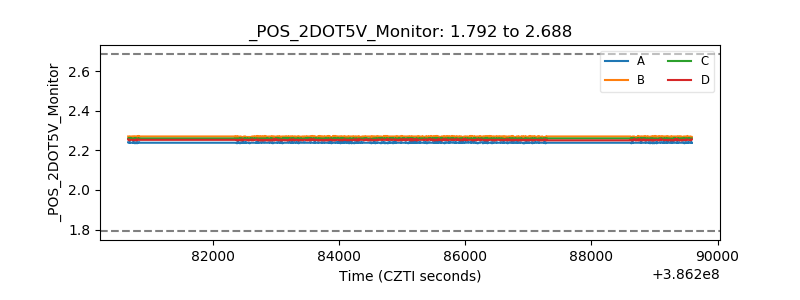 |
| +5 Volts monitor | 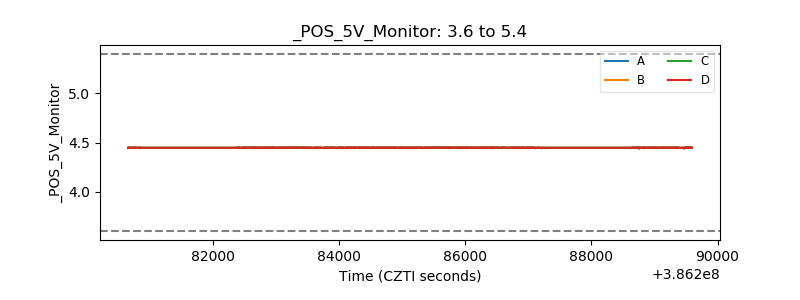 |
| _ROLL_ROT | 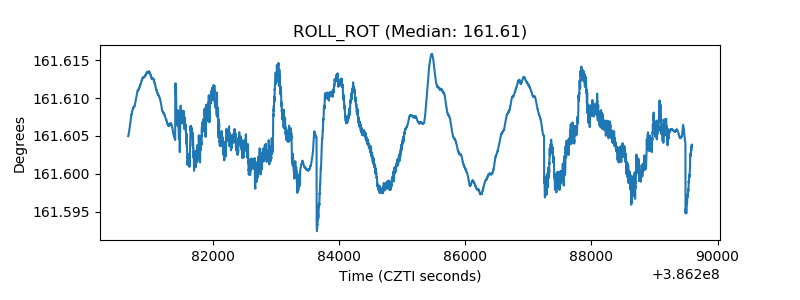 |
| _Roll_DEC | 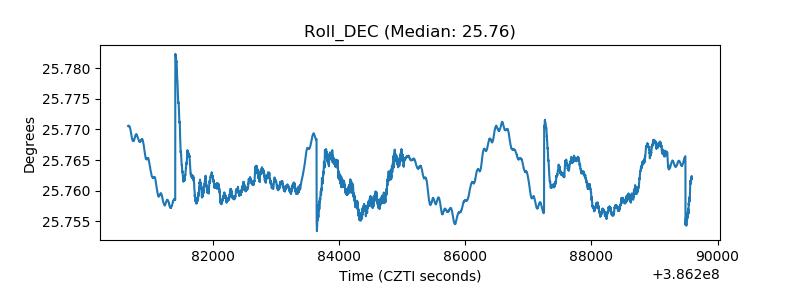 |
| _Roll_RA | 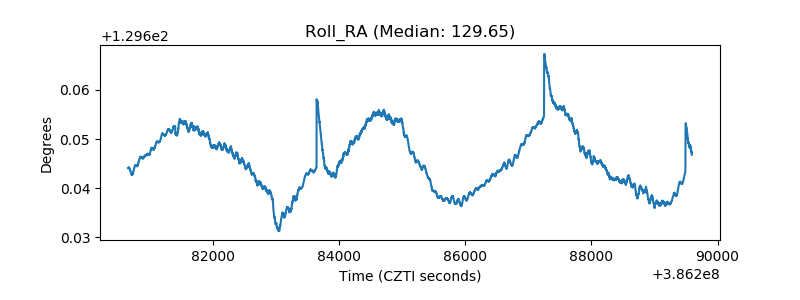 |
| Veto Counter | 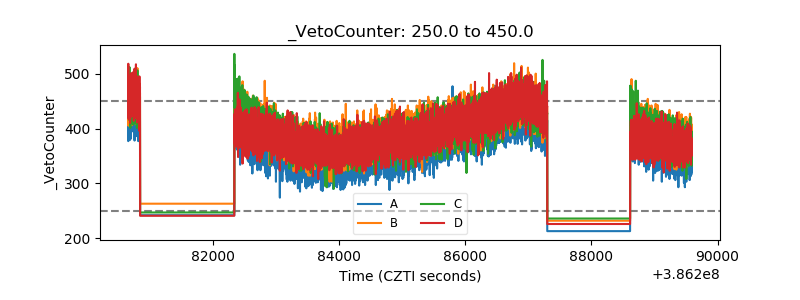 |