| Param | Original file | Final file |
|---|---|---|
| Filename | modeM0/AS1A11_069T01_9000005034_35149cztM0_level2.evt | modeM0/AS1A11_069T01_9000005034_35149cztM0_level2_quad_clean.evt |
| Size (bytes) | 435,363,840 | 32,564,160 |
| Size | 415.2 MB | 31.1 MB |
| Events in quadrant A | 4,776,482 | 172,781 |
| Events in quadrant B | 3,043,713 | 183,424 |
| Events in quadrant C | 1,975,681 | 189,584 |
| Events in quadrant D | 3,143,208 | 182,772 |
| Mode M0 | |||
|---|---|---|---|
| Quadrant | BADHDUFLAG | Total packets | Discarded packets |
| A | 0 | 16670 | 2 |
| B | 0 | 11503 | 1 |
| C | 0 | 7960 | 1 |
| D | 0 | 11923 | 1 |
| Mode M9 | |||
|---|---|---|---|
| Quadrant | BADHDUFLAG | Total packets | Discarded packets |
| A | 0 | 18 | 0 |
| B | 0 | 18 | 0 |
| C | 0 | 18 | 0 |
| D | 0 | 18 | 0 |
| Mode SS | |||
|---|---|---|---|
| Quadrant | BADHDUFLAG | Total packets | Discarded packets |
| A | 0 | 74 | 0 |
| B | 0 | 74 | 0 |
| C | 0 | 74 | 0 |
| D | 0 | 74 | 0 |
| Quadrant | Total seconds | Saturated seconds | Saturation percentage |
|---|---|---|---|
| A | 3620 | 962 | 26.574586% |
| B | 3620 | 417 | 11.519337% |
| C | 3620 | 74 | 2.044199% |
| D | 3620 | 121 | 3.342541% |
Noise dominated data is calculated using 1-second bins in cleaned event files. If a bin has >2000 counts, and if more than 50% of those come from <1% of pixels, then it is considered to be noise-dominated and hence unusable.
| Quadrant | # 1 sec bins | Bins with >0 counts | Bins with >2000 counts | High rate bins dominated by noise | Noise dominated (total time) | Noise dominated (detector-on time) | Marked lightcurve |
|---|---|---|---|---|---|---|---|
| A | 5473 | 3621 | 560 | 560 | 10.23% | 15.47% | 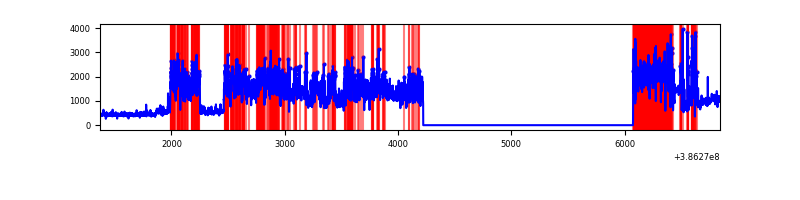 |
| B | 5473 | 3621 | 251 | 251 | 4.59% | 6.93% | 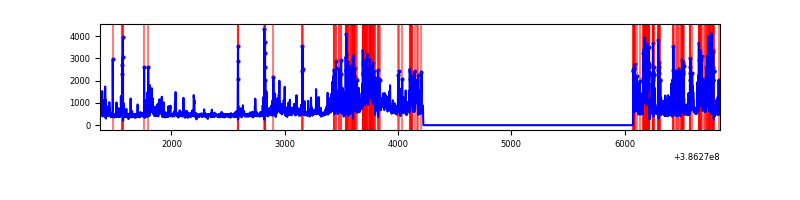 |
| C | 5473 | 3621 | 50 | 50 | 0.91% | 1.38% | 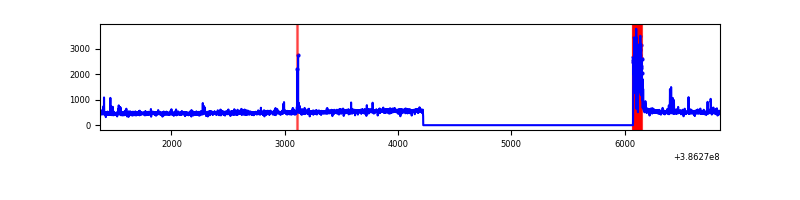 |
| D | 5473 | 3621 | 104 | 104 | 1.90% | 2.87% | 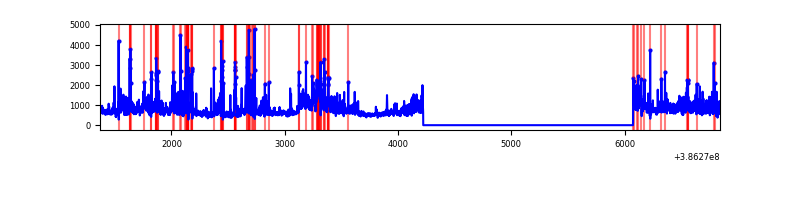 |
Top three noisy pixels from each quadrant. If the there are fewer than three noisy pixels in the level2.evt file, extra rows are filled as -1
| Pixel properties | Quadrant properties | ||||||
|---|---|---|---|---|---|---|---|
| Quadrant | DetID | PixID | Counts | Sigma | Mean | Median | Sigma |
| A | 15 | 169 | 3181465 | 39483.63 | 396 | 389 | 80.6 |
| A | 10 | 83 | 40198 | 494.11 | 396 | 389 | 80.6 |
| A | 9 | 143 | 14187 | 171.26 | 396 | 389 | 80.6 |
| B | 5 | 236 | 1189634 | 15183.68 | 404 | 393 | 78.3 |
| B | 5 | 172 | 182024 | 2318.98 | 404 | 393 | 78.3 |
| B | 4 | 232 | 40794 | 515.82 | 404 | 393 | 78.3 |
| C | 0 | 10 | 181244 | 1849.53 | 413 | 416 | 97.8 |
| C | 15 | 214 | 149211 | 1521.9 | 413 | 416 | 97.8 |
| C | 9 | 69 | 12185 | 120.37 | 413 | 416 | 97.8 |
| D | 8 | 195 | 916636 | 9050.87 | 410 | 399 | 101.2 |
| D | 13 | 249 | 251403 | 2479.49 | 410 | 399 | 101.2 |
| D | 2 | 250 | 224361 | 2212.36 | 410 | 399 | 101.2 |
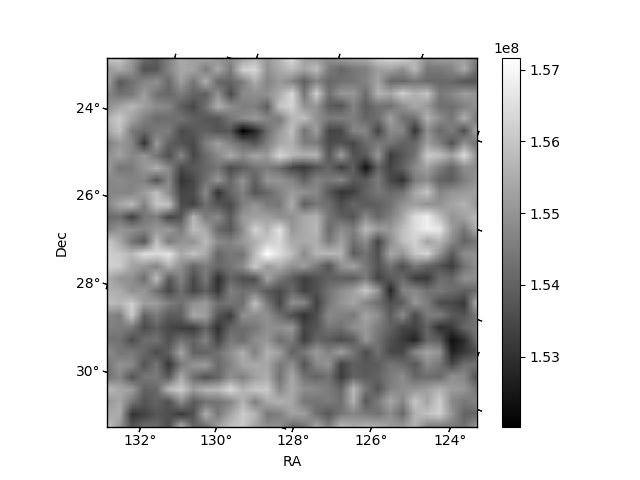
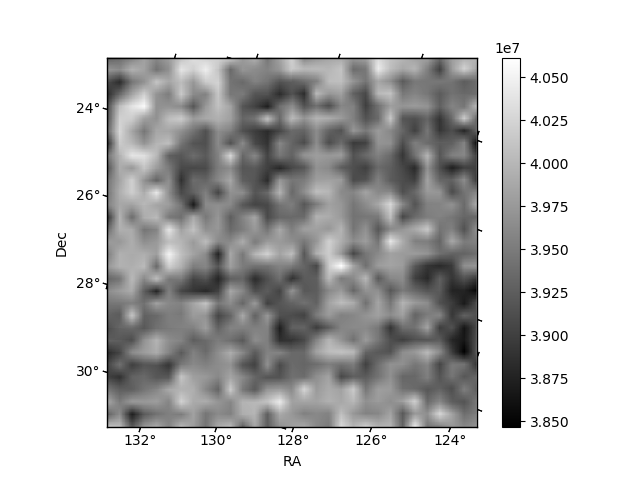
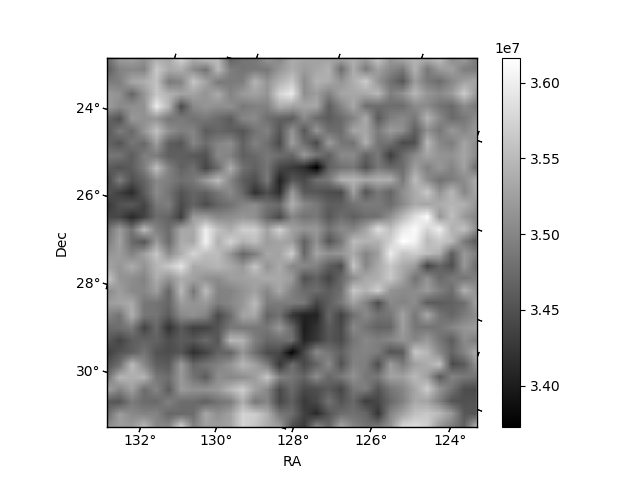
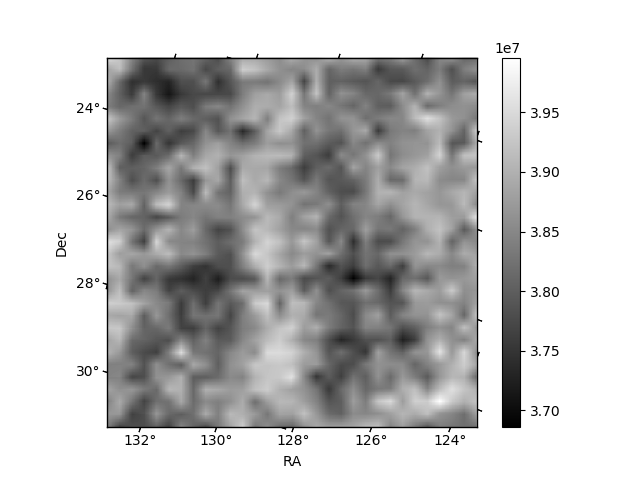
Histogram calculated using DETX and DETY for each event in the final _common_clean file
| Quadrant A | 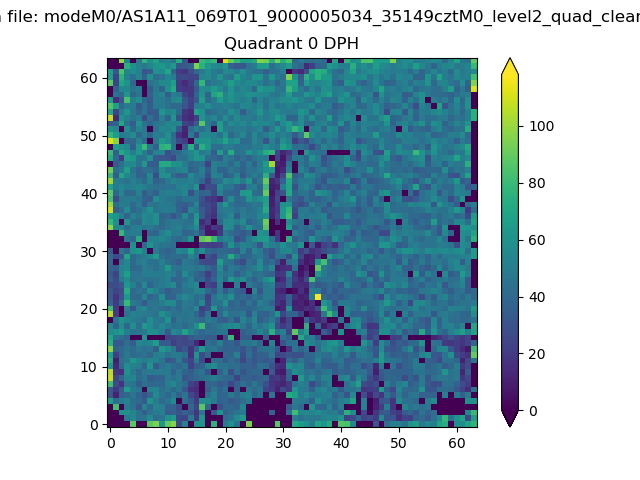 |
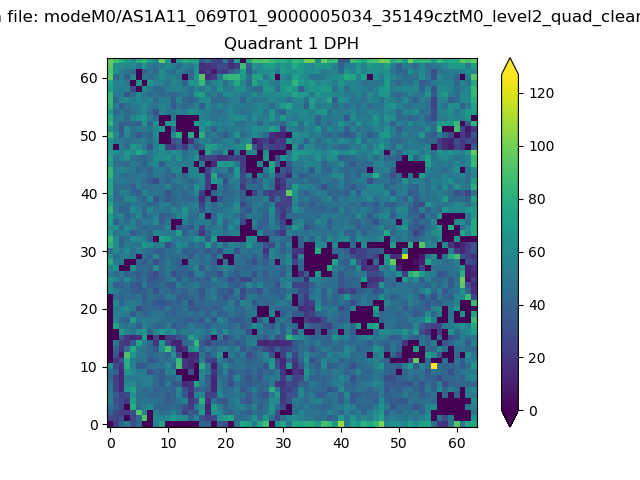 |
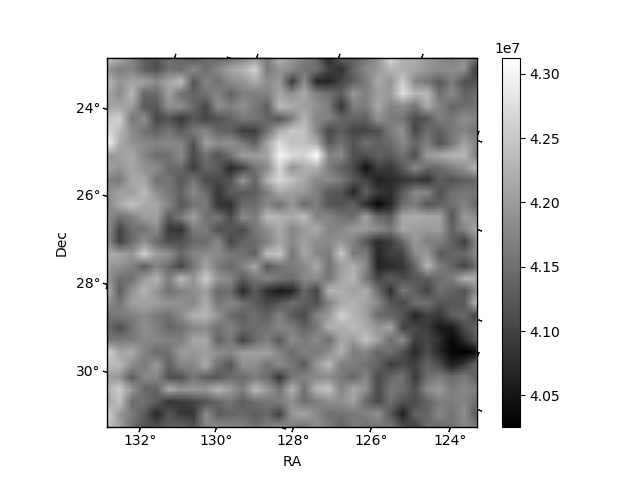
Quadrant B |
|---|---|---|---|
| Quadrant D | 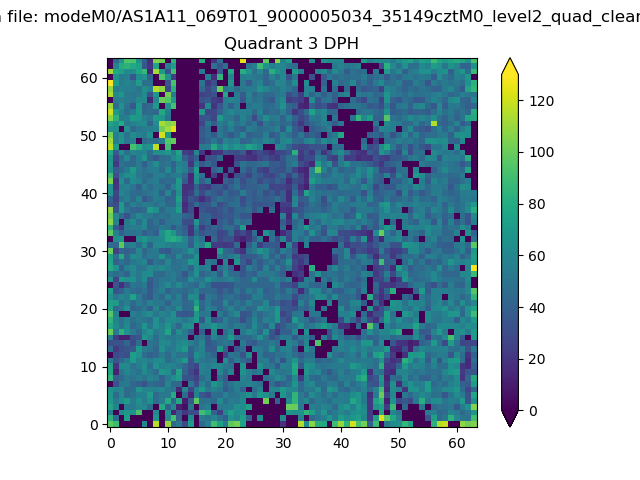 |
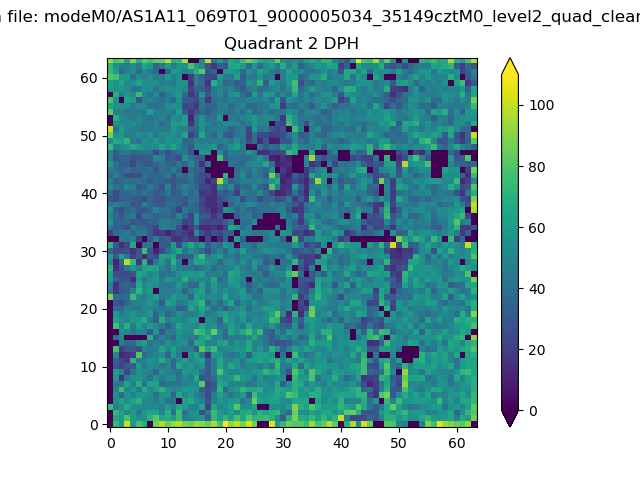 |
Quadrant C |
| Plot type | Count rate plots | Images |
|---|---|---|
| Comparison with Poisson distribution Blue bars denote a histogram of data divided into 1 sec bins. Red curve is a Poisson curve with rate = median count rate of data. |
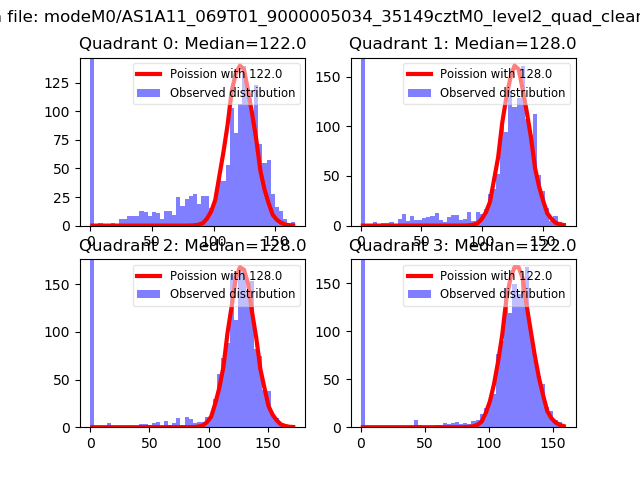 |
 |
| Quadrant-wise count rates Data is divided into 100 sec bins |
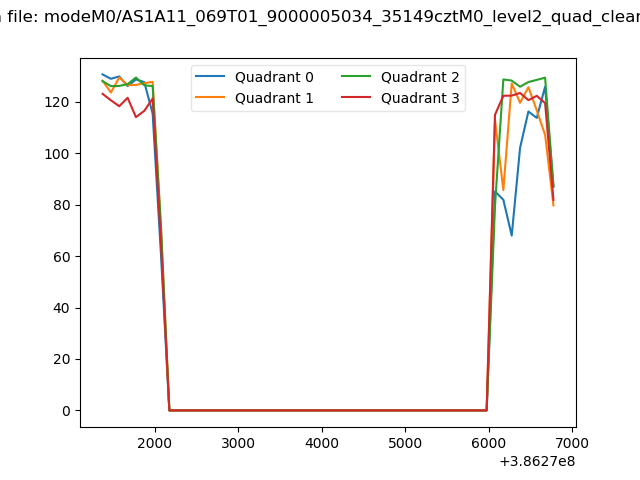 |
|
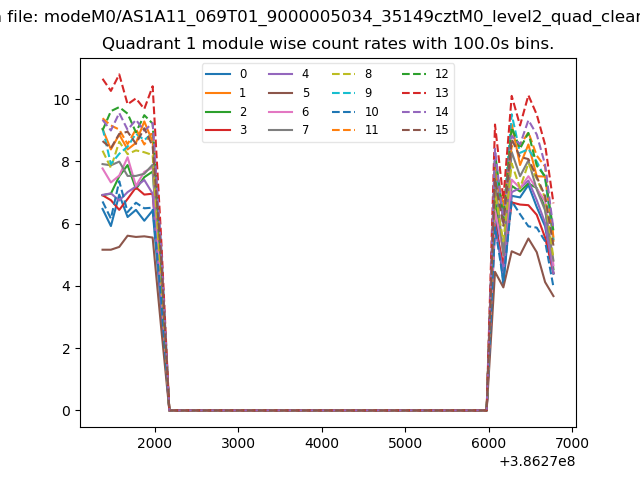
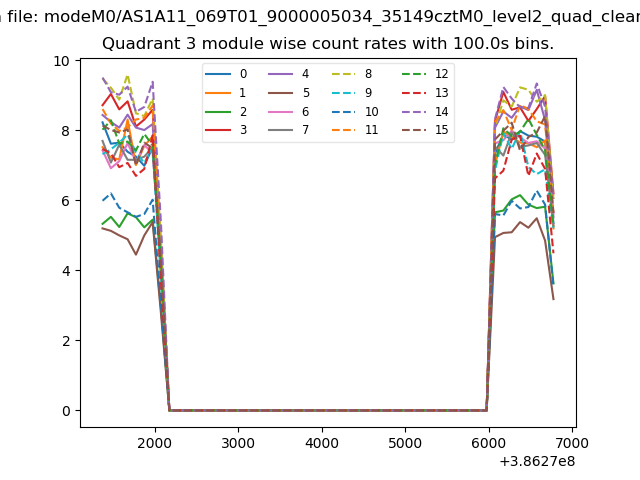
| Module-wise count rates for Quadrant A Data is divided into 100 sec bins |
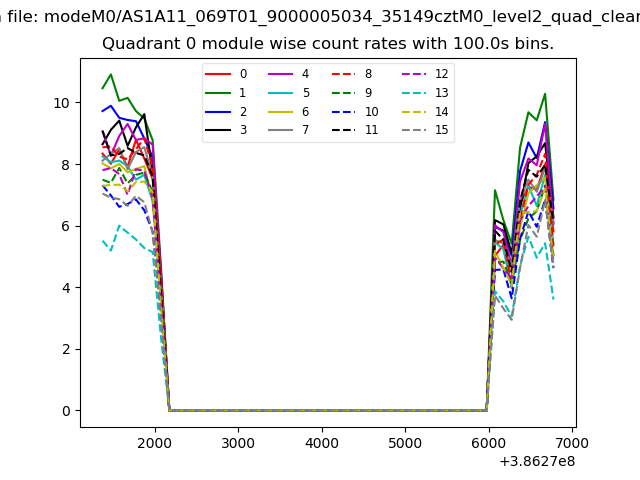 |
 |
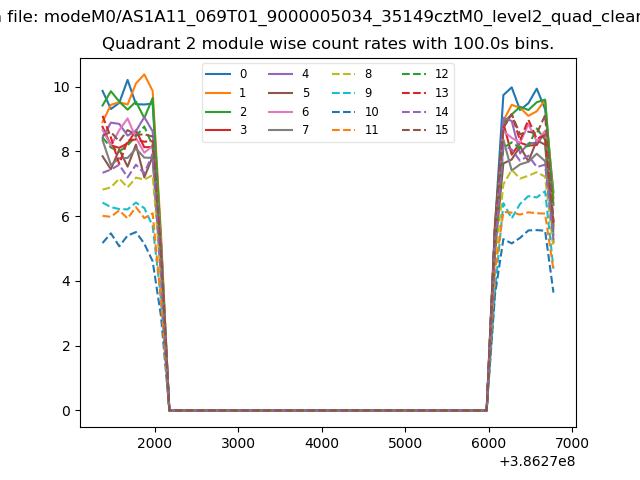
| Module-wise count rates for Quadrant B Data is divided into 100 sec bins |
 |
 |
| Module-wise count rates for Quadrant C Data is divided into 100 sec bins |
 |
 |
| Module-wise count rates for Quadrant D Data is divided into 100 sec bins |
 |
 |
| Parameter | Plot |
|---|---|
| CZT HV Monitor | 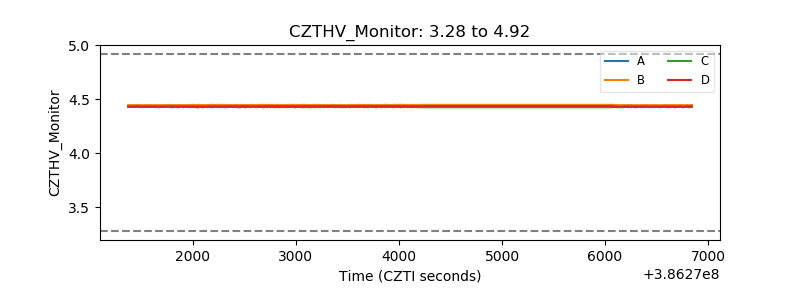 |
| D_VDD | 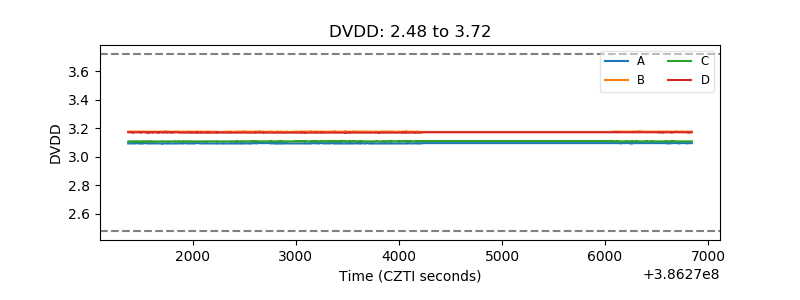 |
| Temperature 1 | 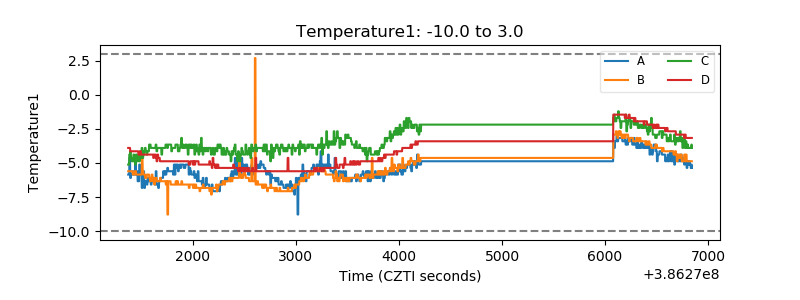 |
| Veto HV Monitor | 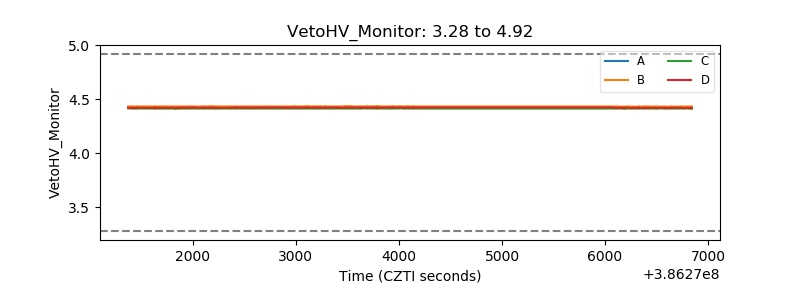 |
| Veto LLD | 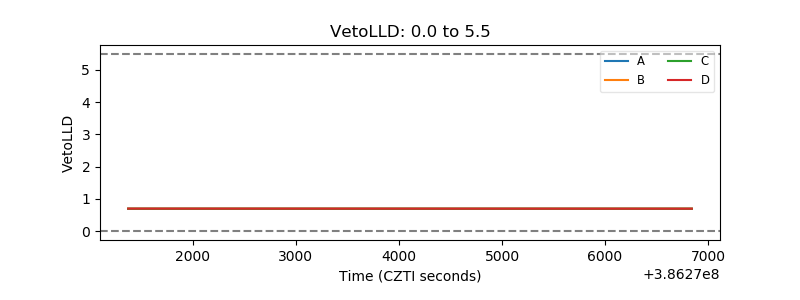 |
| Alpha Counter | 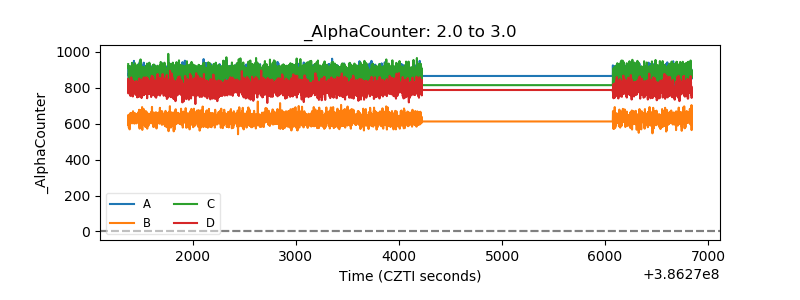 |
| _CPM_Rate | 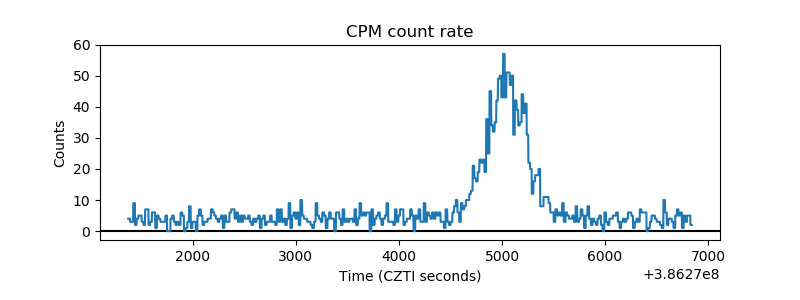 |
| CZT Counter | 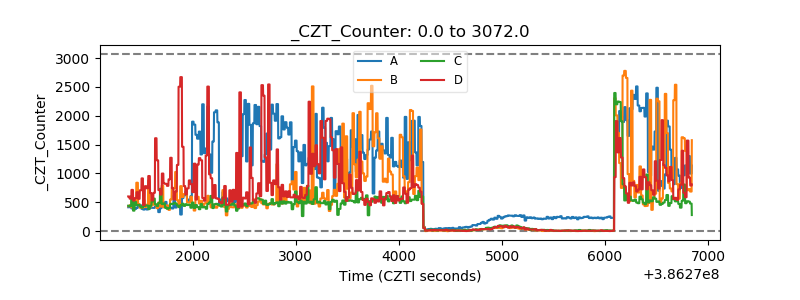 |
| +2.5 Volts monitor | 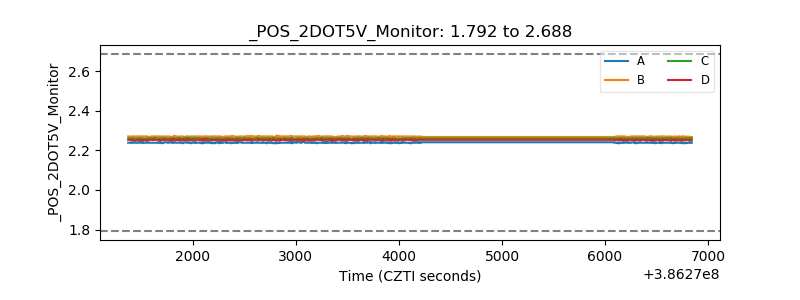 |
| +5 Volts monitor | 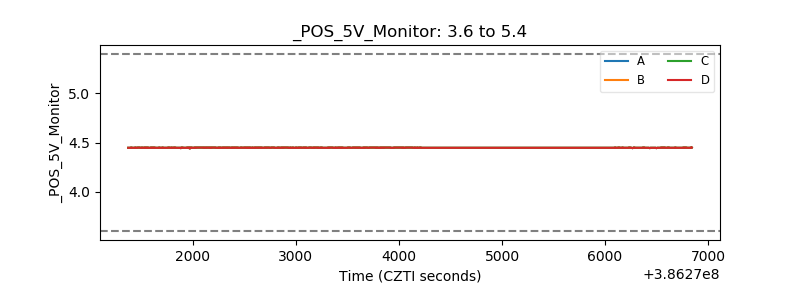 |
| _ROLL_ROT | 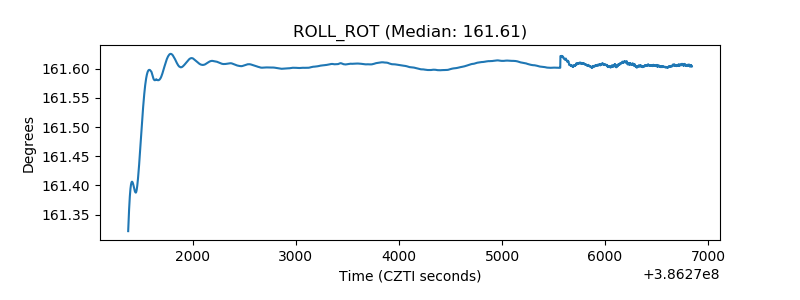 |
| _Roll_DEC | 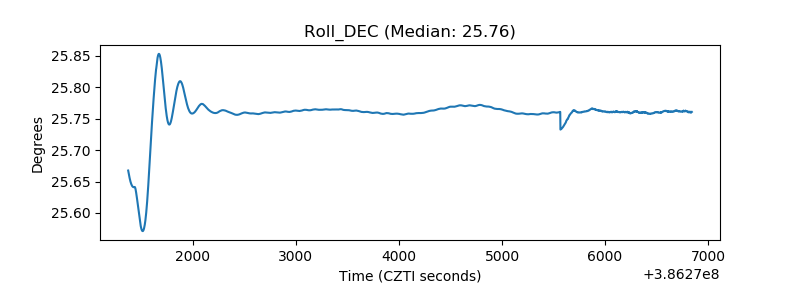 |
| _Roll_RA | 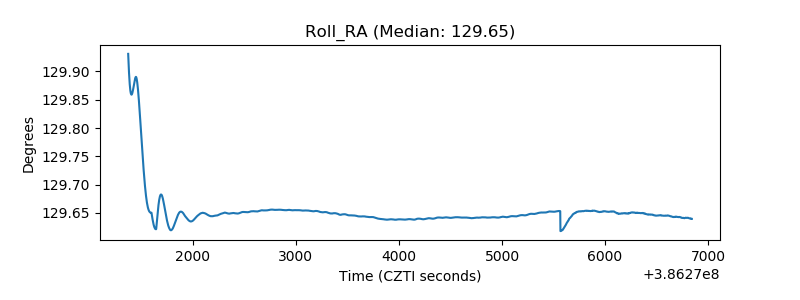 |
| Veto Counter | 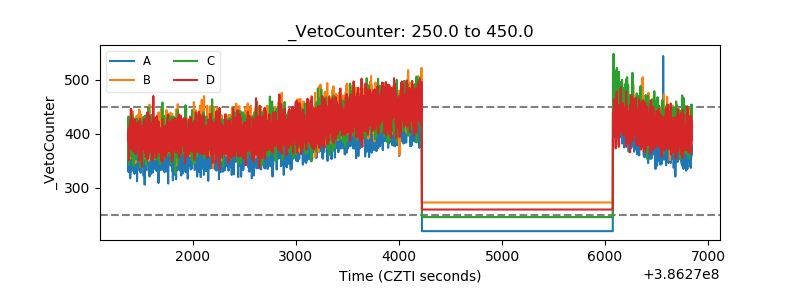 |