| Param | Original file | Final file |
|---|---|---|
| Filename | modeM0/AS1A11_065T05_9000005032_35149cztM0_level2.evt | modeM0/AS1A11_065T05_9000005032_35149cztM0_level2_quad_clean.evt |
| Size (bytes) | 128,537,280 | 21,024,000 |
| Size | 122.6 MB | 20.1 MB |
| Events in quadrant A | 855,517 | 141,984 |
| Events in quadrant B | 1,037,247 | 140,980 |
| Events in quadrant C | 769,508 | 139,973 |
| Events in quadrant D | 1,154,695 | 130,826 |
| Mode M0 | |||
|---|---|---|---|
| Quadrant | BADHDUFLAG | Total packets | Discarded packets |
| A | 0 | 3204 | 1 |
| B | 0 | 3780 | 1 |
| C | 0 | 2925 | 1 |
| D | 0 | 4232 | 1 |
| Mode M9 | |||
|---|---|---|---|
| Quadrant | BADHDUFLAG | Total packets | Discarded packets |
| A | 0 | 8 | 0 |
| B | 0 | 8 | 0 |
| C | 0 | 8 | 0 |
| D | 0 | 9 | 0 |
| Mode SS | |||
|---|---|---|---|
| Quadrant | BADHDUFLAG | Total packets | Discarded packets |
| A | 0 | 20 | 0 |
| B | 0 | 20 | 0 |
| C | 0 | 20 | 0 |
| D | 0 | 20 | 0 |
| Quadrant | Total seconds | Saturated seconds | Saturation percentage |
|---|---|---|---|
| A | 1081 | 191 | 17.668825% |
| B | 1081 | 189 | 17.483811% |
| C | 1081 | 79 | 7.308048% |
| D | 1081 | 136 | 12.580944% |
Noise dominated data is calculated using 1-second bins in cleaned event files. If a bin has >2000 counts, and if more than 50% of those come from <1% of pixels, then it is considered to be noise-dominated and hence unusable.
| Quadrant | # 1 sec bins | Bins with >0 counts | Bins with >2000 counts | High rate bins dominated by noise | Noise dominated (total time) | Noise dominated (detector-on time) | Marked lightcurve |
|---|---|---|---|---|---|---|---|
| A | 1081 | 1081 | 88 | 88 | 8.14% | 8.14% | 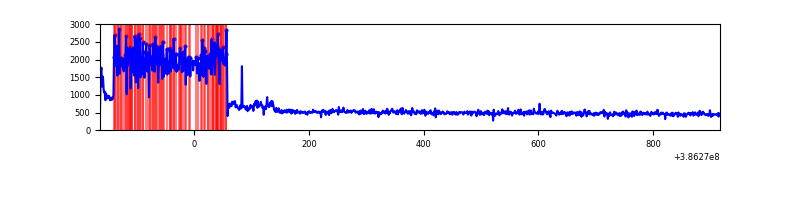 |
| B | 1081 | 1081 | 109 | 109 | 10.08% | 10.08% | 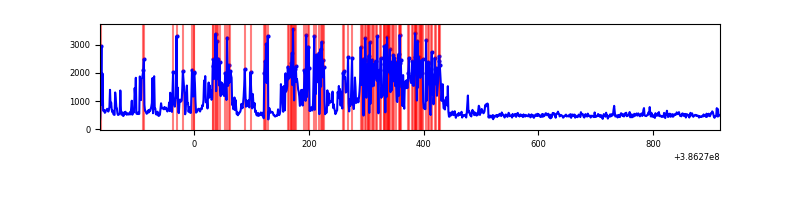 |
| C | 1081 | 1081 | 52 | 52 | 4.81% | 4.81% | 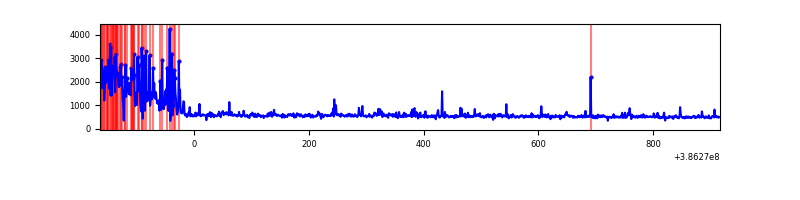 |
| D | 1081 | 1081 | 96 | 96 | 8.88% | 8.88% | 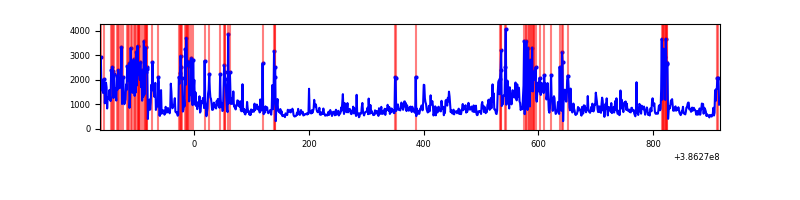 |
Top three noisy pixels from each quadrant. If the there are fewer than three noisy pixels in the level2.evt file, extra rows are filled as -1
| Pixel properties | Quadrant properties | ||||||
|---|---|---|---|---|---|---|---|
| Quadrant | DetID | PixID | Counts | Sigma | Mean | Median | Sigma |
| A | 15 | 169 | 320519 | 11369.76 | 129 | 126 | 28.2 |
| A | 10 | 83 | 32976 | 1165.75 | 129 | 126 | 28.2 |
| A | 13 | 6 | 2314 | 77.65 | 129 | 126 | 28.2 |
| B | 5 | 236 | 488371 | 18770.3 | 124 | 121 | 26.0 |
| B | 4 | 232 | 45462 | 1743.09 | 124 | 121 | 26.0 |
| B | 5 | 172 | 12995 | 494.93 | 124 | 121 | 26.0 |
| C | 0 | 10 | 229723 | 7325.22 | 126 | 126 | 31.3 |
| C | 15 | 214 | 47125 | 1499.49 | 126 | 126 | 31.3 |
| C | 13 | 61 | 872 | 23.8 | 126 | 126 | 31.3 |
| D | 13 | 249 | 301106 | 9183.08 | 126 | 123 | 32.8 |
| D | 8 | 195 | 218326 | 6657.44 | 126 | 123 | 32.8 |
| D | 7 | 80 | 63406 | 1930.78 | 126 | 123 | 32.8 |
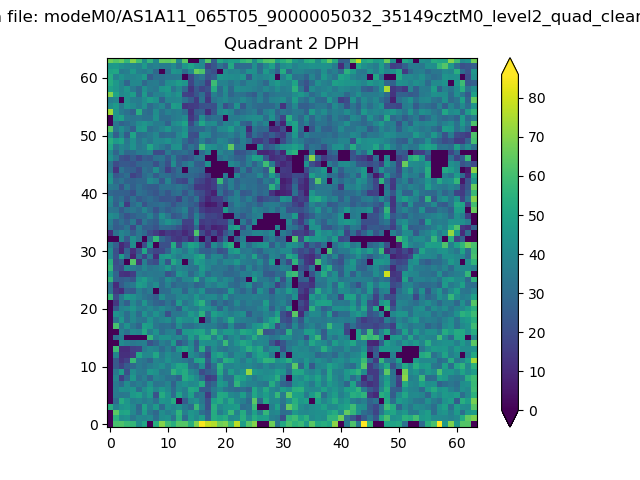
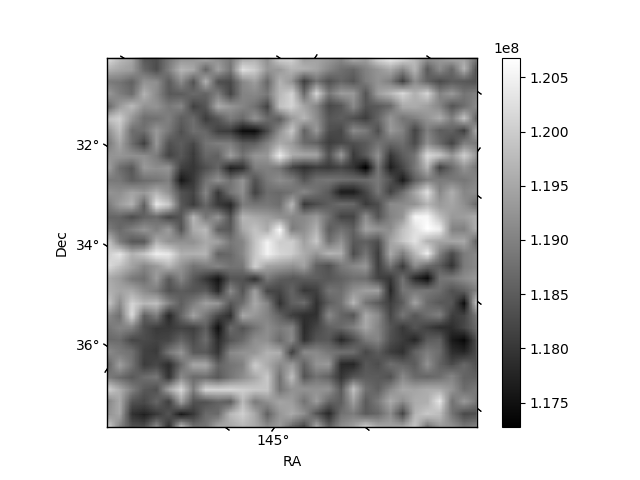
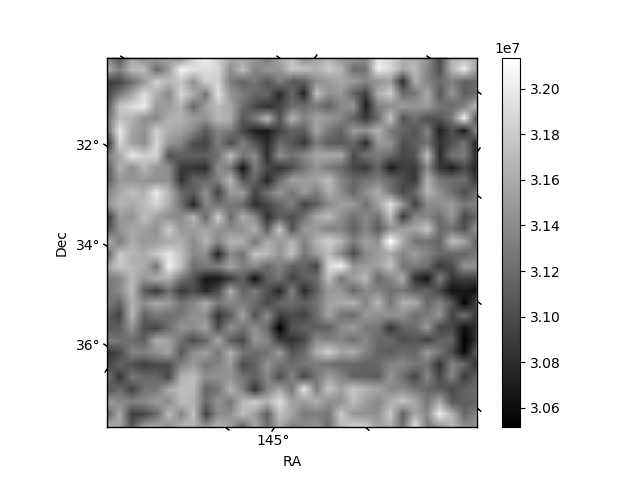
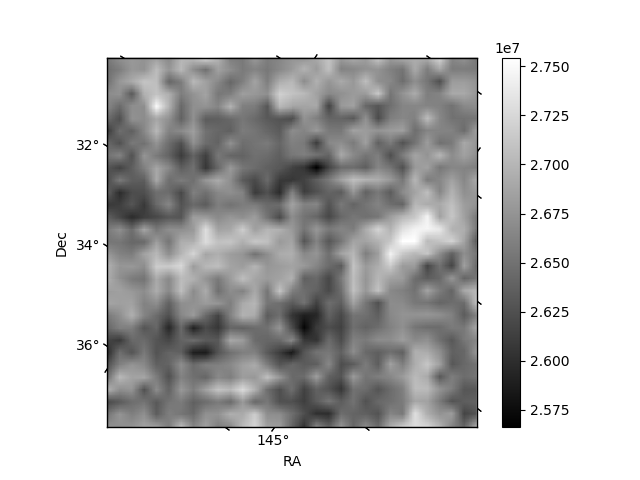
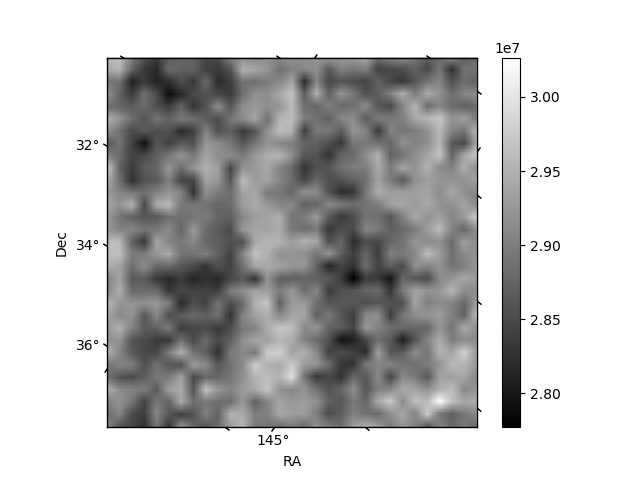
Histogram calculated using DETX and DETY for each event in the final _common_clean file
| Quadrant A | 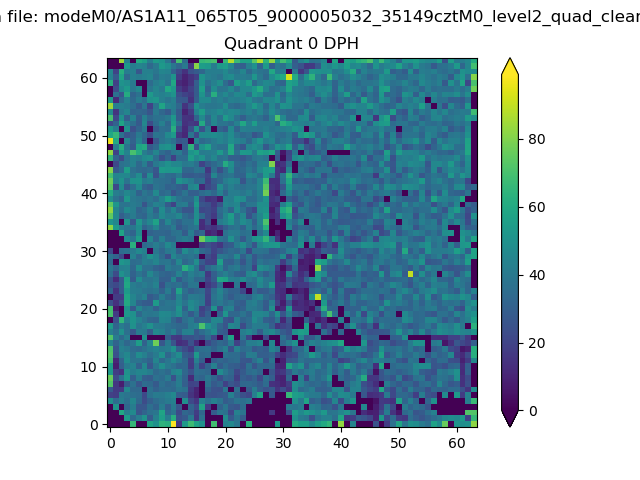 |
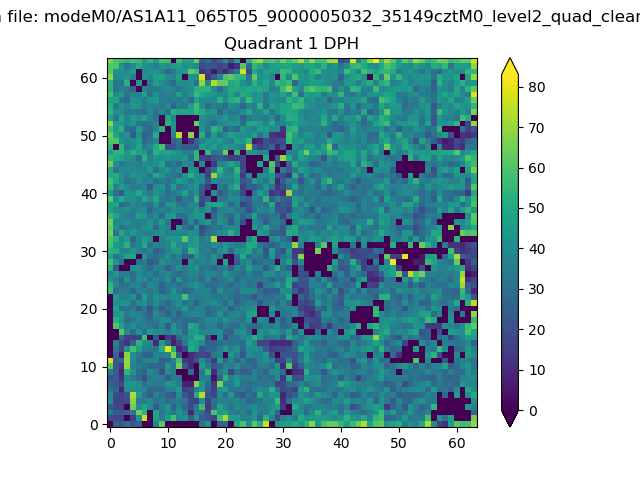 |
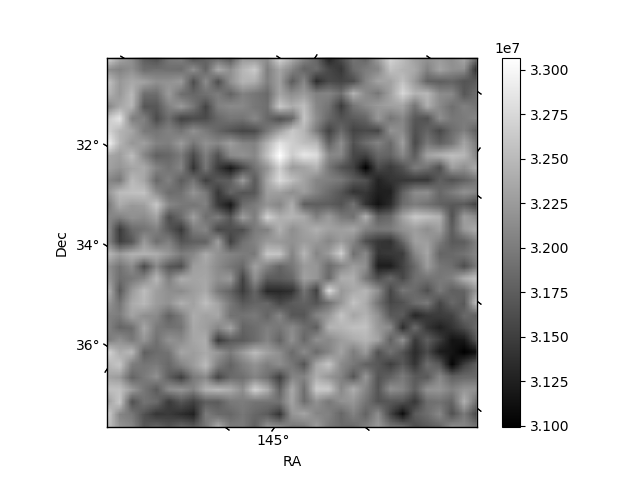
Quadrant B |
|---|---|---|---|
| Quadrant D | 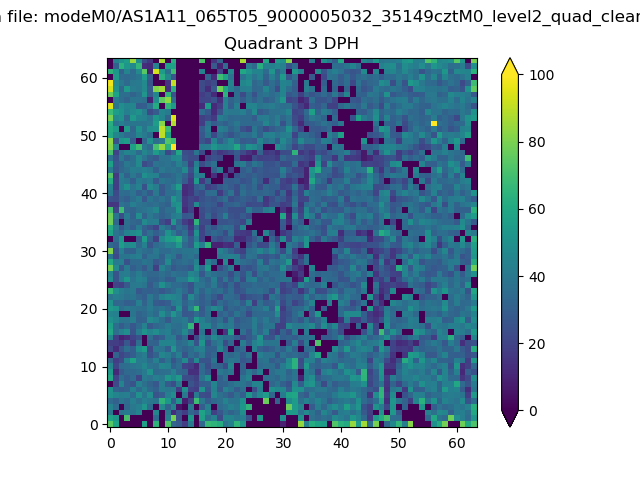 |
 |
Quadrant C |
| Plot type | Count rate plots | Images |
|---|---|---|
| Comparison with Poisson distribution Blue bars denote a histogram of data divided into 1 sec bins. Red curve is a Poisson curve with rate = median count rate of data. |
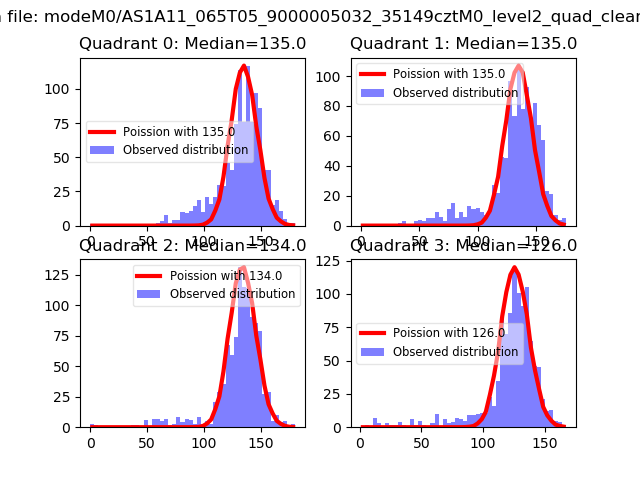 |
 |
| Quadrant-wise count rates Data is divided into 100 sec bins |
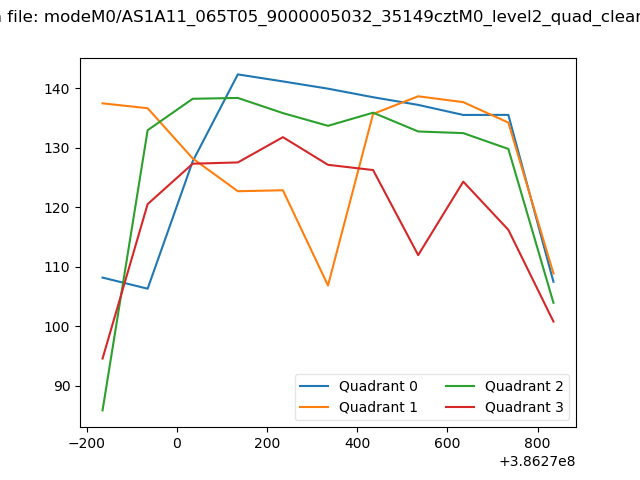 |
|
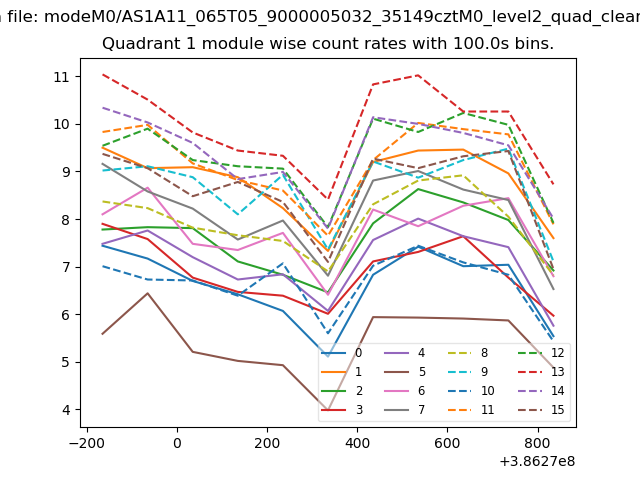
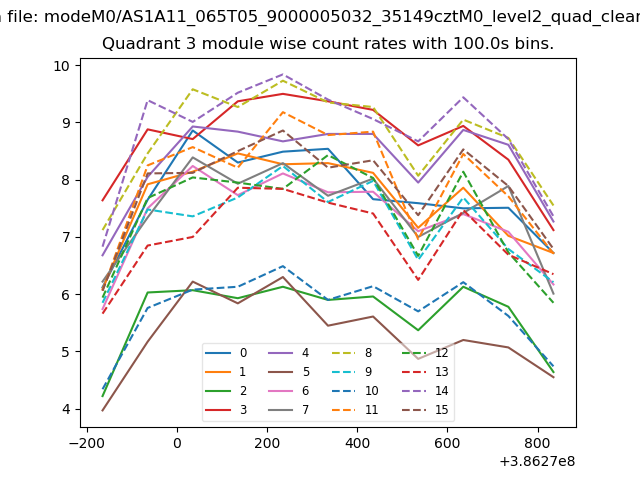
| Module-wise count rates for Quadrant A Data is divided into 100 sec bins |
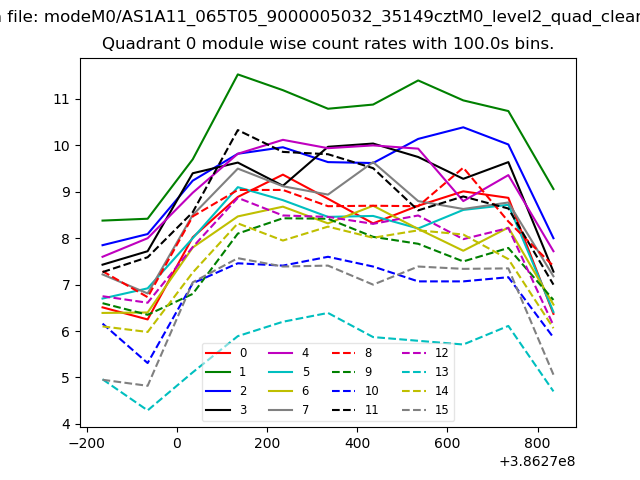 |
 |
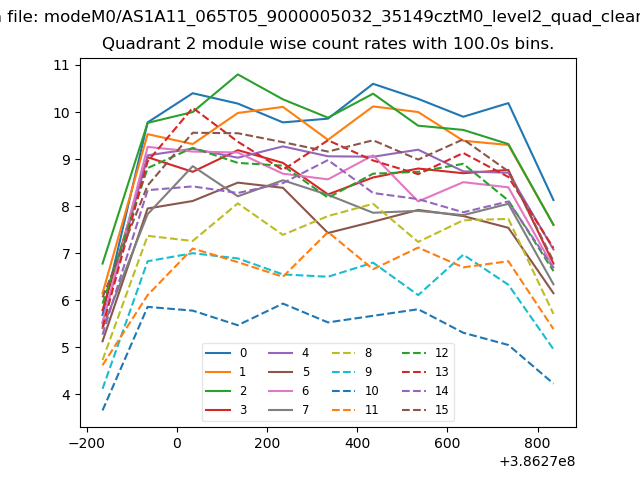
| Module-wise count rates for Quadrant B Data is divided into 100 sec bins |
 |
 |
| Module-wise count rates for Quadrant C Data is divided into 100 sec bins |
 |
 |
| Module-wise count rates for Quadrant D Data is divided into 100 sec bins |
 |
 |
| Parameter | Plot |
|---|---|
| CZT HV Monitor | 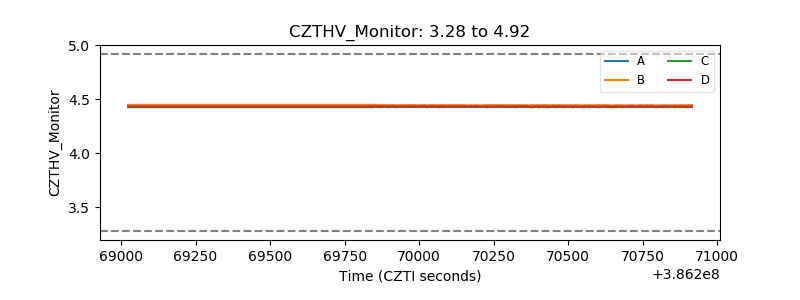 |
| D_VDD | 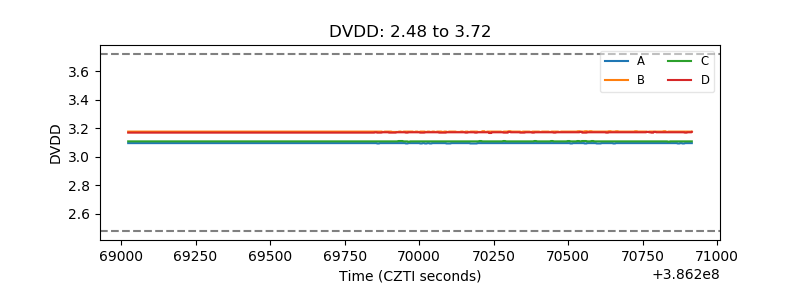 |
| Temperature 1 | 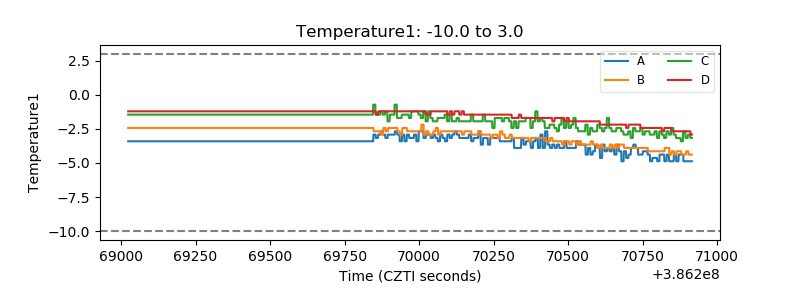 |
| Veto HV Monitor | 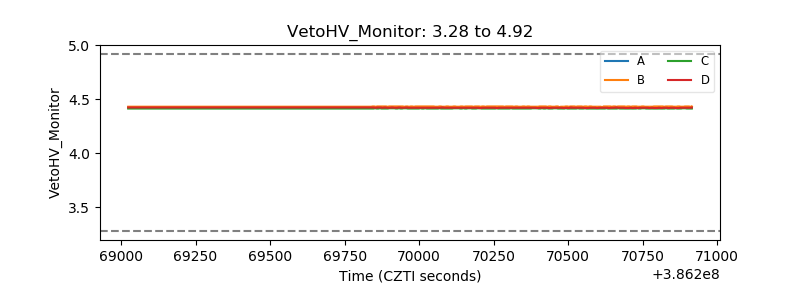 |
| Veto LLD | 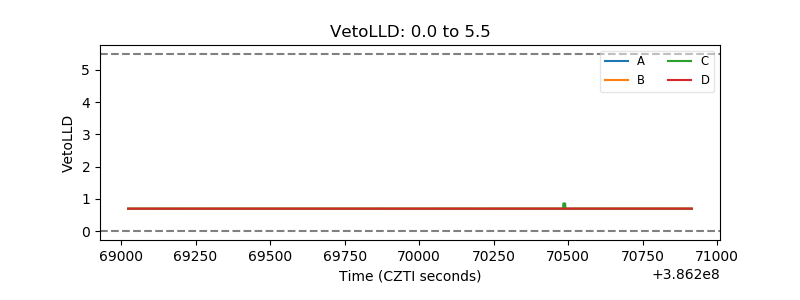 |
| Alpha Counter | 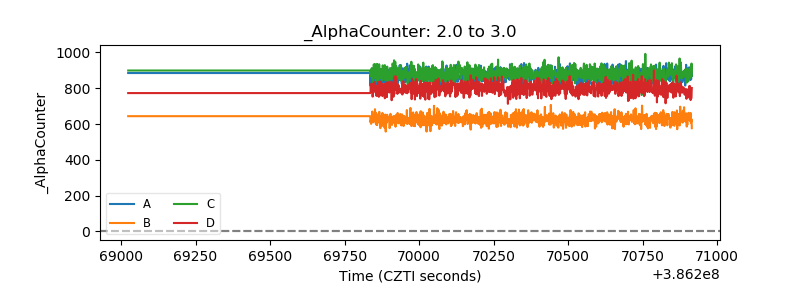 |
| _CPM_Rate | 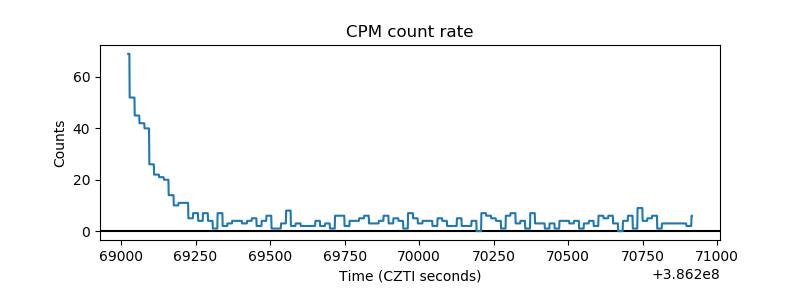 |
| CZT Counter | 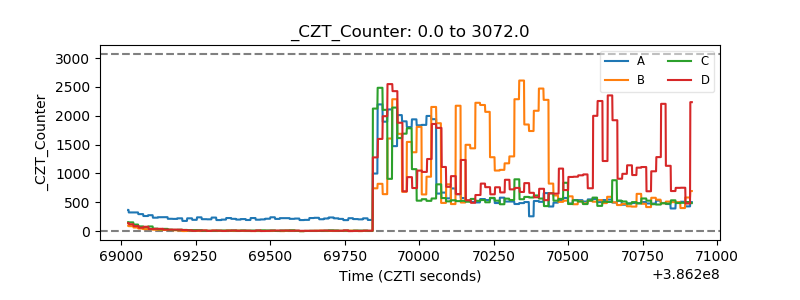 |
| +2.5 Volts monitor | 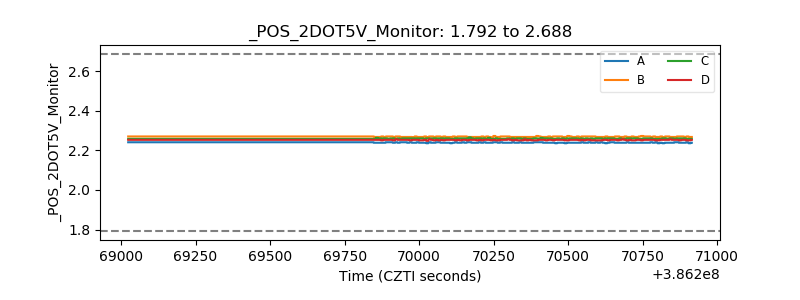 |
| +5 Volts monitor | 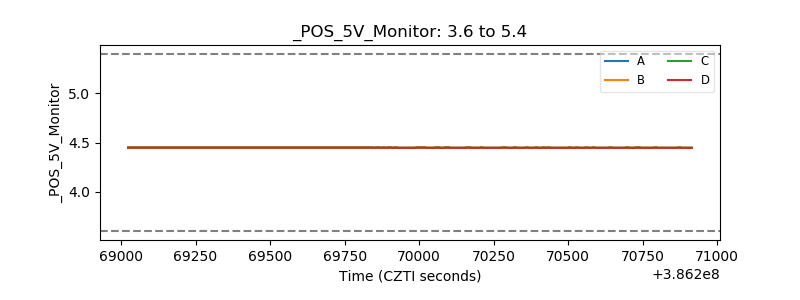 |
| _ROLL_ROT | 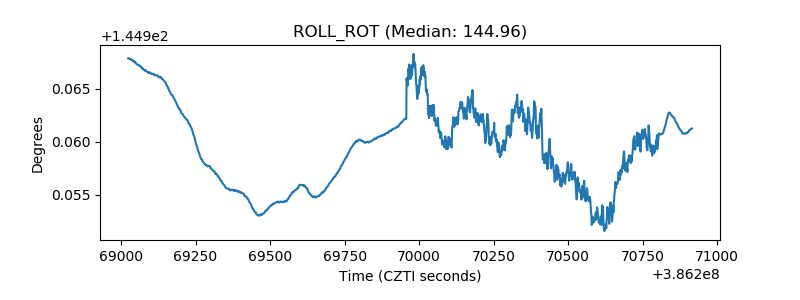 |
| _Roll_DEC | 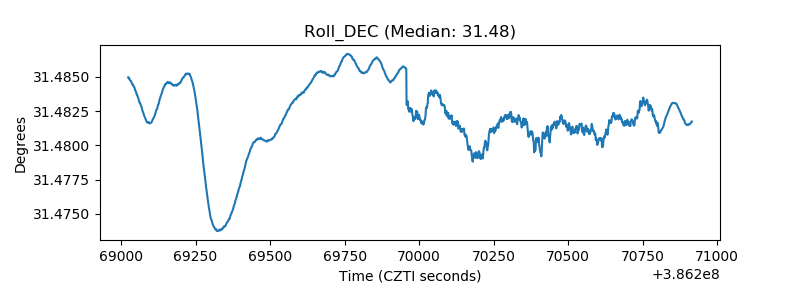 |
| _Roll_RA | 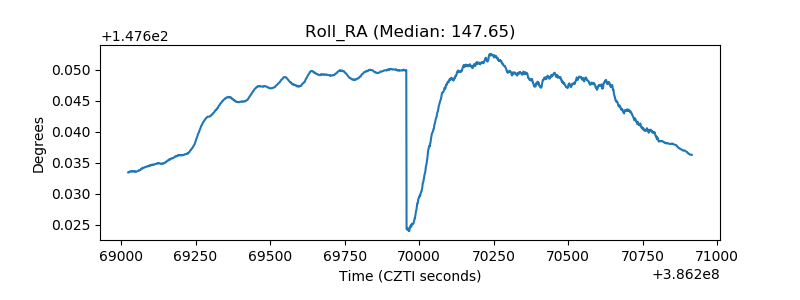 |
| Veto Counter | 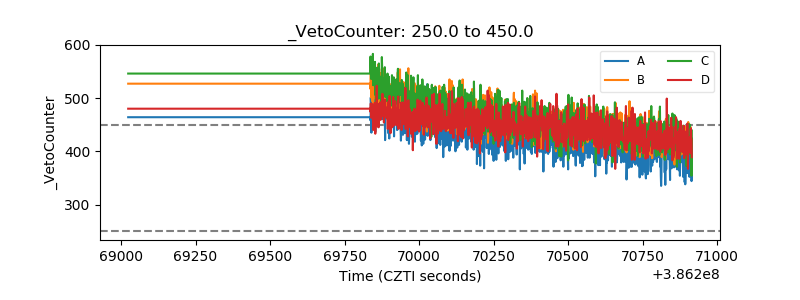 |