| Param | Original file | Final file |
|---|---|---|
| Filename | modeM0/AS1A11_065T05_9000005032_35148cztM0_level2.evt | modeM0/AS1A11_065T05_9000005032_35148cztM0_level2_quad_clean.evt |
| Size (bytes) | 648,599,040 | 79,741,440 |
| Size | 618.6 MB | 76.0 MB |
| Events in quadrant A | 6,026,240 | 498,605 |
| Events in quadrant B | 3,870,597 | 542,657 |
| Events in quadrant C | 3,037,564 | 534,999 |
| Events in quadrant D | 6,366,067 | 481,529 |
| Mode M0 | |||
|---|---|---|---|
| Quadrant | BADHDUFLAG | Total packets | Discarded packets |
| A | 0 | 21424 | 3 |
| B | 0 | 14875 | 2 |
| C | 0 | 11927 | 2 |
| D | 0 | 22564 | 2 |
| Mode M9 | |||
|---|---|---|---|
| Quadrant | BADHDUFLAG | Total packets | Discarded packets |
| A | 0 | 27 | 0 |
| B | 0 | 27 | 0 |
| C | 0 | 27 | 0 |
| D | 0 | 28 | 0 |
| Mode SS | |||
|---|---|---|---|
| Quadrant | BADHDUFLAG | Total packets | Discarded packets |
| A | 0 | 104 | 0 |
| B | 0 | 104 | 0 |
| C | 0 | 104 | 0 |
| D | 0 | 104 | 0 |
| Quadrant | Total seconds | Saturated seconds | Saturation percentage |
|---|---|---|---|
| A | 5078 | 1070 | 21.071288% |
| B | 5078 | 366 | 7.207562% |
| C | 5078 | 161 | 3.170540% |
| D | 5078 | 576 | 11.343048% |
Noise dominated data is calculated using 1-second bins in cleaned event files. If a bin has >2000 counts, and if more than 50% of those come from <1% of pixels, then it is considered to be noise-dominated and hence unusable.
| Quadrant | # 1 sec bins | Bins with >0 counts | Bins with >2000 counts | High rate bins dominated by noise | Noise dominated (total time) | Noise dominated (detector-on time) | Marked lightcurve |
|---|---|---|---|---|---|---|---|
| A | 7172 | 5079 | 666 | 666 | 9.29% | 13.11% | 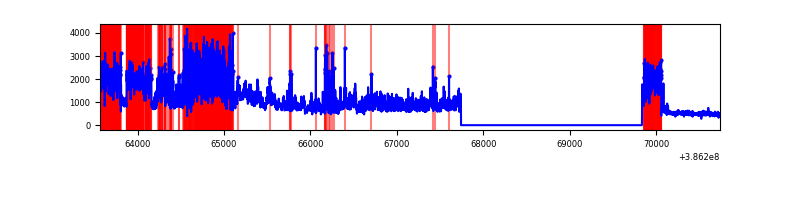 |
| B | 7172 | 5079 | 218 | 218 | 3.04% | 4.29% | 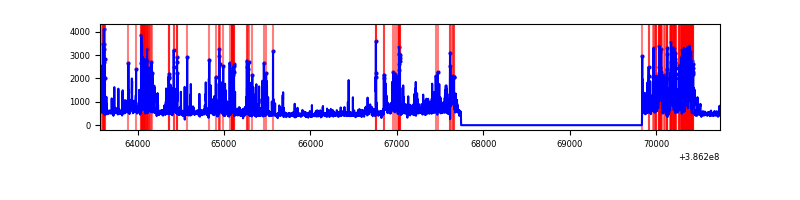 |
| C | 7172 | 5079 | 116 | 116 | 1.62% | 2.28% | 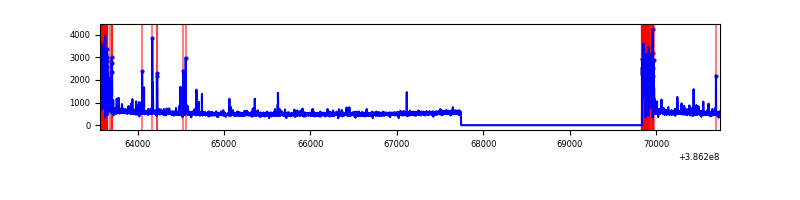 |
| D | 7172 | 5079 | 574 | 574 | 8.00% | 11.30% |  |
Top three noisy pixels from each quadrant. If the there are fewer than three noisy pixels in the level2.evt file, extra rows are filled as -1
| Pixel properties | Quadrant properties | ||||||
|---|---|---|---|---|---|---|---|
| Quadrant | DetID | PixID | Counts | Sigma | Mean | Median | Sigma |
| A | 15 | 169 | 3639830 | 30871.96 | 586 | 576 | 117.9 |
| A | 10 | 83 | 78671 | 662.48 | 586 | 576 | 117.9 |
| A | 9 | 143 | 26381 | 218.91 | 586 | 576 | 117.9 |
| B | 5 | 236 | 1272043 | 10974.84 | 604 | 589 | 115.9 |
| B | 5 | 172 | 83642 | 716.89 | 604 | 589 | 115.9 |
| B | 0 | 189 | 65157 | 557.33 | 604 | 589 | 115.9 |
| C | 0 | 10 | 459535 | 3306.98 | 598 | 604 | 138.8 |
| C | 15 | 214 | 211919 | 1522.7 | 598 | 604 | 138.8 |
| C | 1 | 23 | 18033 | 125.59 | 598 | 604 | 138.8 |
| D | 8 | 195 | 2792929 | 19754.71 | 587 | 575 | 141.4 |
| D | 13 | 249 | 511874 | 3617.22 | 587 | 575 | 141.4 |
| D | 2 | 250 | 365916 | 2584.63 | 587 | 575 | 141.4 |
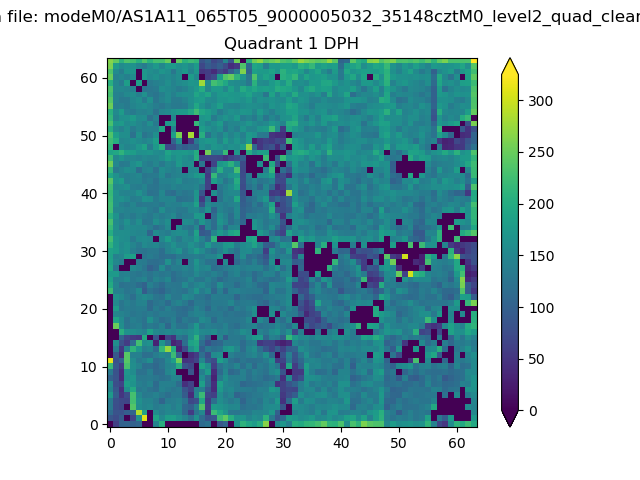
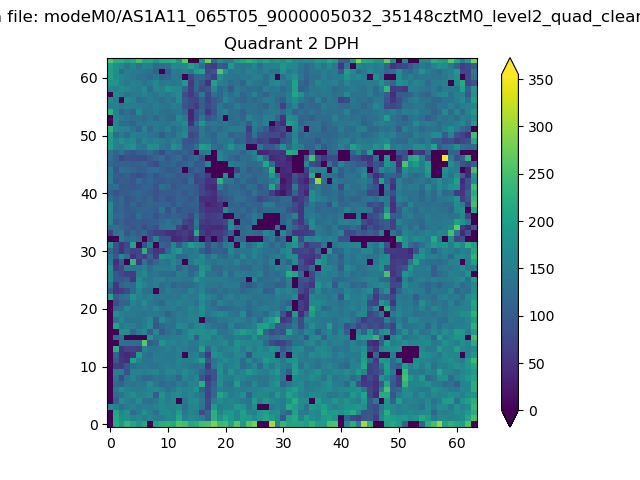
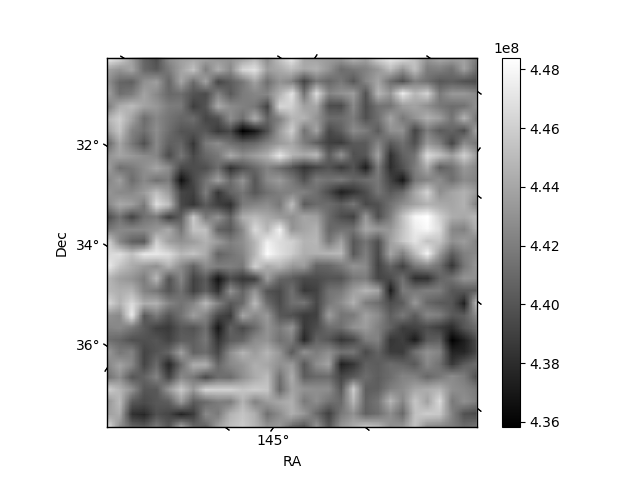
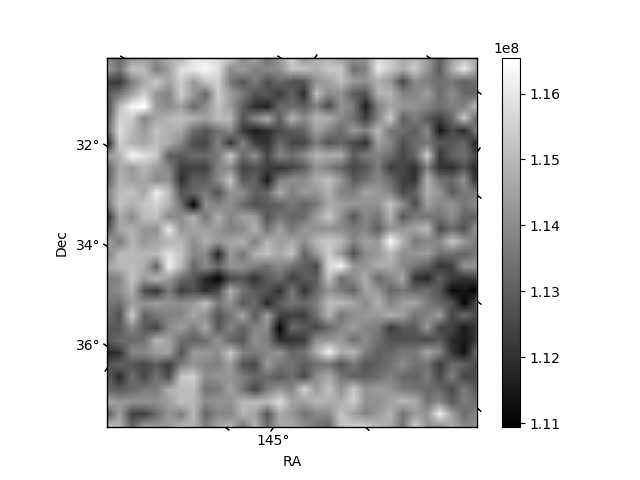
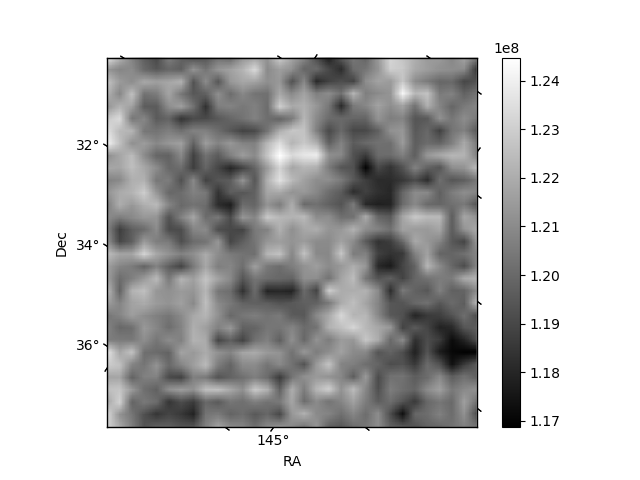
Histogram calculated using DETX and DETY for each event in the final _common_clean file
| Quadrant A | 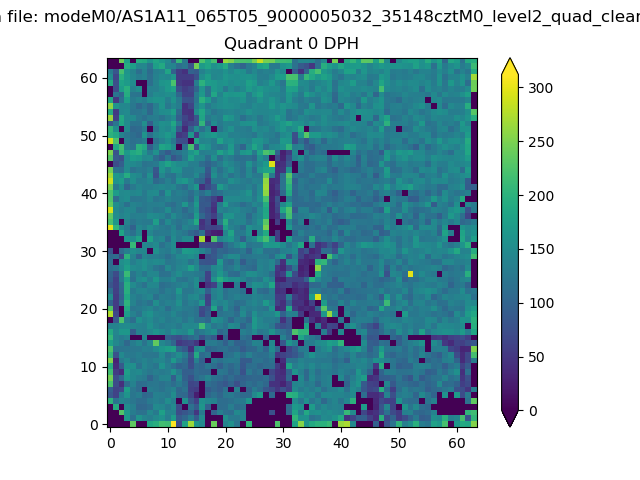 |
 |
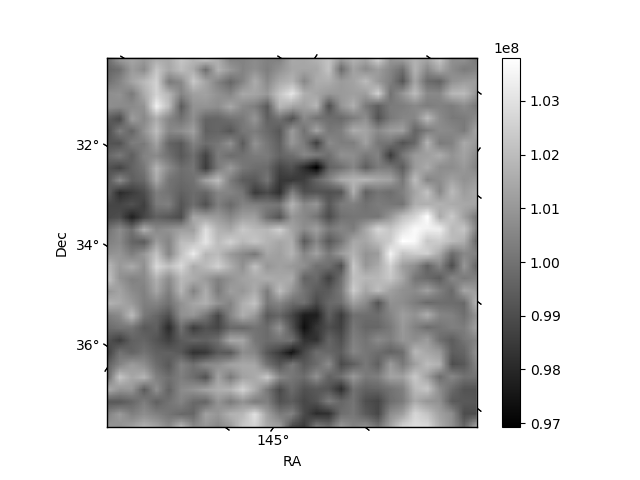
Quadrant B |
|---|---|---|---|
| Quadrant D | 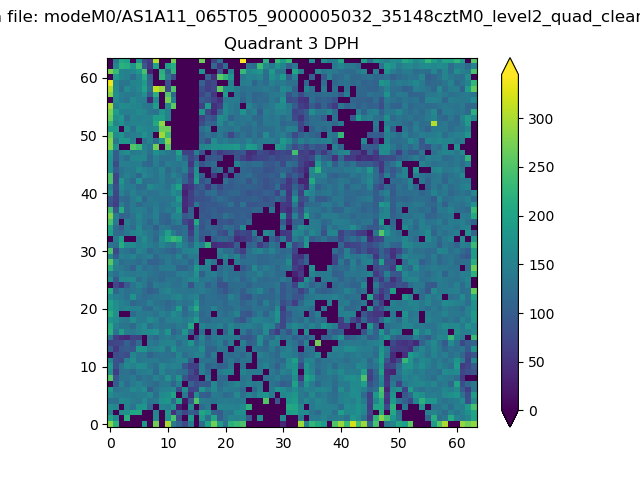 |
 |
Quadrant C |
| Plot type | Count rate plots | Images |
|---|---|---|
| Comparison with Poisson distribution Blue bars denote a histogram of data divided into 1 sec bins. Red curve is a Poisson curve with rate = median count rate of data. |
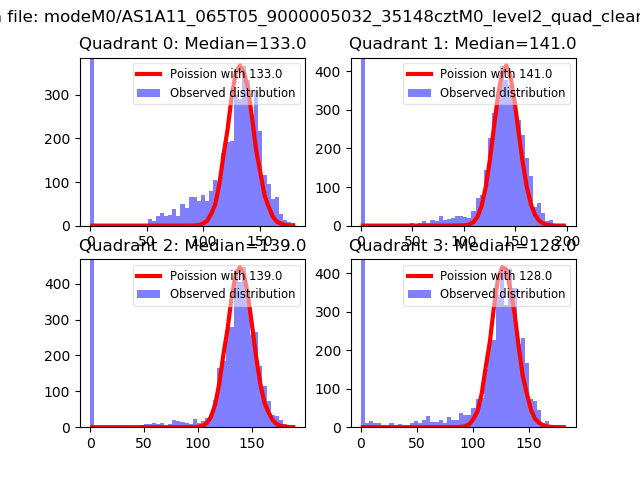 |
 |
| Quadrant-wise count rates Data is divided into 100 sec bins |
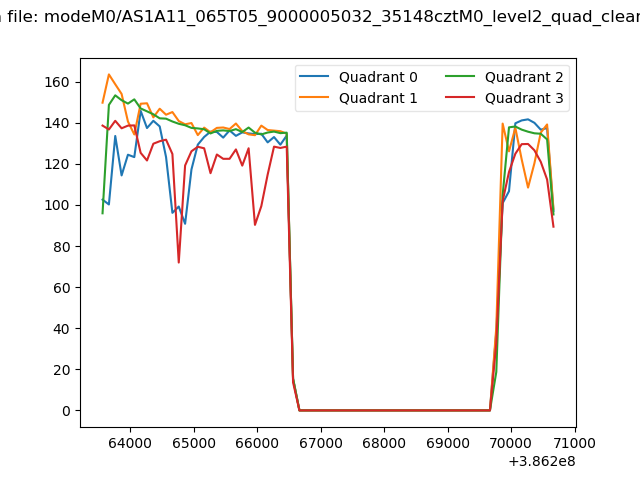 |
|
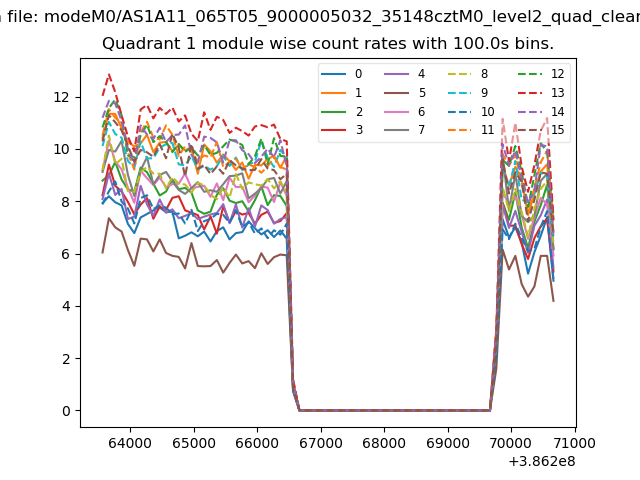
| Module-wise count rates for Quadrant A Data is divided into 100 sec bins |
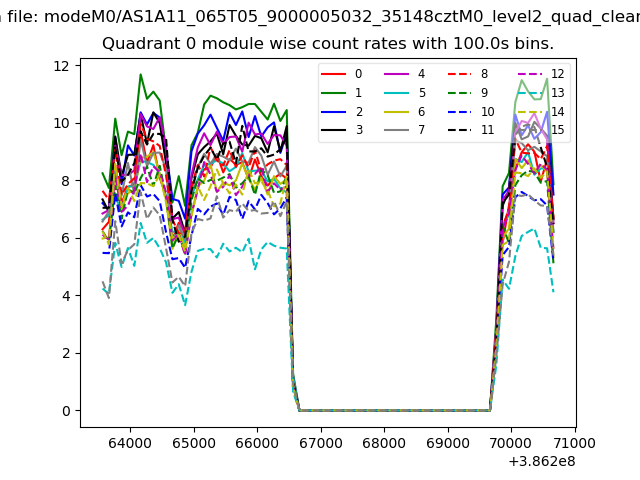 |
 |
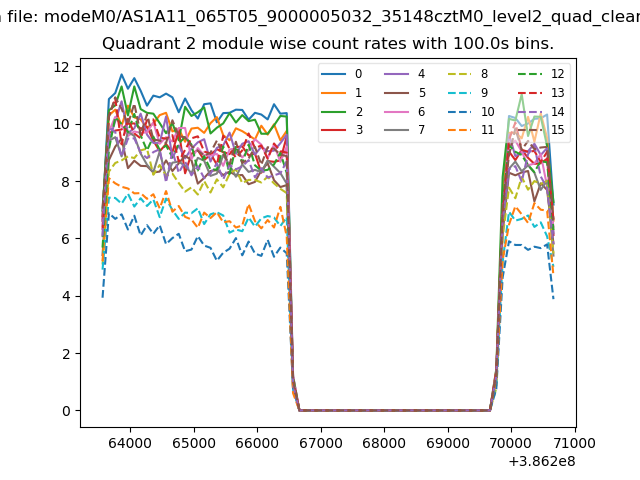
| Module-wise count rates for Quadrant B Data is divided into 100 sec bins |
 |
 |
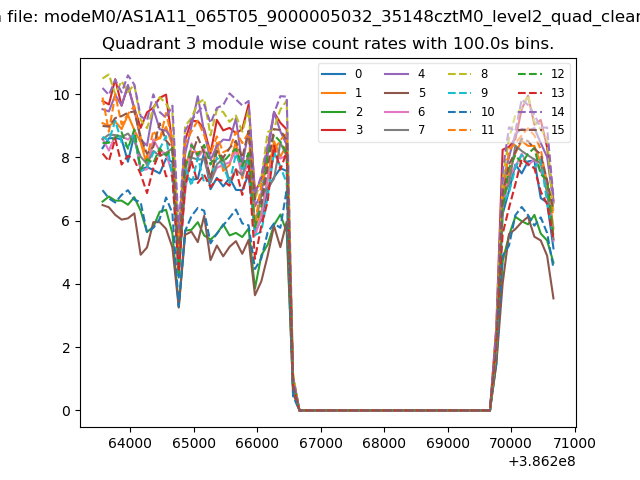
| Module-wise count rates for Quadrant C Data is divided into 100 sec bins |
 |
 |
| Module-wise count rates for Quadrant D Data is divided into 100 sec bins |
 |
 |
| Parameter | Plot |
|---|---|
| CZT HV Monitor | 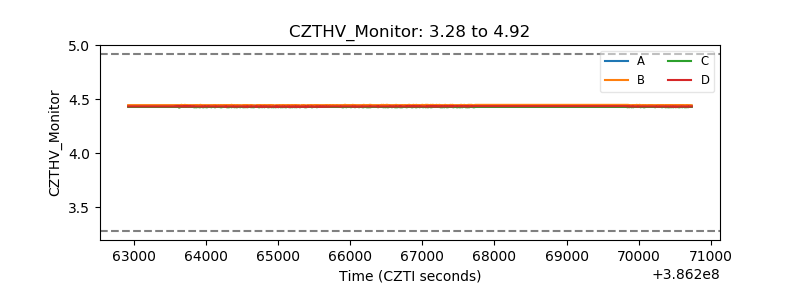 |
| D_VDD | 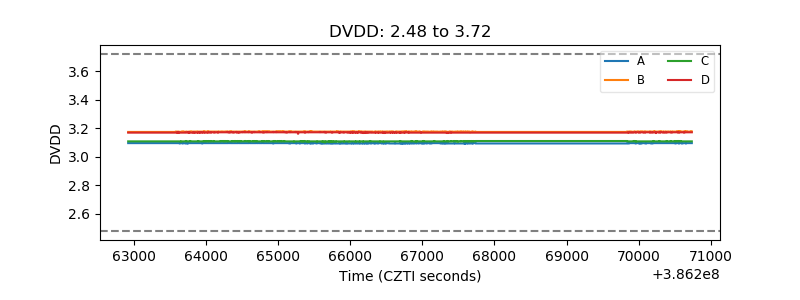 |
| Temperature 1 | 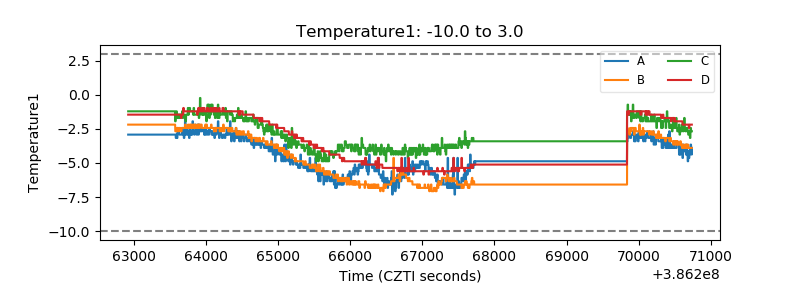 |
| Veto HV Monitor |  |
| Veto LLD | 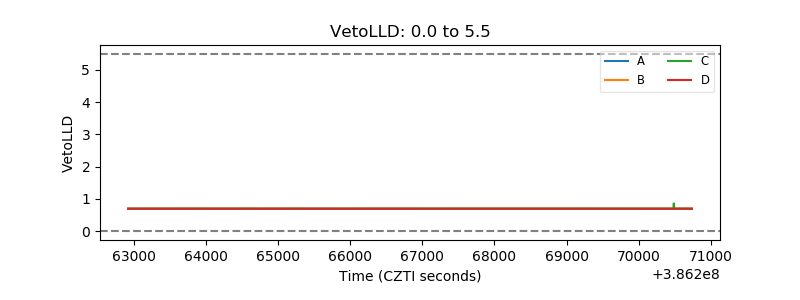 |
| Alpha Counter | 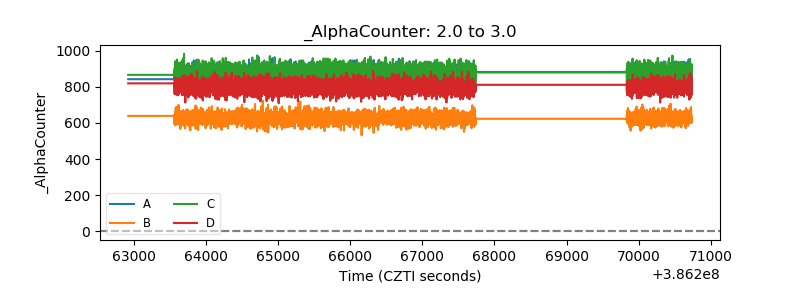 |
| _CPM_Rate | 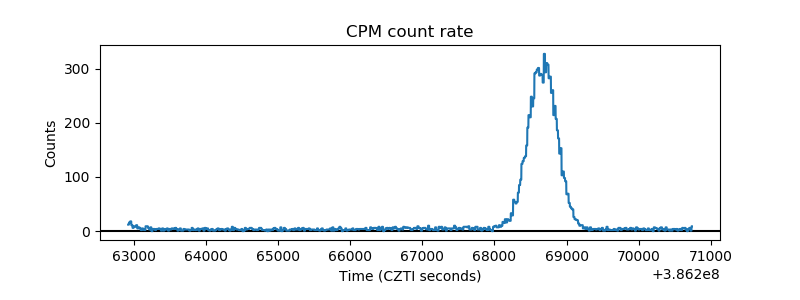 |
| CZT Counter | 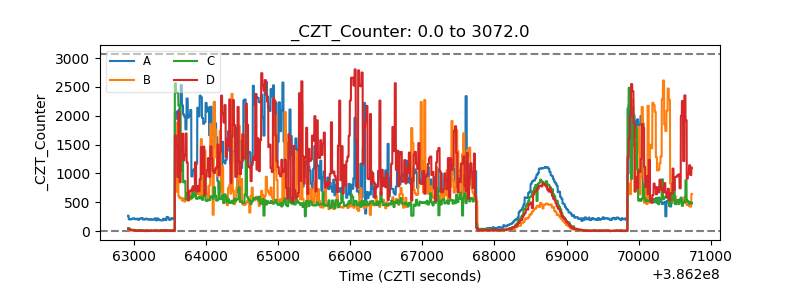 |
| +2.5 Volts monitor | 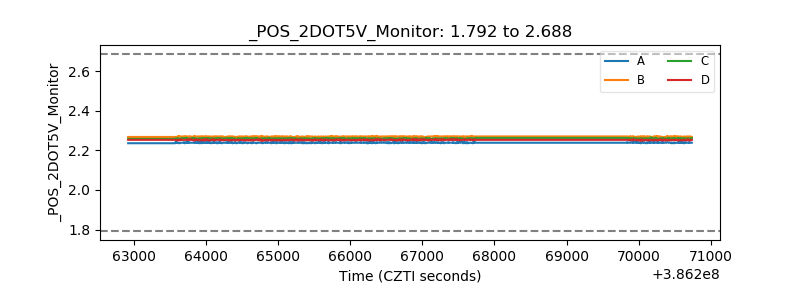 |
| +5 Volts monitor | 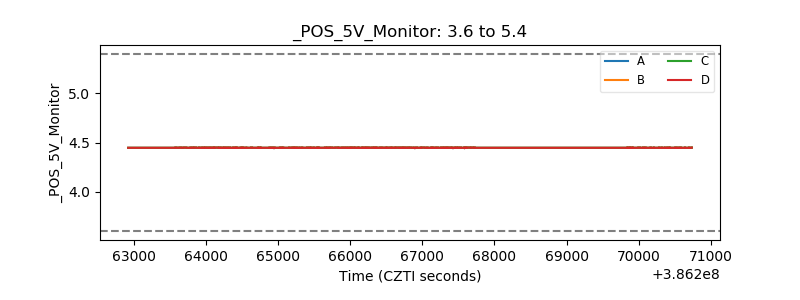 |
| _ROLL_ROT | 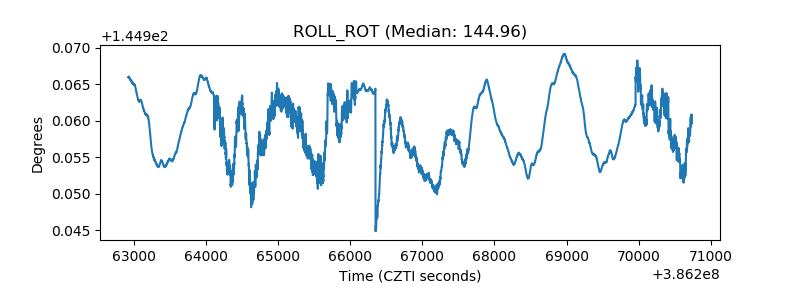 |
| _Roll_DEC |  |
| _Roll_RA | 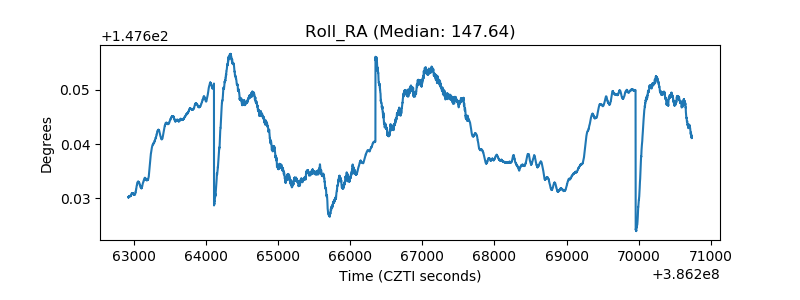 |
| Veto Counter |  |