| Param | Original file | Final file |
|---|---|---|
| Filename | modeM0/AS1A11_065T05_9000005032_35147cztM0_level2.evt | modeM0/AS1A11_065T05_9000005032_35147cztM0_level2_quad_clean.evt |
| Size (bytes) | 544,043,520 | 92,134,080 |
| Size | 518.8 MB | 87.9 MB |
| Events in quadrant A | 3,647,439 | 622,067 |
| Events in quadrant B | 3,708,130 | 631,455 |
| Events in quadrant C | 2,993,708 | 619,679 |
| Events in quadrant D | 5,796,906 | 573,825 |
| Mode M0 | |||
|---|---|---|---|
| Quadrant | BADHDUFLAG | Total packets | Discarded packets |
| A | 0 | 13847 | 2 |
| B | 0 | 14182 | 1 |
| C | 0 | 11786 | 1 |
| D | 0 | 20712 | 1 |
| Mode M9 | |||
|---|---|---|---|
| Quadrant | BADHDUFLAG | Total packets | Discarded packets |
| A | 0 | 22 | 0 |
| B | 0 | 22 | 0 |
| C | 0 | 22 | 0 |
| D | 0 | 22 | 0 |
| Mode SS | |||
|---|---|---|---|
| Quadrant | BADHDUFLAG | Total packets | Discarded packets |
| A | 0 | 98 | 0 |
| B | 0 | 98 | 0 |
| C | 0 | 98 | 0 |
| D | 0 | 98 | 0 |
| Quadrant | Total seconds | Saturated seconds | Saturation percentage |
|---|---|---|---|
| A | 4893 | 503 | 10.279992% |
| B | 4893 | 260 | 5.313713% |
| C | 4893 | 106 | 2.166360% |
| D | 4893 | 374 | 7.643572% |
Noise dominated data is calculated using 1-second bins in cleaned event files. If a bin has >2000 counts, and if more than 50% of those come from <1% of pixels, then it is considered to be noise-dominated and hence unusable.
| Quadrant | # 1 sec bins | Bins with >0 counts | Bins with >2000 counts | High rate bins dominated by noise | Noise dominated (total time) | Noise dominated (detector-on time) | Marked lightcurve |
|---|---|---|---|---|---|---|---|
| A | 7046 | 4894 | 280 | 280 | 3.97% | 5.72% | 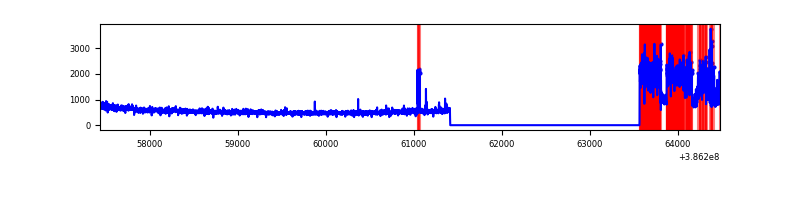 |
| B | 7046 | 4894 | 180 | 180 | 2.55% | 3.68% | 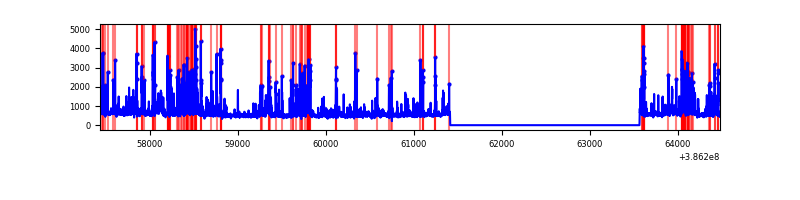 |
| C | 7046 | 4894 | 82 | 82 | 1.16% | 1.68% | 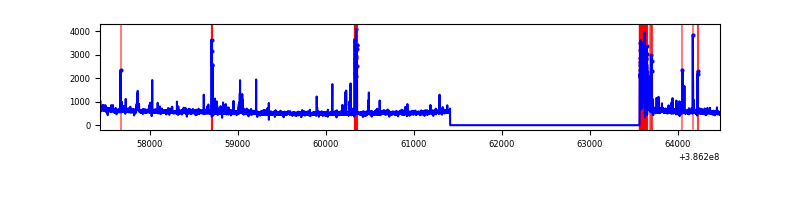 |
| D | 7046 | 4894 | 420 | 420 | 5.96% | 8.58% | 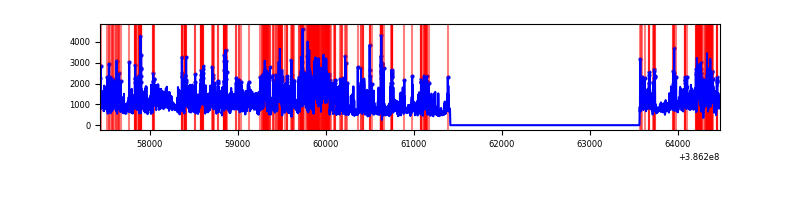 |
Top three noisy pixels from each quadrant. If the there are fewer than three noisy pixels in the level2.evt file, extra rows are filled as -1
| Pixel properties | Quadrant properties | ||||||
|---|---|---|---|---|---|---|---|
| Quadrant | DetID | PixID | Counts | Sigma | Mean | Median | Sigma |
| A | 15 | 169 | 1145587 | 9266.93 | 621 | 611 | 123.6 |
| A | 10 | 83 | 59322 | 475.18 | 621 | 611 | 123.6 |
| A | 9 | 143 | 26783 | 211.82 | 621 | 611 | 123.6 |
| B | 5 | 236 | 1119115 | 9703.3 | 614 | 602 | 115.3 |
| B | 5 | 172 | 94881 | 817.89 | 614 | 602 | 115.3 |
| B | 0 | 189 | 52347 | 448.9 | 614 | 602 | 115.3 |
| C | 0 | 10 | 387706 | 2787.81 | 608 | 615 | 138.9 |
| C | 15 | 214 | 207404 | 1489.28 | 608 | 615 | 138.9 |
| C | 1 | 23 | 15200 | 105.04 | 608 | 615 | 138.9 |
| D | 8 | 195 | 2790688 | 18925.26 | 610 | 596 | 147.4 |
| D | 13 | 249 | 173356 | 1171.84 | 610 | 596 | 147.4 |
| D | 2 | 250 | 104651 | 705.81 | 610 | 596 | 147.4 |
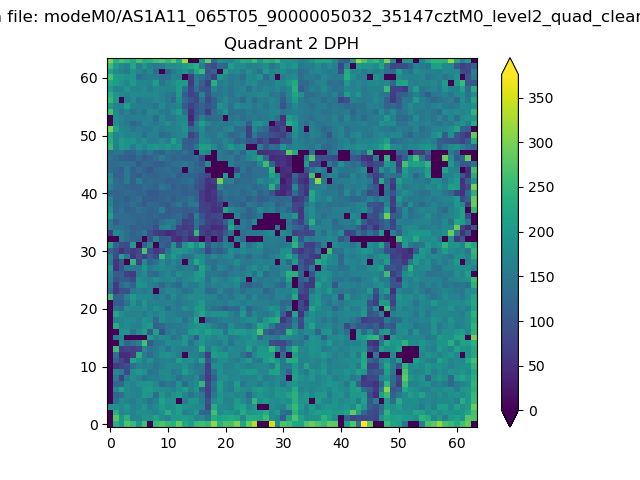
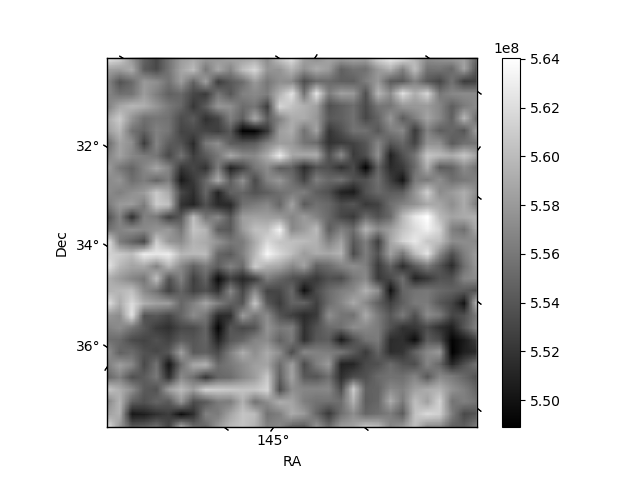
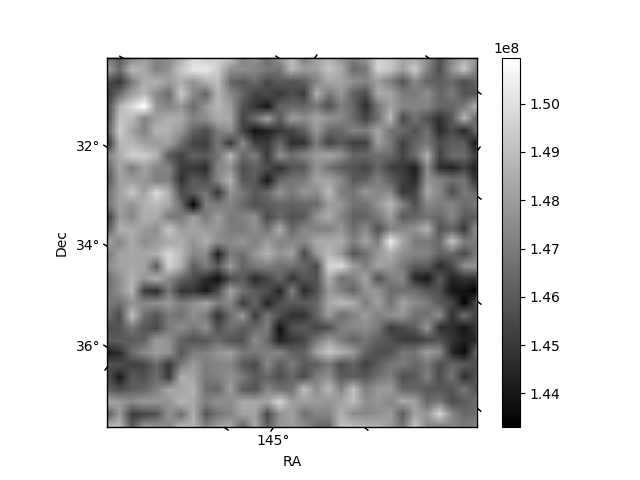
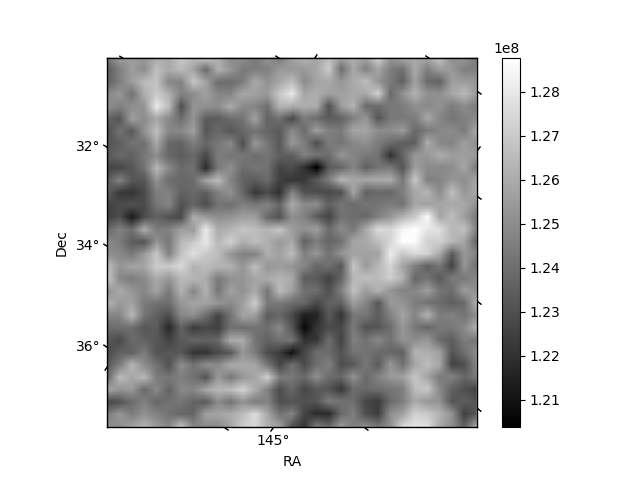
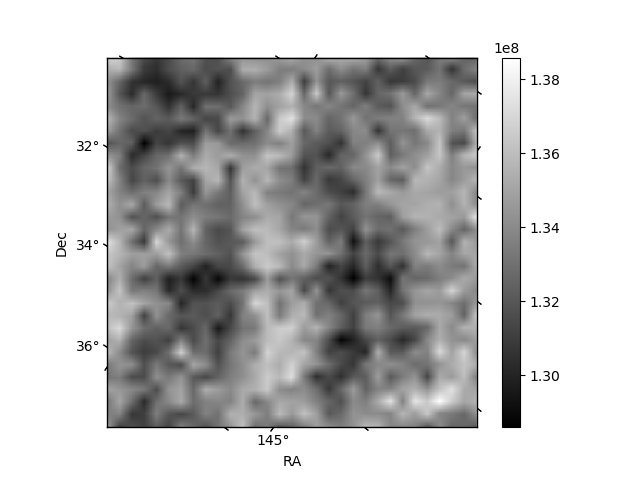
Histogram calculated using DETX and DETY for each event in the final _common_clean file
| Quadrant A | 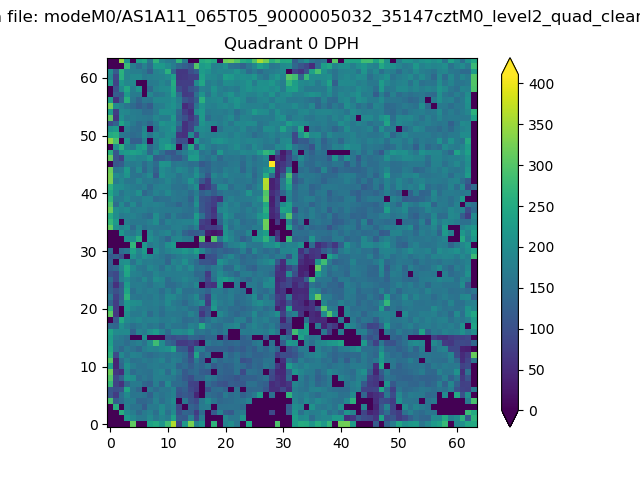 |
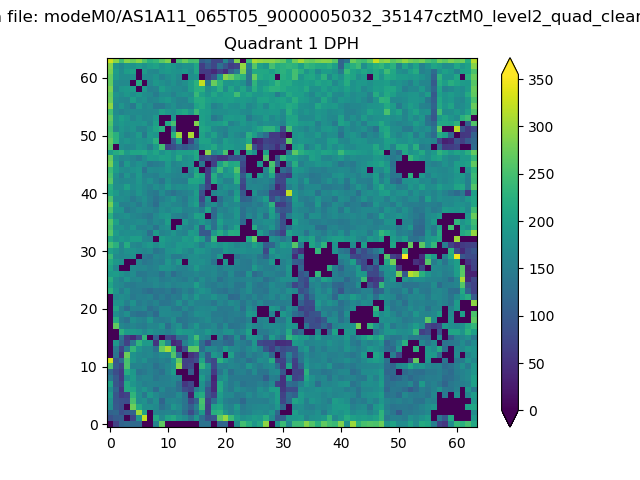 |
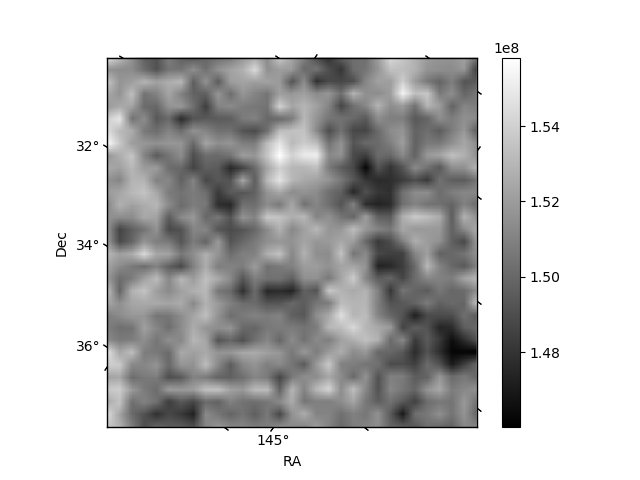
Quadrant B |
|---|---|---|---|
| Quadrant D | 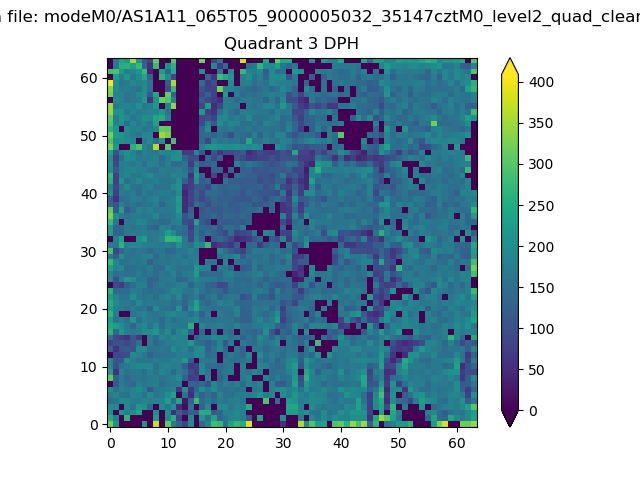 |
 |
Quadrant C |
| Plot type | Count rate plots | Images |
|---|---|---|
| Comparison with Poisson distribution Blue bars denote a histogram of data divided into 1 sec bins. Red curve is a Poisson curve with rate = median count rate of data. |
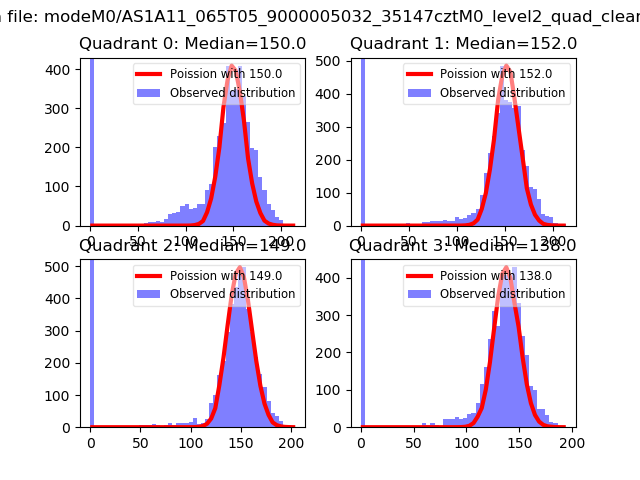 |
 |
| Quadrant-wise count rates Data is divided into 100 sec bins |
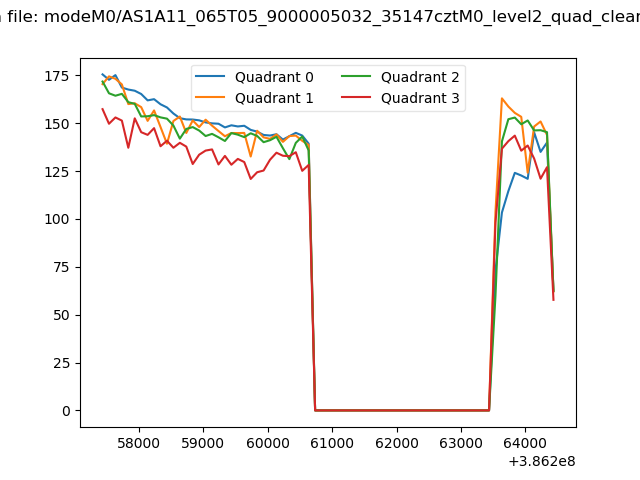 |
|
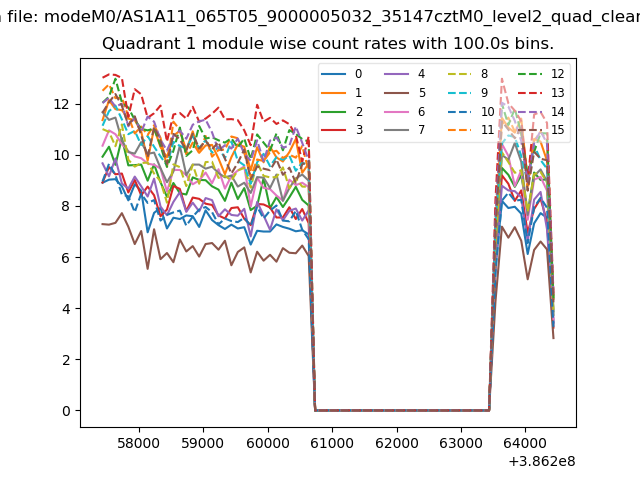
| Module-wise count rates for Quadrant A Data is divided into 100 sec bins |
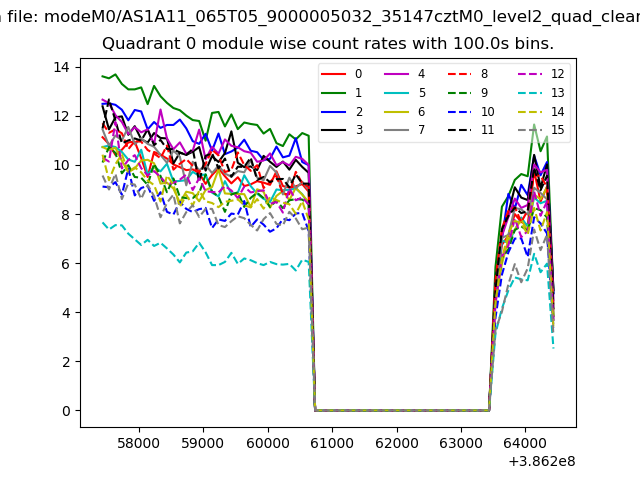 |
 |
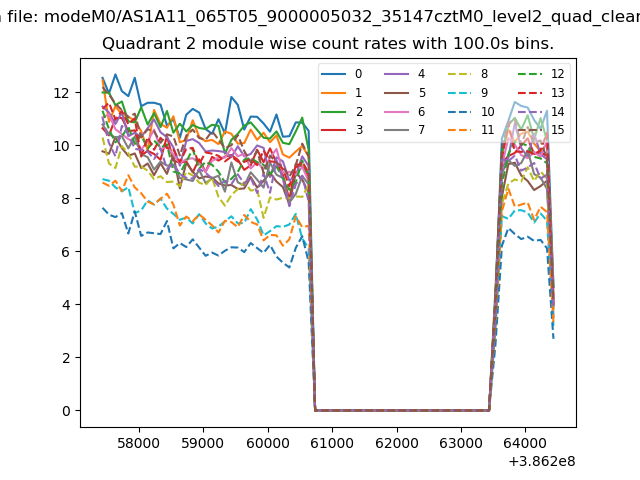
| Module-wise count rates for Quadrant B Data is divided into 100 sec bins |
 |
 |
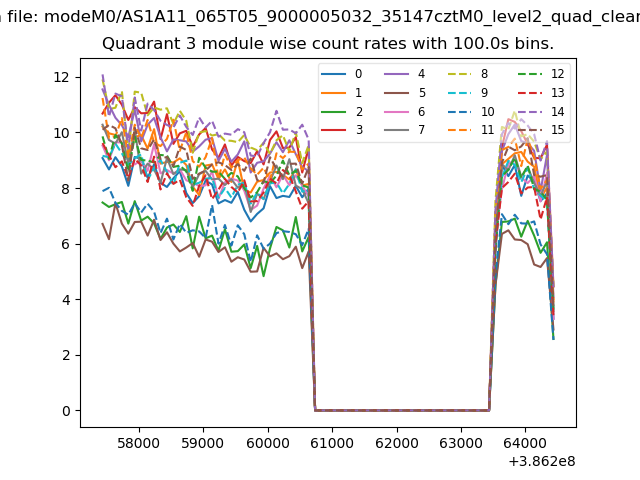
| Module-wise count rates for Quadrant C Data is divided into 100 sec bins |
 |
 |
| Module-wise count rates for Quadrant D Data is divided into 100 sec bins |
 |
 |
| Parameter | Plot |
|---|---|
| CZT HV Monitor | 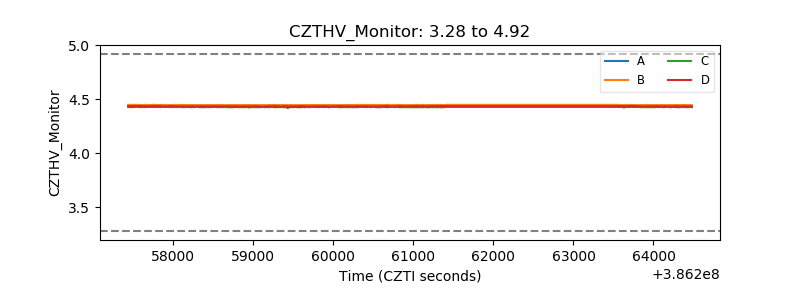 |
| D_VDD | 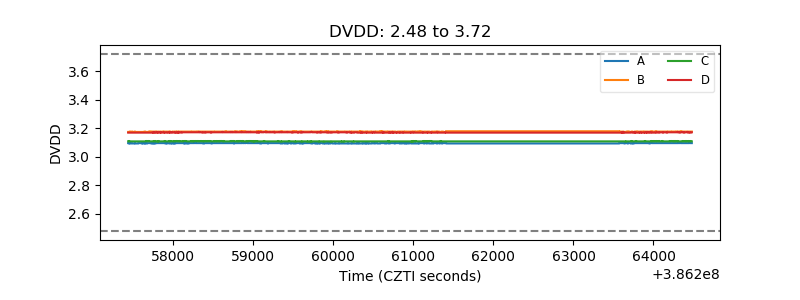 |
| Temperature 1 | 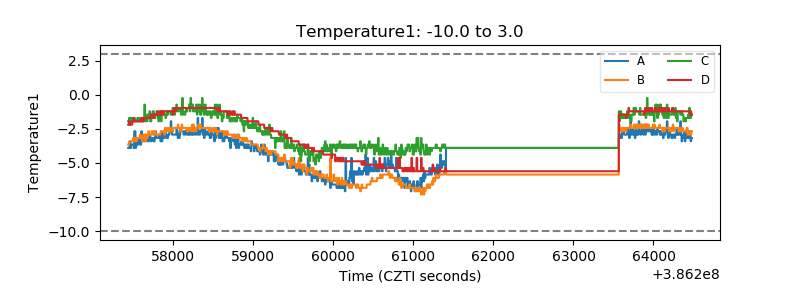 |
| Veto HV Monitor | 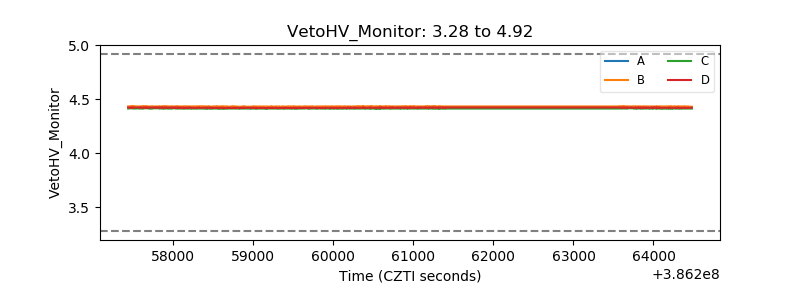 |
| Veto LLD | 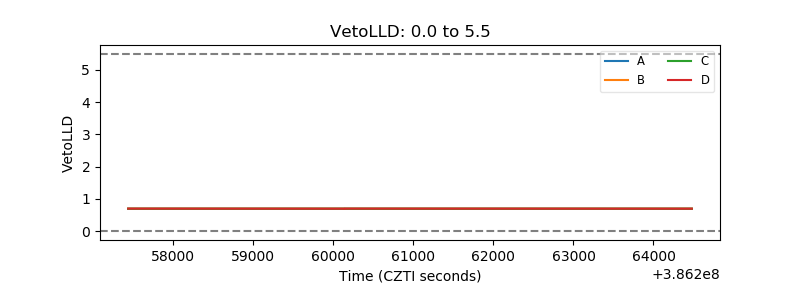 |
| Alpha Counter | 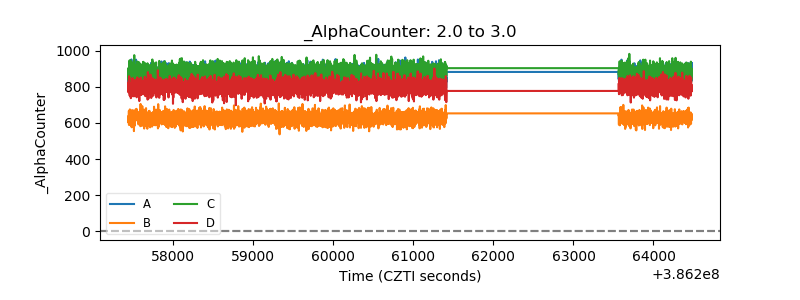 |
| _CPM_Rate | 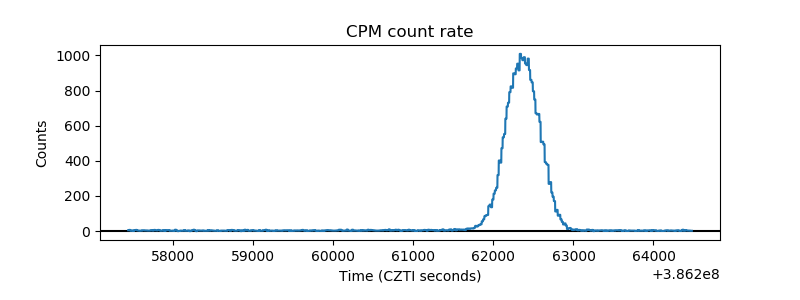 |
| CZT Counter | 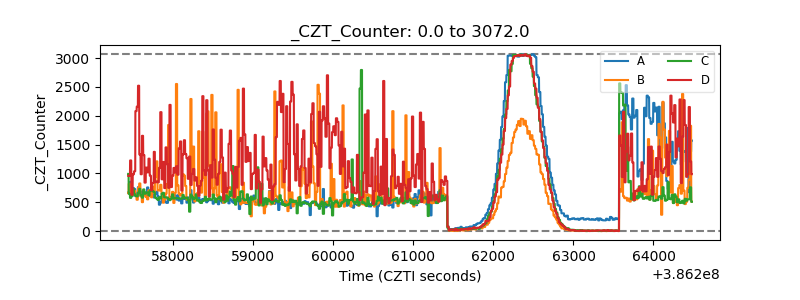 |
| +2.5 Volts monitor | 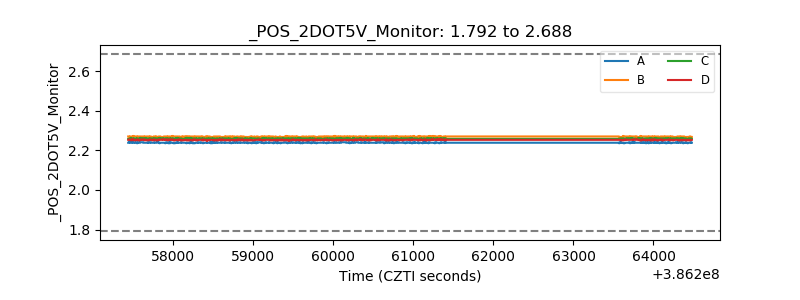 |
| +5 Volts monitor | 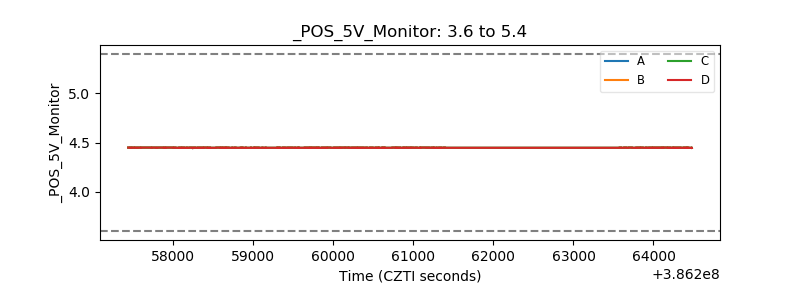 |
| _ROLL_ROT | 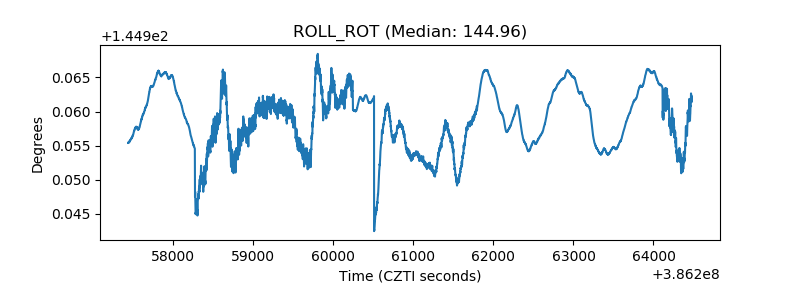 |
| _Roll_DEC | 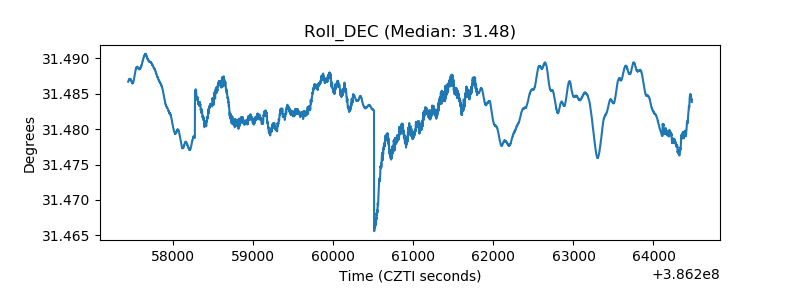 |
| _Roll_RA | 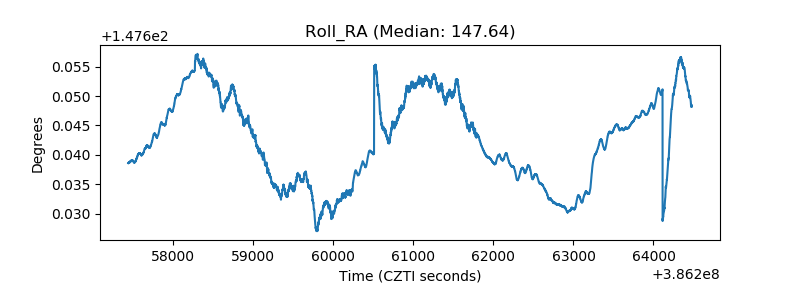 |
| Veto Counter | 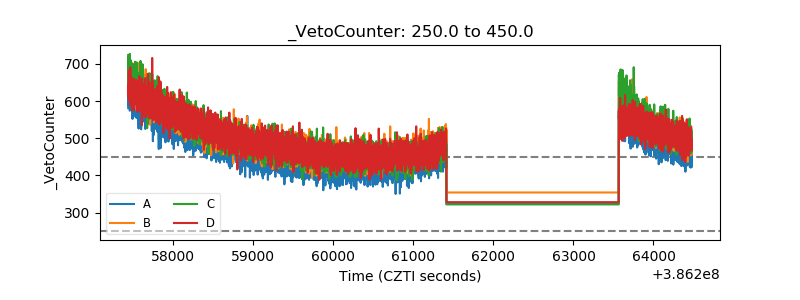 |