| Param | Original file | Final file |
|---|---|---|
| Filename | modeM0/AS1A11_065T05_9000005032_35146cztM0_level2.evt | modeM0/AS1A11_065T05_9000005032_35146cztM0_level2_quad_clean.evt |
| Size (bytes) | 553,452,480 | 105,511,680 |
| Size | 527.8 MB | 100.6 MB |
| Events in quadrant A | 3,326,331 | 741,972 |
| Events in quadrant B | 3,853,223 | 730,243 |
| Events in quadrant C | 3,450,512 | 707,586 |
| Events in quadrant D | 5,785,789 | 657,164 |
| Mode M0 | |||
|---|---|---|---|
| Quadrant | BADHDUFLAG | Total packets | Discarded packets |
| A | 0 | 13332 | 2 |
| B | 0 | 14904 | 1 |
| C | 0 | 13641 | 1 |
| D | 0 | 20897 | 1 |
| Mode M9 | |||
|---|---|---|---|
| Quadrant | BADHDUFLAG | Total packets | Discarded packets |
| A | 0 | 21 | 0 |
| B | 0 | 21 | 0 |
| C | 0 | 21 | 0 |
| D | 0 | 21 | 0 |
| Mode SS | |||
|---|---|---|---|
| Quadrant | BADHDUFLAG | Total packets | Discarded packets |
| A | 0 | 104 | 0 |
| B | 0 | 104 | 0 |
| C | 0 | 104 | 0 |
| D | 0 | 104 | 0 |
| Quadrant | Total seconds | Saturated seconds | Saturation percentage |
|---|---|---|---|
| A | 5117 | 85 | 1.661130% |
| B | 5117 | 231 | 4.514364% |
| C | 5117 | 120 | 2.345124% |
| D | 5117 | 342 | 6.683604% |
Noise dominated data is calculated using 1-second bins in cleaned event files. If a bin has >2000 counts, and if more than 50% of those come from <1% of pixels, then it is considered to be noise-dominated and hence unusable.
| Quadrant | # 1 sec bins | Bins with >0 counts | Bins with >2000 counts | High rate bins dominated by noise | Noise dominated (total time) | Noise dominated (detector-on time) | Marked lightcurve |
|---|---|---|---|---|---|---|---|
| A | 7239 | 5118 | 26 | 26 | 0.36% | 0.51% | 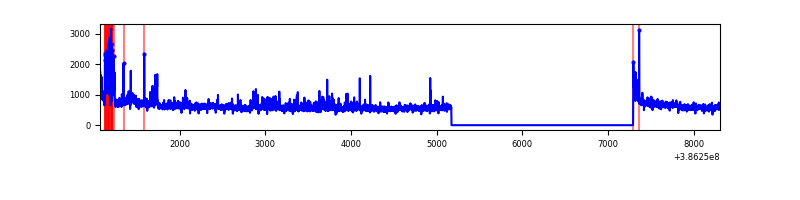 |
| B | 7239 | 5118 | 161 | 161 | 2.22% | 3.15% | 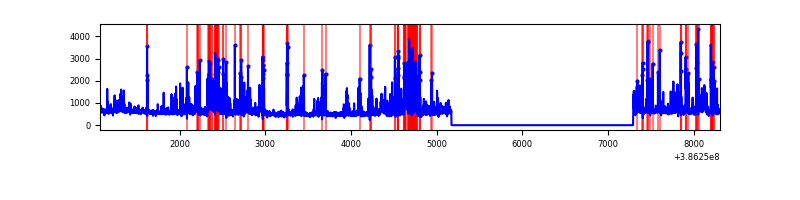 |
| C | 7239 | 5118 | 79 | 79 | 1.09% | 1.54% | 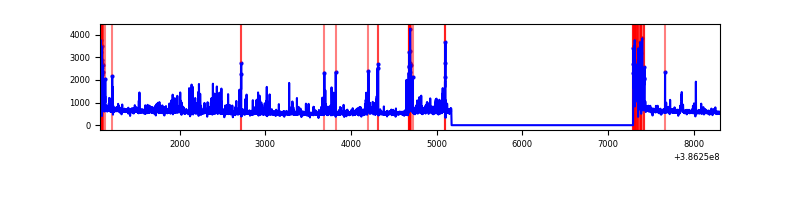 |
| D | 7239 | 5118 | 355 | 355 | 4.90% | 6.94% |  |
Top three noisy pixels from each quadrant. If the there are fewer than three noisy pixels in the level2.evt file, extra rows are filled as -1
| Pixel properties | Quadrant properties | ||||||
|---|---|---|---|---|---|---|---|
| Quadrant | DetID | PixID | Counts | Sigma | Mean | Median | Sigma |
| A | 15 | 169 | 542914 | 3905.43 | 698 | 689 | 138.8 |
| A | 10 | 83 | 72745 | 518.99 | 698 | 689 | 138.8 |
| A | 13 | 6 | 14919 | 102.49 | 698 | 689 | 138.8 |
| B | 5 | 236 | 847909 | 6708.78 | 672 | 658 | 126.3 |
| B | 5 | 172 | 251883 | 1989.27 | 672 | 658 | 126.3 |
| B | 4 | 232 | 75492 | 592.56 | 672 | 658 | 126.3 |
| C | 0 | 10 | 462990 | 3060.02 | 659 | 668 | 151.1 |
| C | 15 | 214 | 215614 | 1422.69 | 659 | 668 | 151.1 |
| C | 9 | 187 | 121186 | 797.69 | 659 | 668 | 151.1 |
| D | 8 | 195 | 2002329 | 12528.45 | 662 | 647 | 159.8 |
| D | 2 | 250 | 226442 | 1413.24 | 662 | 647 | 159.8 |
| D | 13 | 249 | 184785 | 1152.51 | 662 | 647 | 159.8 |
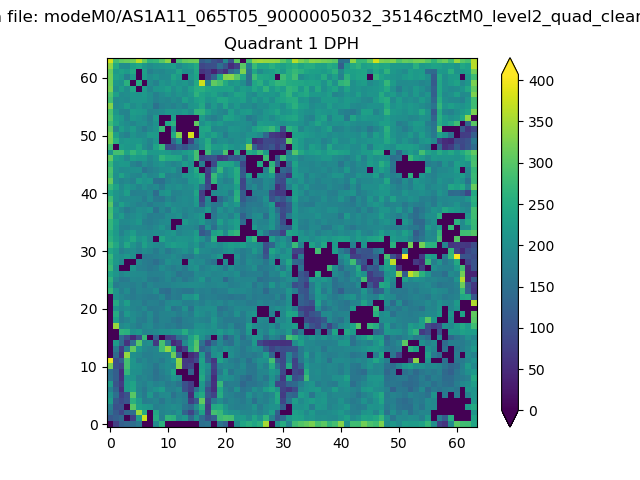
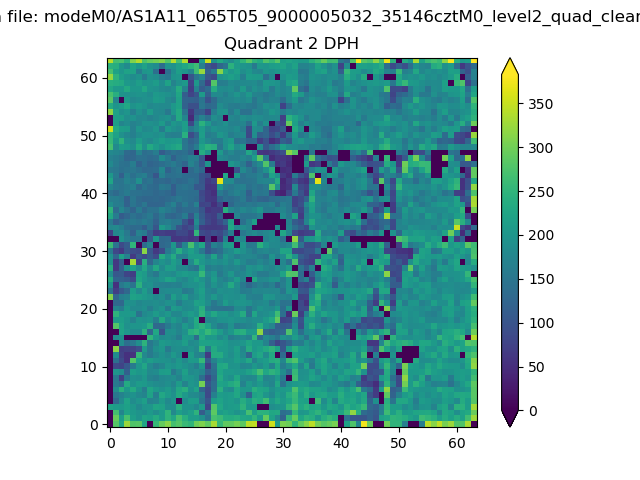
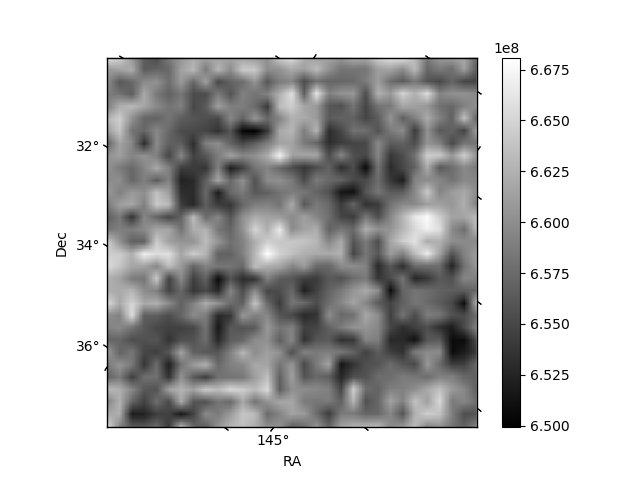
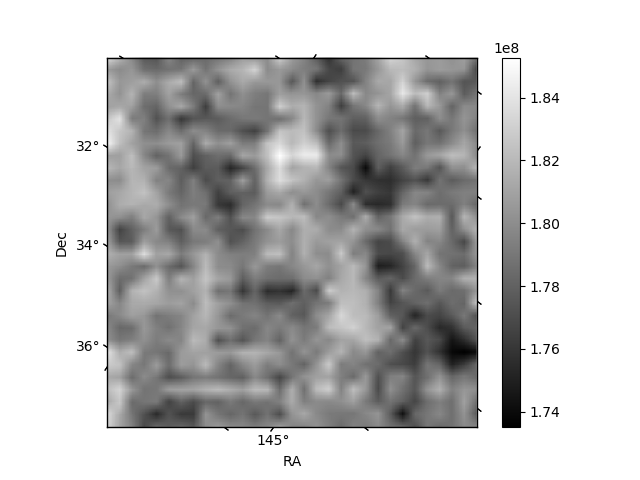
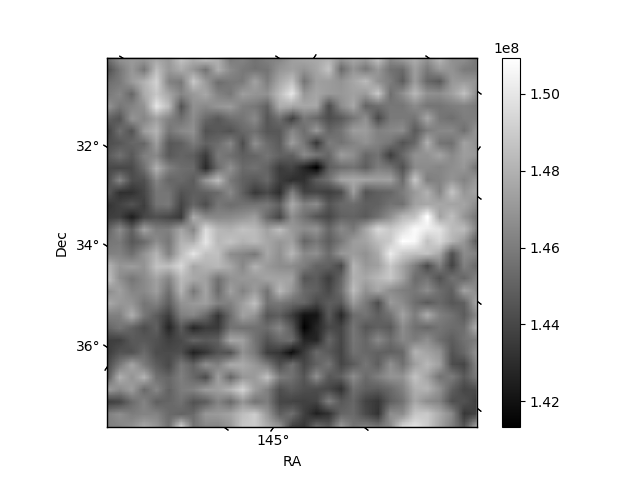
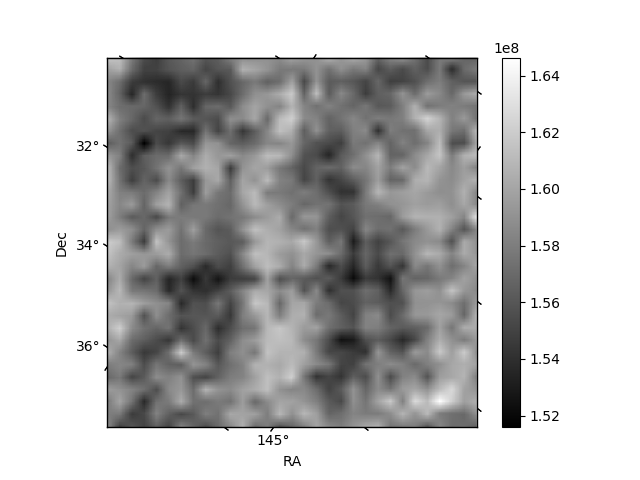
Histogram calculated using DETX and DETY for each event in the final _common_clean file
| Quadrant A | 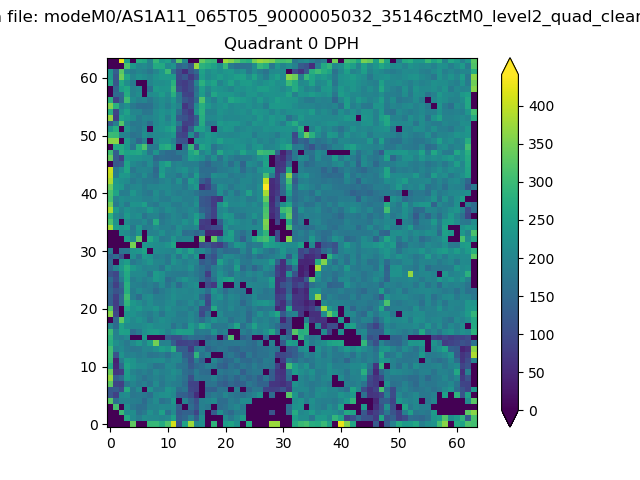 |
 |
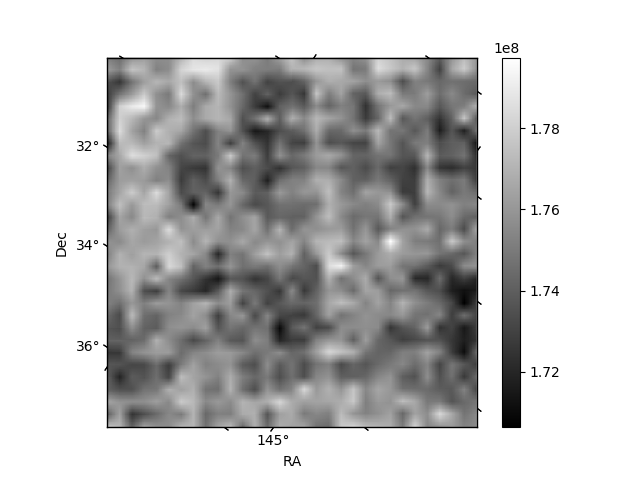
Quadrant B |
|---|---|---|---|
| Quadrant D | 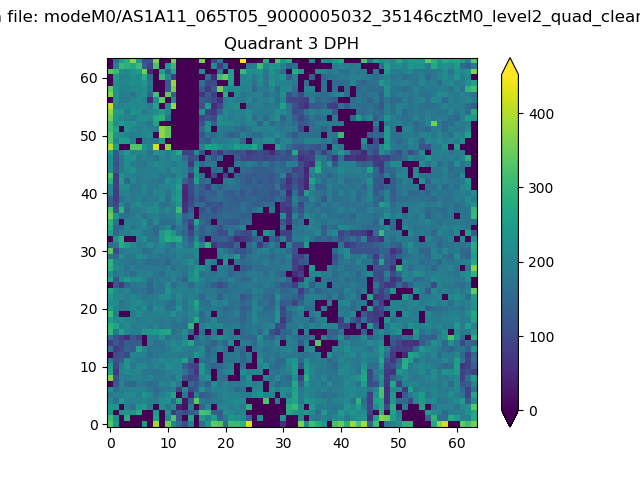 |
 |
Quadrant C |
| Plot type | Count rate plots | Images |
|---|---|---|
| Comparison with Poisson distribution Blue bars denote a histogram of data divided into 1 sec bins. Red curve is a Poisson curve with rate = median count rate of data. |
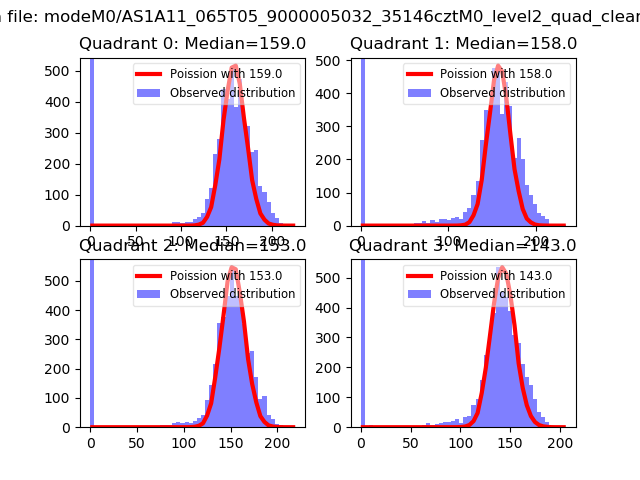 |
 |
| Quadrant-wise count rates Data is divided into 100 sec bins |
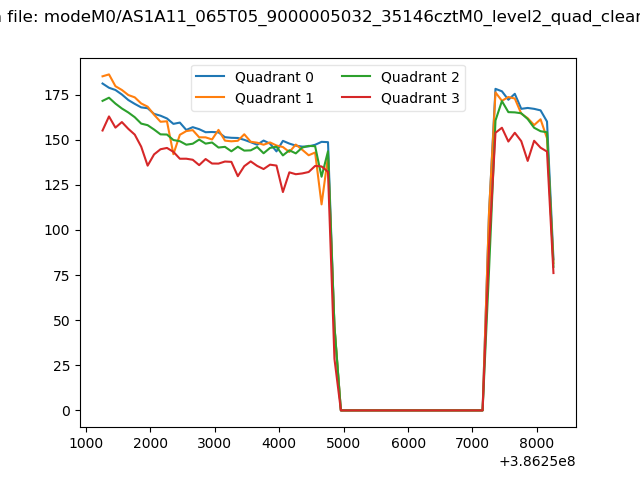 |
|
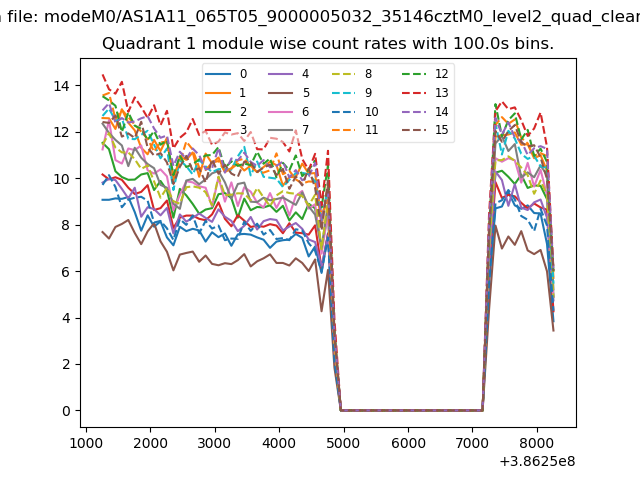
| Module-wise count rates for Quadrant A Data is divided into 100 sec bins |
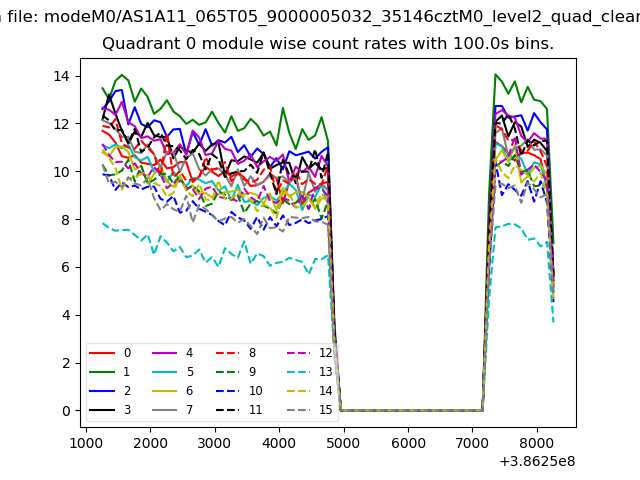 |
 |
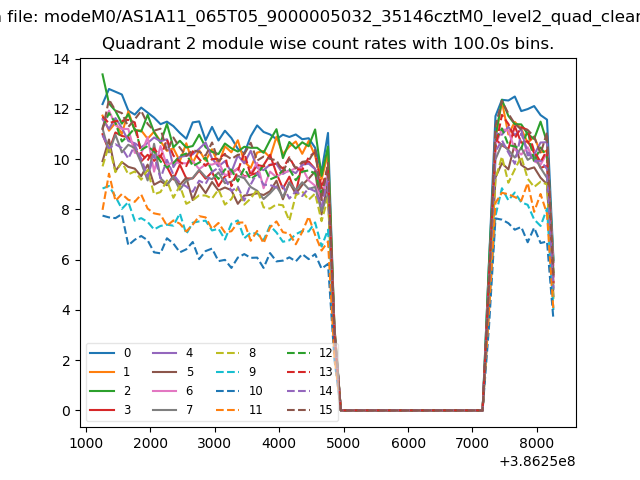
| Module-wise count rates for Quadrant B Data is divided into 100 sec bins |
 |
 |
| Module-wise count rates for Quadrant C Data is divided into 100 sec bins |
 |
 |
| Module-wise count rates for Quadrant D Data is divided into 100 sec bins |
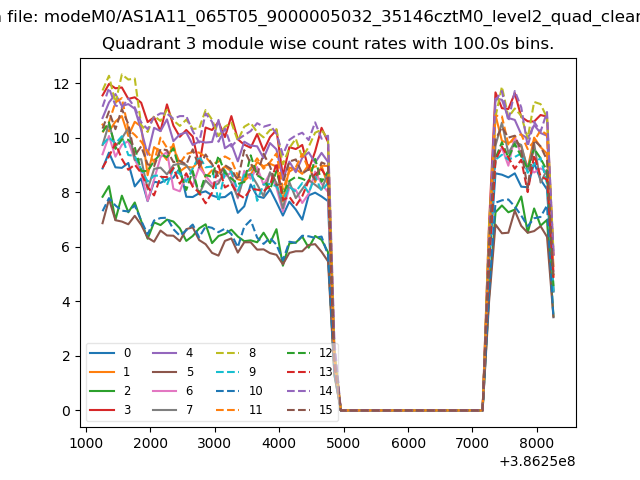 |
 |
| Parameter | Plot |
|---|---|
| CZT HV Monitor | 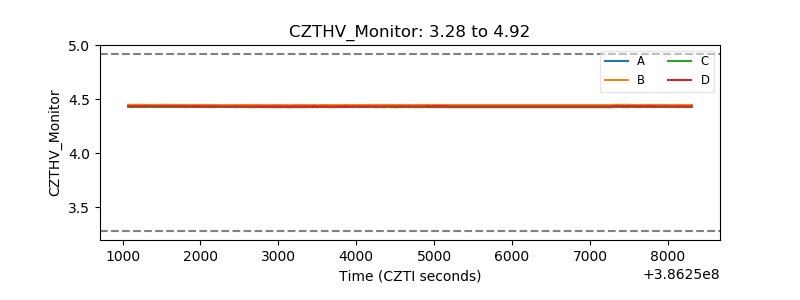 |
| D_VDD | 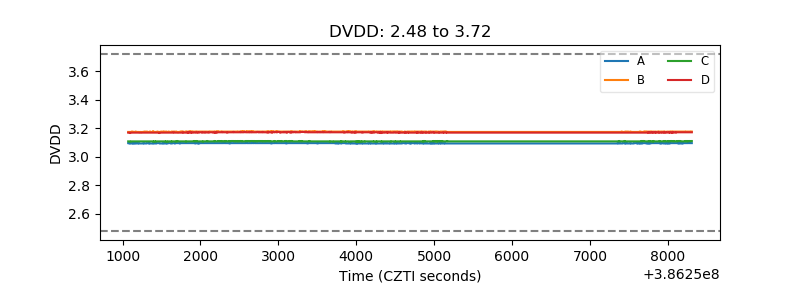 |
| Temperature 1 |  |
| Veto HV Monitor |  |
| Veto LLD | 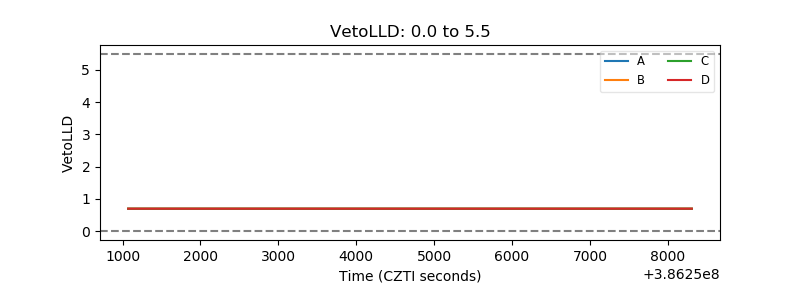 |
| Alpha Counter | 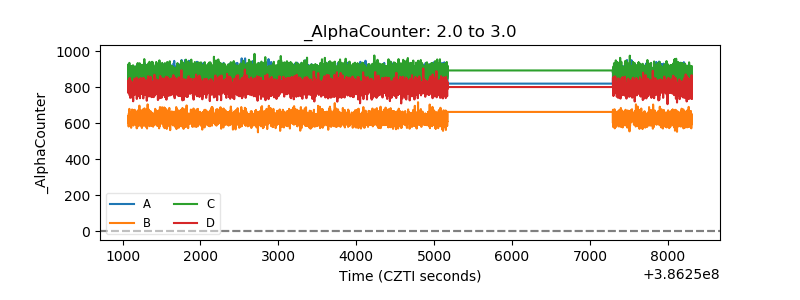 |
| _CPM_Rate | 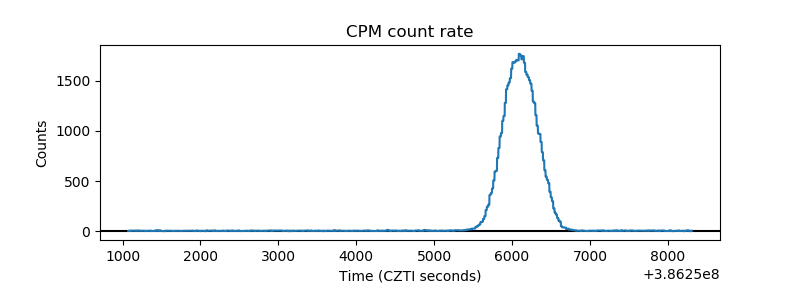 |
| CZT Counter |  |
| +2.5 Volts monitor | 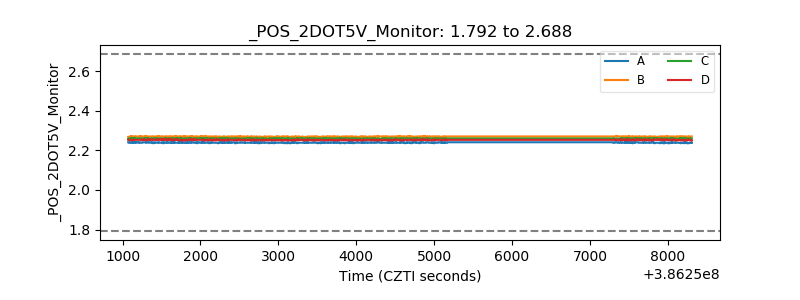 |
| +5 Volts monitor | 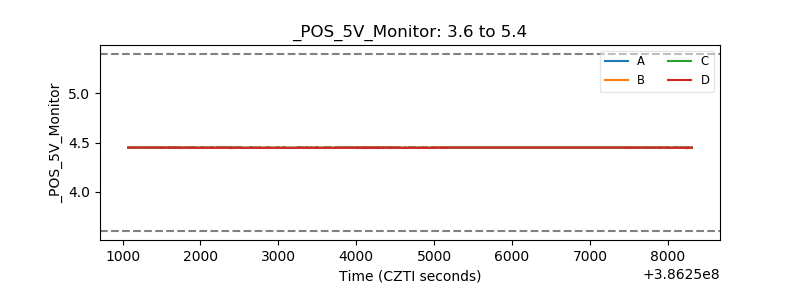 |
| _ROLL_ROT | 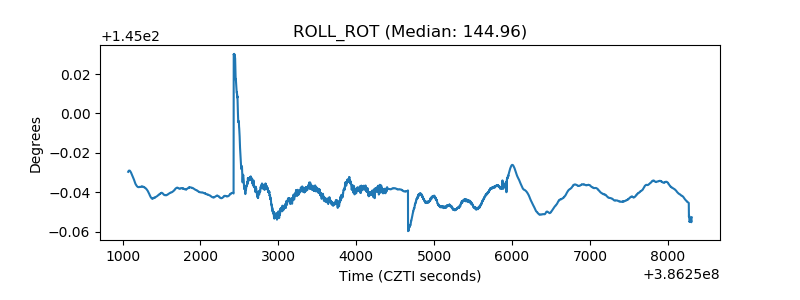 |
| _Roll_DEC | 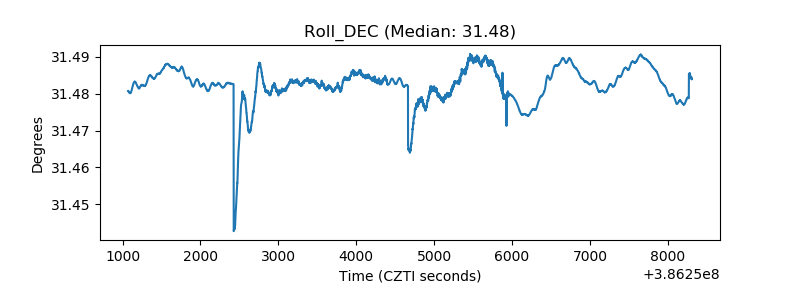 |
| _Roll_RA | 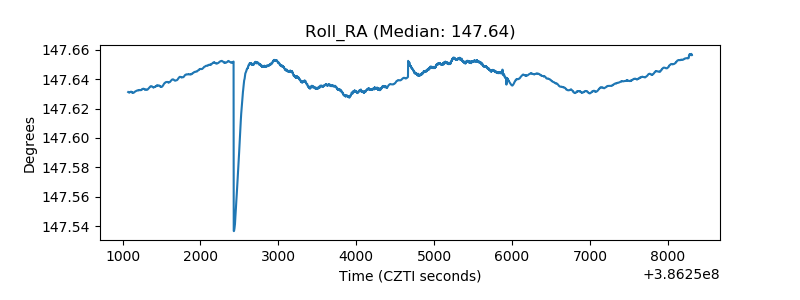 |
| Veto Counter | 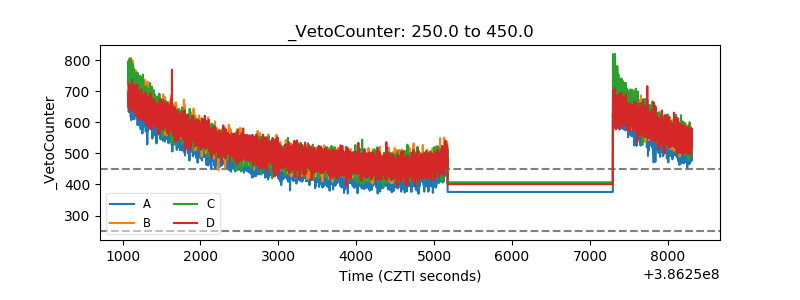 |