| Param | Original file | Final file |
|---|---|---|
| Filename | modeM0/AS1A11_065T05_9000005032_35145cztM0_level2.evt | modeM0/AS1A11_065T05_9000005032_35145cztM0_level2_quad_clean.evt |
| Size (bytes) | 96,652,800 | 15,085,440 |
| Size | 92.2 MB | 14.4 MB |
| Events in quadrant A | 785,965 | 100,448 |
| Events in quadrant B | 557,321 | 102,608 |
| Events in quadrant C | 723,064 | 96,277 |
| Events in quadrant D | 801,136 | 91,092 |
| Mode M0 | |||
|---|---|---|---|
| Quadrant | BADHDUFLAG | Total packets | Discarded packets |
| A | 0 | 2972 | 2 |
| B | 0 | 2307 | 1 |
| C | 0 | 2839 | 1 |
| D | 0 | 3021 | 1 |
| Mode M9 | |||
|---|---|---|---|
| Quadrant | BADHDUFLAG | Total packets | Discarded packets |
| A | 0 | 14 | 0 |
| B | 0 | 14 | 0 |
| C | 0 | 14 | 0 |
| D | 0 | 14 | 0 |
| Mode SS | |||
|---|---|---|---|
| Quadrant | BADHDUFLAG | Total packets | Discarded packets |
| A | 0 | 18 | 0 |
| B | 0 | 18 | 0 |
| C | 0 | 18 | 0 |
| D | 0 | 18 | 0 |
| Quadrant | Total seconds | Saturated seconds | Saturation percentage |
|---|---|---|---|
| A | 832 | 81 | 9.735577% |
| B | 832 | 10 | 1.201923% |
| C | 832 | 93 | 11.177885% |
| D | 832 | 45 | 5.408654% |
Noise dominated data is calculated using 1-second bins in cleaned event files. If a bin has >2000 counts, and if more than 50% of those come from <1% of pixels, then it is considered to be noise-dominated and hence unusable.
| Quadrant | # 1 sec bins | Bins with >0 counts | Bins with >2000 counts | High rate bins dominated by noise | Noise dominated (total time) | Noise dominated (detector-on time) | Marked lightcurve |
|---|---|---|---|---|---|---|---|
| A | 832 | 832 | 24 | 24 | 2.88% | 2.88% | 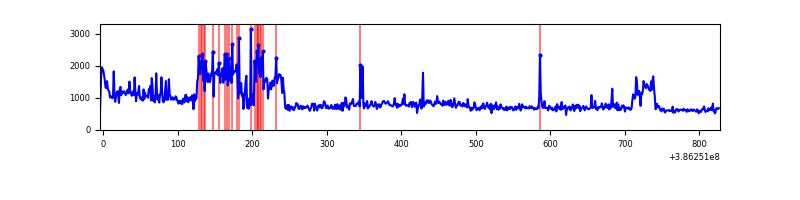 |
| B | 832 | 832 | 3 | 3 | 0.36% | 0.36% | 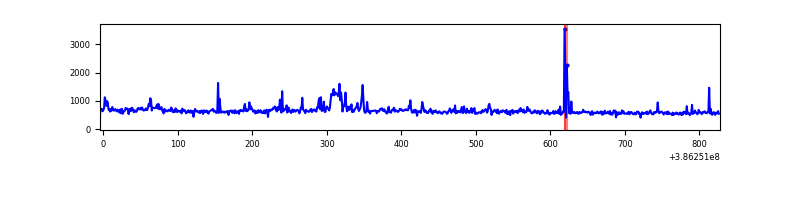 |
| C | 832 | 832 | 63 | 63 | 7.57% | 7.57% | 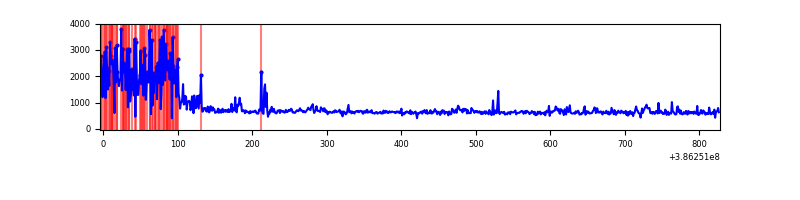 |
| D | 832 | 832 | 23 | 23 | 2.76% | 2.76% | 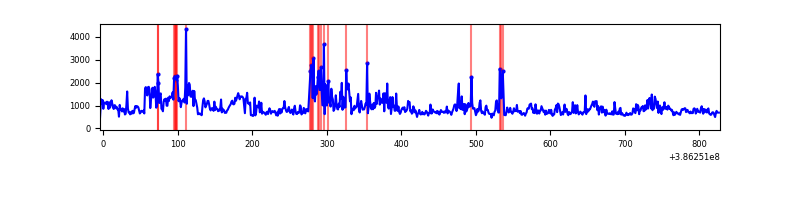 |
Top three noisy pixels from each quadrant. If the there are fewer than three noisy pixels in the level2.evt file, extra rows are filled as -1
| Pixel properties | Quadrant properties | ||||||
|---|---|---|---|---|---|---|---|
| Quadrant | DetID | PixID | Counts | Sigma | Mean | Median | Sigma |
| A | 15 | 169 | 255539 | 9554.24 | 127 | 126 | 26.7 |
| A | 10 | 83 | 33836 | 1260.99 | 127 | 126 | 26.7 |
| A | 13 | 6 | 2645 | 94.23 | 127 | 126 | 26.7 |
| B | 5 | 172 | 32136 | 1229.98 | 126 | 123 | 26.0 |
| B | 4 | 232 | 14957 | 569.94 | 126 | 123 | 26.0 |
| B | 3 | 112 | 9216 | 349.36 | 126 | 123 | 26.0 |
| C | 0 | 10 | 222206 | 7987.78 | 115 | 116 | 27.8 |
| C | 15 | 214 | 38695 | 1387.55 | 115 | 116 | 27.8 |
| C | 9 | 187 | 5816 | 205.01 | 115 | 116 | 27.8 |
| D | 8 | 195 | 194442 | 6223.12 | 122 | 119 | 31.2 |
| D | 2 | 250 | 95335 | 3049.25 | 122 | 119 | 31.2 |
| D | 13 | 249 | 16410 | 521.71 | 122 | 119 | 31.2 |
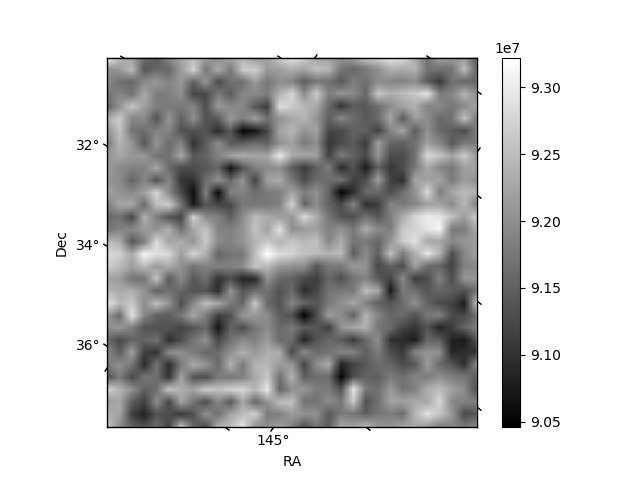
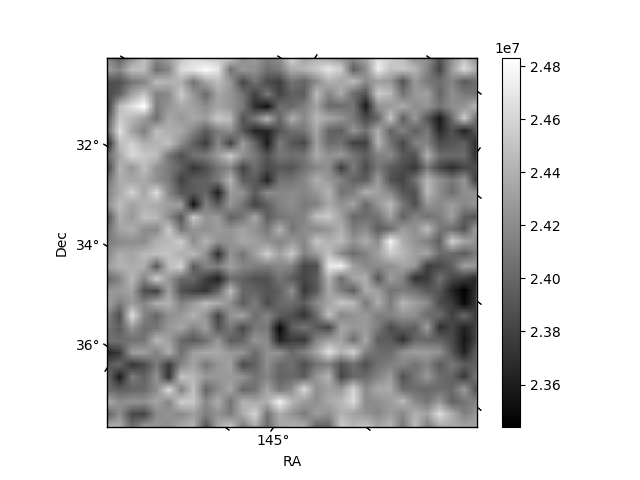
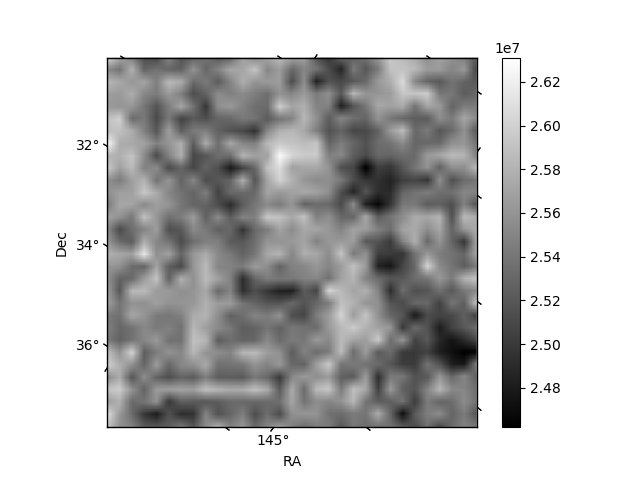
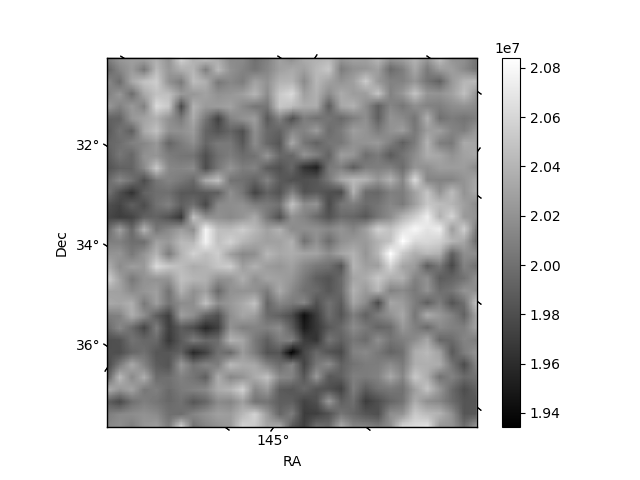
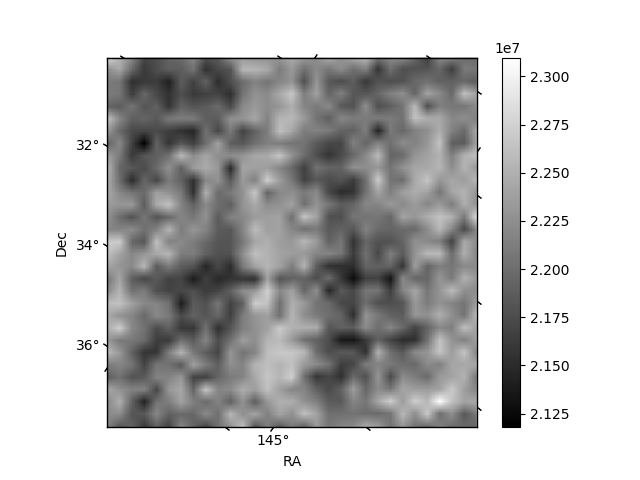
Histogram calculated using DETX and DETY for each event in the final _common_clean file
| Quadrant A | 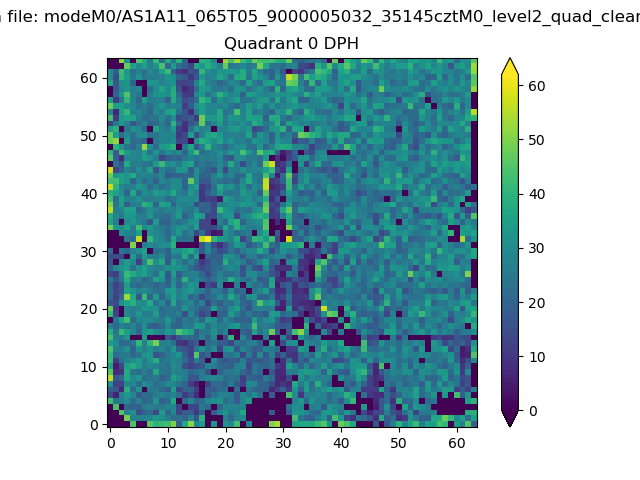 |
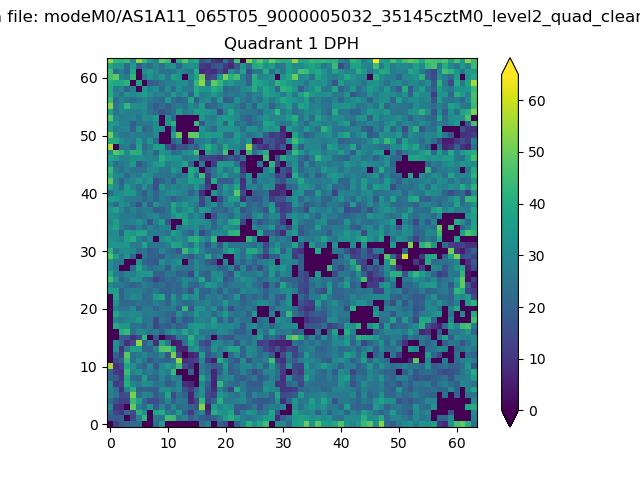 |
Quadrant B |
|---|---|---|---|
| Quadrant D | 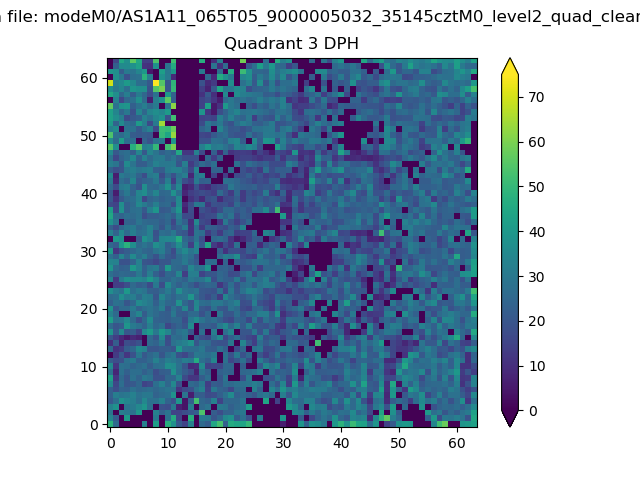 |
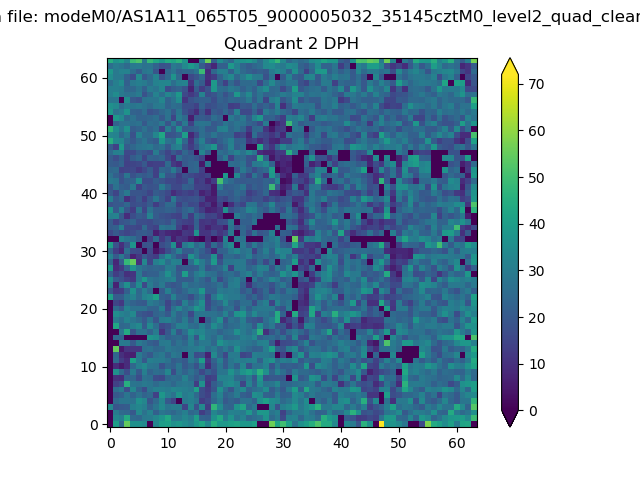 |
Quadrant C |
| Plot type | Count rate plots | Images |
|---|---|---|
| Comparison with Poisson distribution Blue bars denote a histogram of data divided into 1 sec bins. Red curve is a Poisson curve with rate = median count rate of data. |
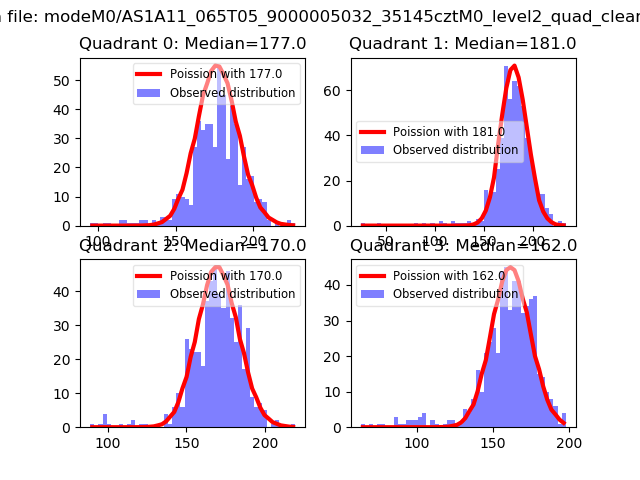 |
 |
| Quadrant-wise count rates Data is divided into 100 sec bins |
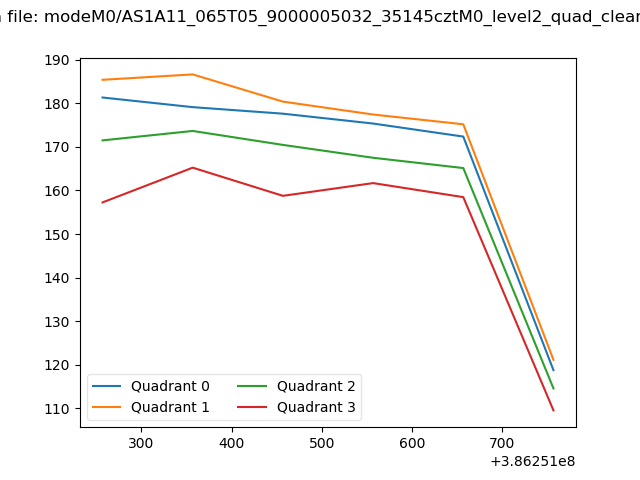 |
|
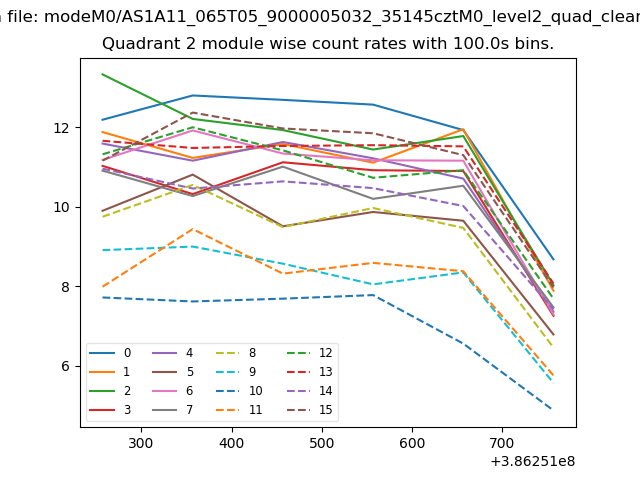
| Module-wise count rates for Quadrant A Data is divided into 100 sec bins |
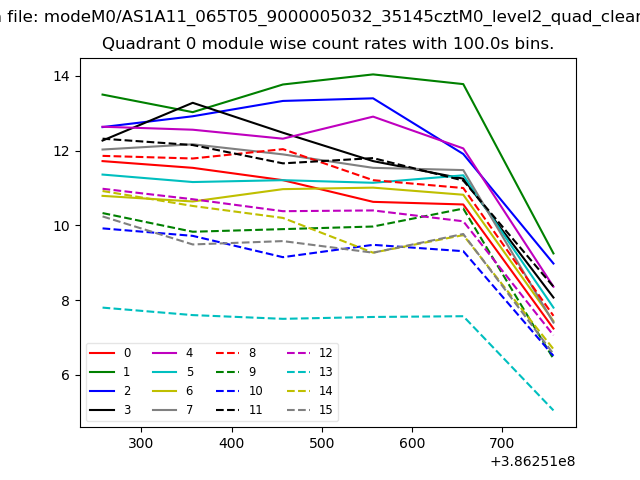 |
 |
| Module-wise count rates for Quadrant B Data is divided into 100 sec bins |
 |
 |
| Module-wise count rates for Quadrant C Data is divided into 100 sec bins |
 |
 |
| Module-wise count rates for Quadrant D Data is divided into 100 sec bins |
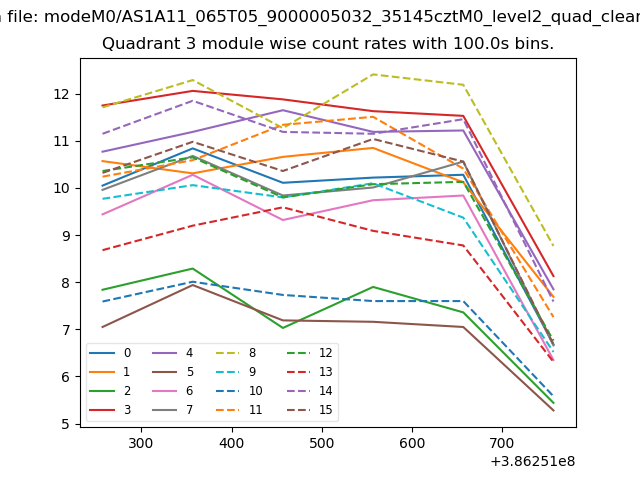 |
 |
| Parameter | Plot |
|---|---|
| CZT HV Monitor | 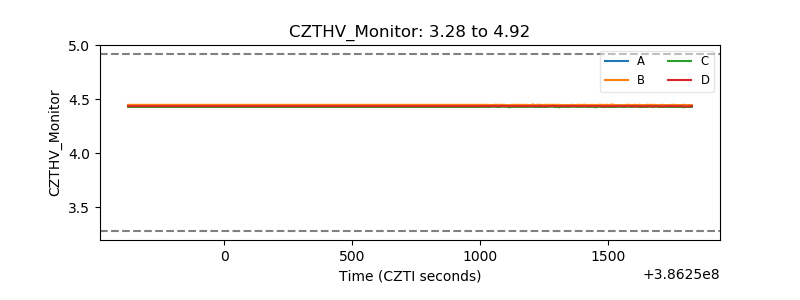 |
| D_VDD | 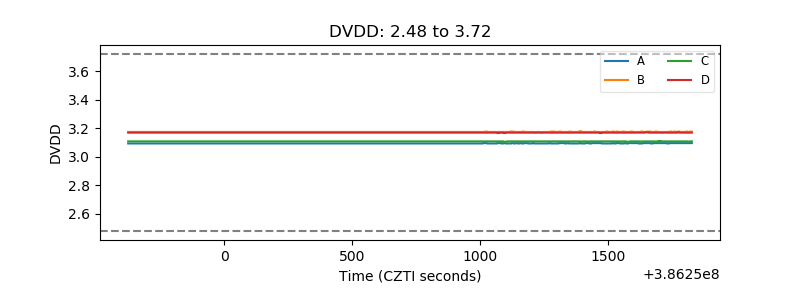 |
| Temperature 1 | 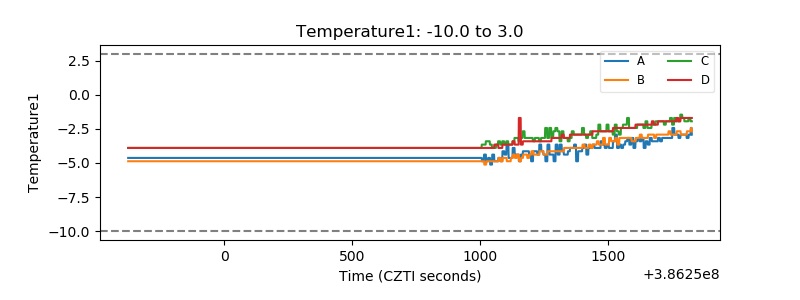 |
| Veto HV Monitor | 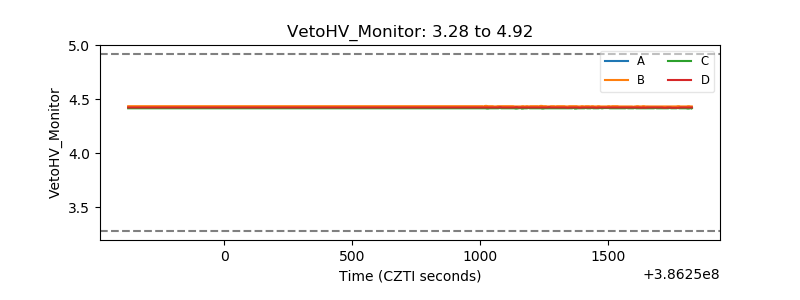 |
| Veto LLD | 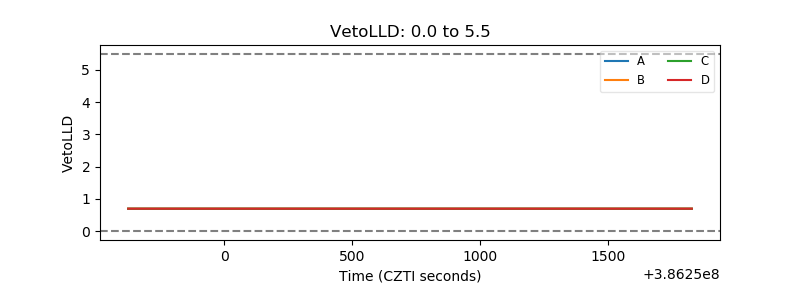 |
| Alpha Counter | 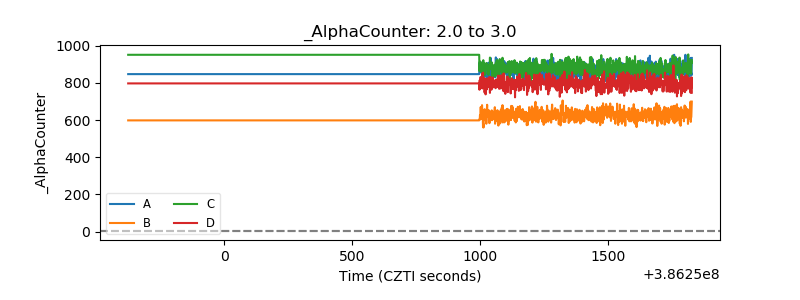 |
| _CPM_Rate | 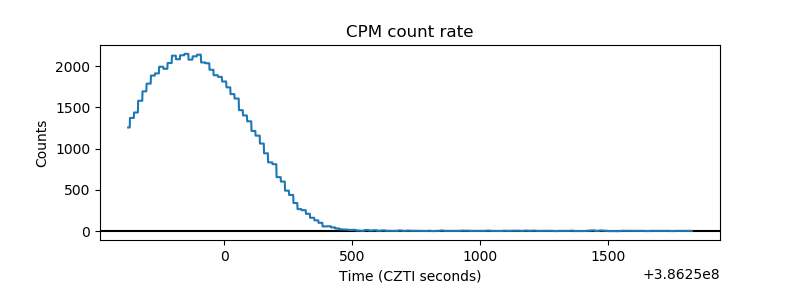 |
| CZT Counter | 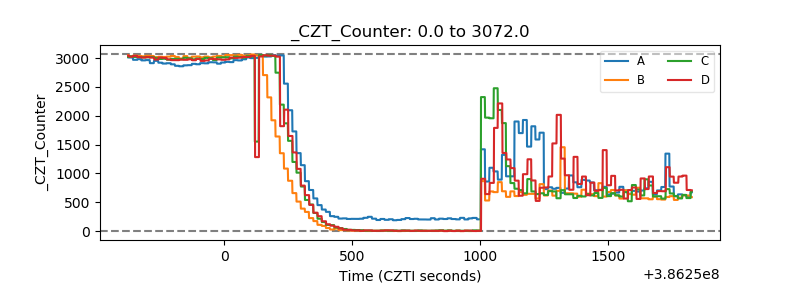 |
| +2.5 Volts monitor | 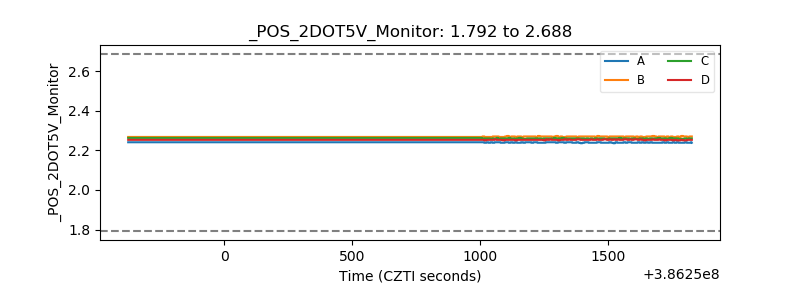 |
| +5 Volts monitor | 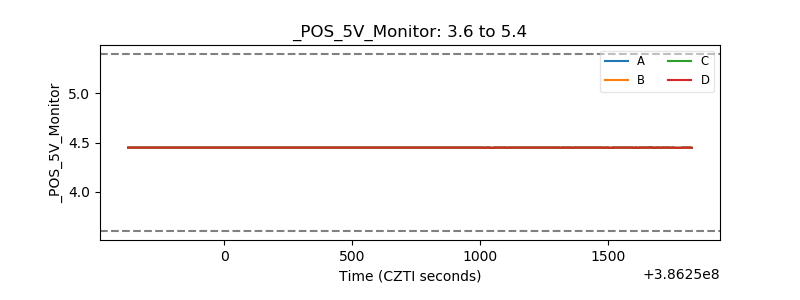 |
| _ROLL_ROT | 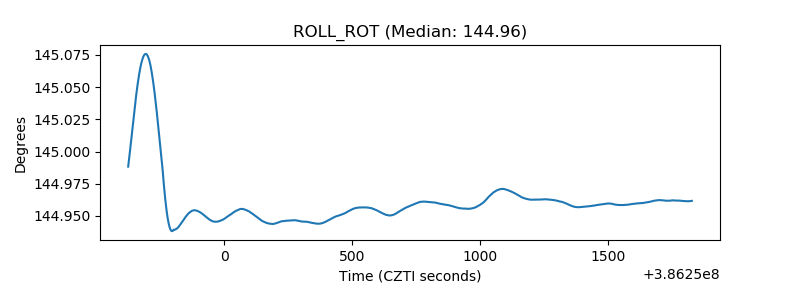 |
| _Roll_DEC | 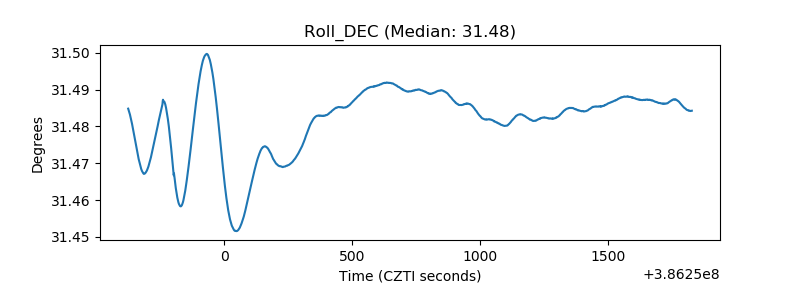 |
| _Roll_RA | 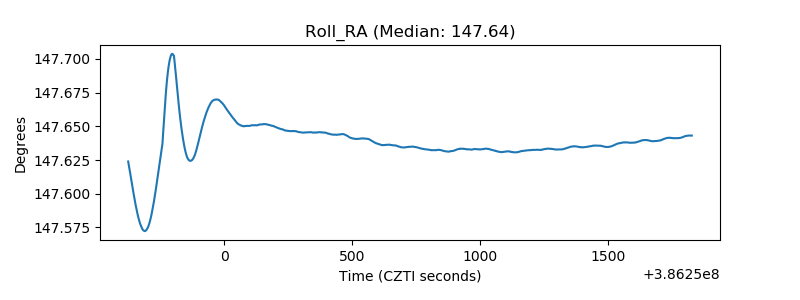 |
| Veto Counter | 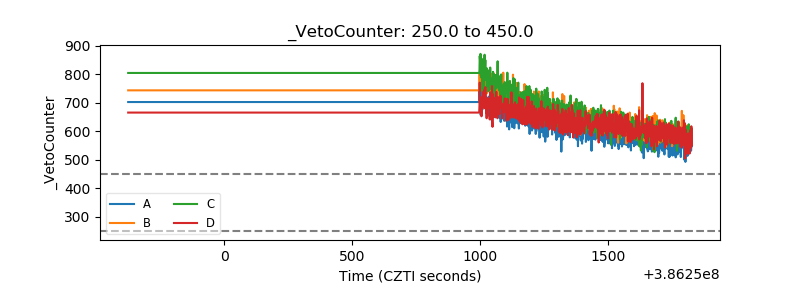 |