| Param | Original file | Final file |
|---|---|---|
| Filename | modeM0/AS1A11_037T01_9000005030_35140cztM0_level2.evt | modeM0/AS1A11_037T01_9000005030_35140cztM0_level2_quad_clean.evt |
| Size (bytes) | 92,010,240 | 19,321,920 |
| Size | 87.7 MB | 18.4 MB |
| Events in quadrant A | 522,663 | 131,232 |
| Events in quadrant B | 562,050 | 133,066 |
| Events in quadrant C | 662,528 | 124,685 |
| Events in quadrant D | 968,083 | 118,263 |
| Mode M0 | |||
|---|---|---|---|
| Quadrant | BADHDUFLAG | Total packets | Discarded packets |
| A | 0 | 2159 | 2 |
| B | 0 | 2276 | 1 |
| C | 0 | 2538 | 1 |
| D | 0 | 3593 | 1 |
| Mode SS | |||
|---|---|---|---|
| Quadrant | BADHDUFLAG | Total packets | Discarded packets |
| A | 0 | 20 | 0 |
| B | 0 | 20 | 0 |
| C | 0 | 20 | 0 |
| D | 0 | 20 | 0 |
| Mode M9 | |||
|---|---|---|---|
| Quadrant | BADHDUFLAG | Total packets | Discarded packets |
| A | 0 | 11 | 0 |
| B | 0 | 11 | 0 |
| C | 0 | 11 | 0 |
| D | 0 | 11 | 0 |
| Quadrant | Total seconds | Saturated seconds | Saturation percentage |
|---|---|---|---|
| A | 1005 | 2 | 0.199005% |
| B | 1005 | 32 | 3.184080% |
| C | 1005 | 49 | 4.875622% |
| D | 1005 | 42 | 4.179104% |
Noise dominated data is calculated using 1-second bins in cleaned event files. If a bin has >2000 counts, and if more than 50% of those come from <1% of pixels, then it is considered to be noise-dominated and hence unusable.
| Quadrant | # 1 sec bins | Bins with >0 counts | Bins with >2000 counts | High rate bins dominated by noise | Noise dominated (total time) | Noise dominated (detector-on time) | Marked lightcurve |
|---|---|---|---|---|---|---|---|
| A | 1005 | 1005 | 0 | 0 | 0.00% | 0.00% | 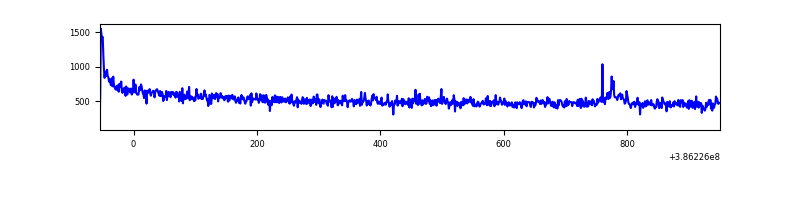 |
| B | 1005 | 1005 | 17 | 17 | 1.69% | 1.69% | 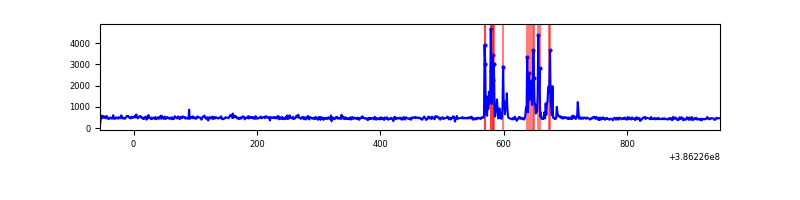 |
| C | 1005 | 1005 | 29 | 29 | 2.89% | 2.89% | 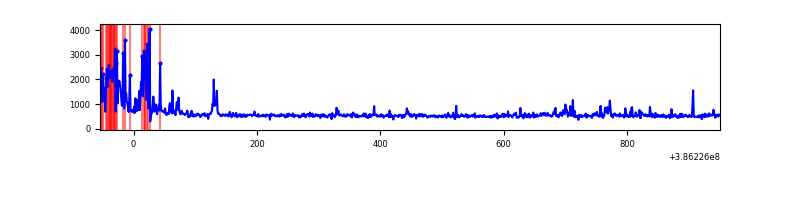 |
| D | 1005 | 1005 | 24 | 24 | 2.39% | 2.39% | 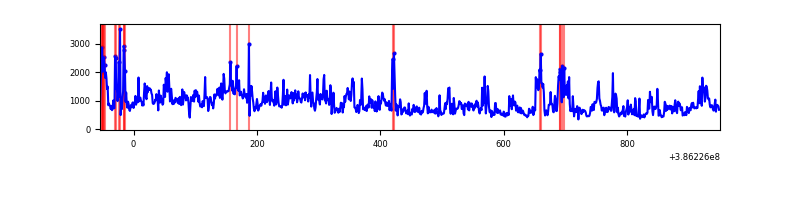 |
Top three noisy pixels from each quadrant. If the there are fewer than three noisy pixels in the level2.evt file, extra rows are filled as -1
| Pixel properties | Quadrant properties | ||||||
|---|---|---|---|---|---|---|---|
| Quadrant | DetID | PixID | Counts | Sigma | Mean | Median | Sigma |
| A | 10 | 83 | 35317 | 1344.22 | 119 | 116 | 26.2 |
| A | 15 | 169 | 21743 | 825.87 | 119 | 116 | 26.2 |
| A | 13 | 6 | 3599 | 133.0 | 119 | 116 | 26.2 |
| B | 3 | 112 | 86124 | 3407.9 | 119 | 116 | 25.2 |
| B | 5 | 172 | 6126 | 238.13 | 119 | 116 | 25.2 |
| B | 12 | 111 | 2868 | 109.04 | 119 | 116 | 25.2 |
| C | 0 | 10 | 137329 | 4737.91 | 117 | 118 | 29.0 |
| C | 15 | 214 | 45394 | 1563.38 | 117 | 118 | 29.0 |
| C | 0 | 207 | 7333 | 249.13 | 117 | 118 | 29.0 |
| D | 5 | 223 | 214023 | 7245.42 | 116 | 112 | 29.5 |
| D | 8 | 195 | 194644 | 6589.03 | 116 | 112 | 29.5 |
| D | 12 | 79 | 44456 | 1501.98 | 116 | 112 | 29.5 |
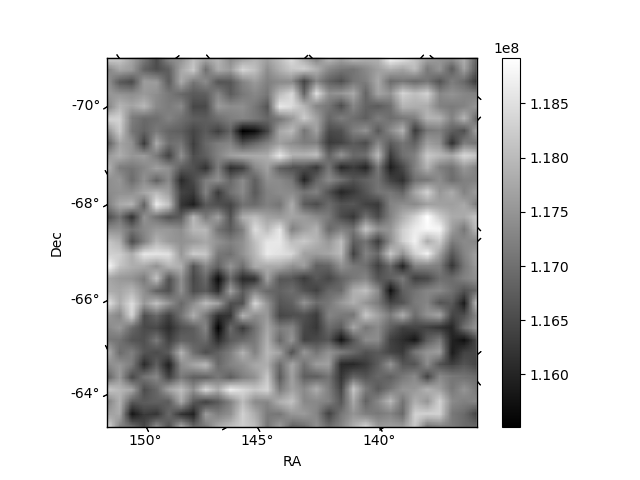
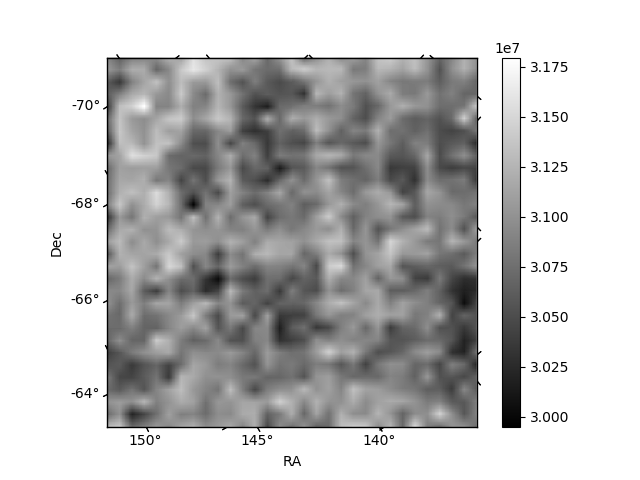
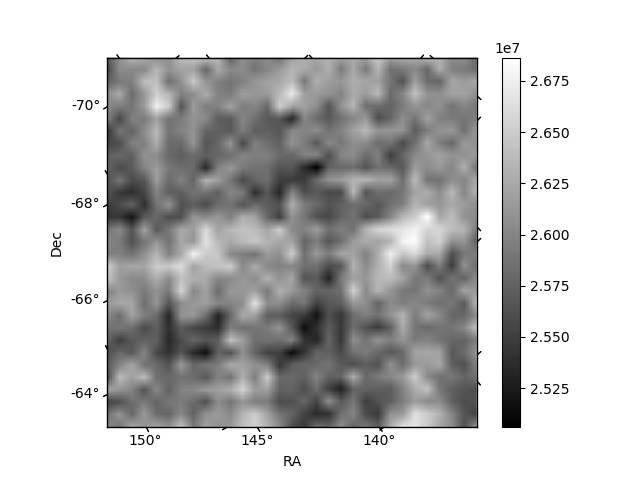
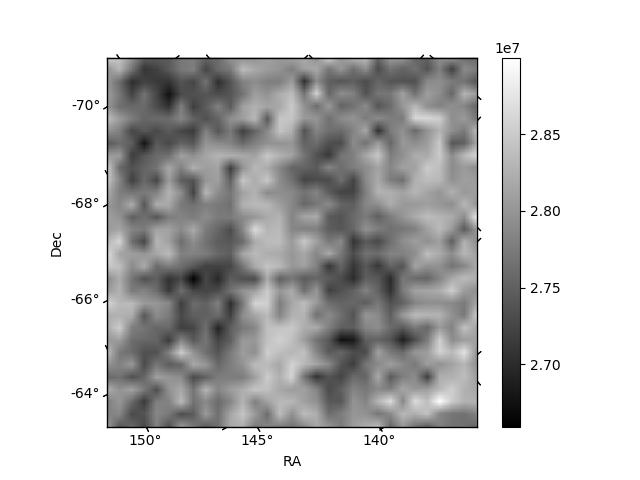
Histogram calculated using DETX and DETY for each event in the final _common_clean file
| Quadrant A | 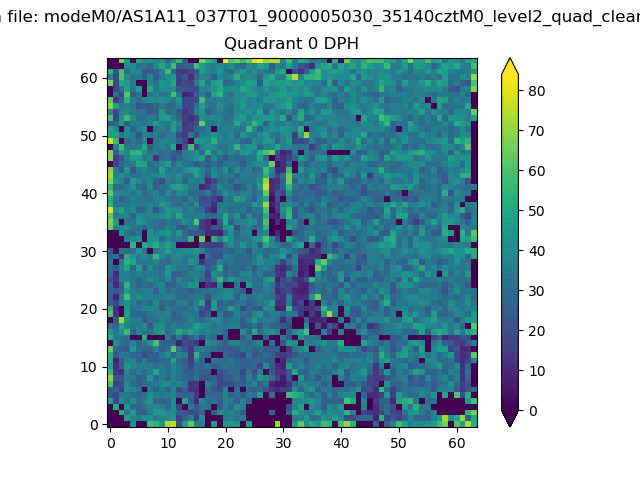 |
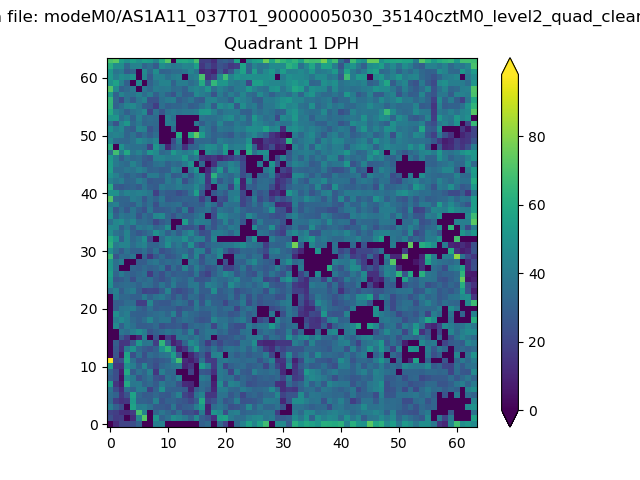 |
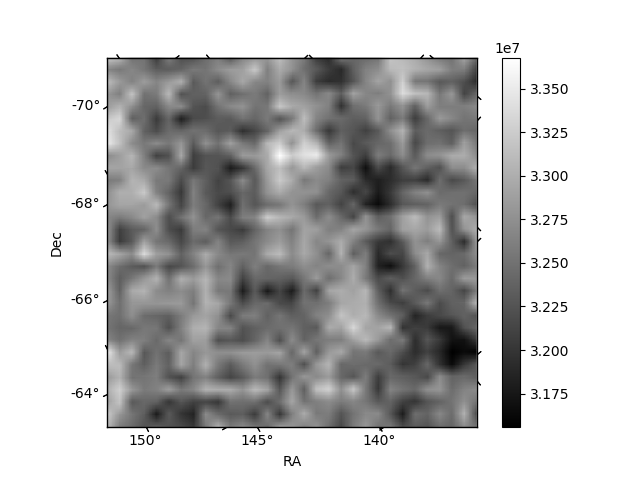
Quadrant B |
|---|---|---|---|
| Quadrant D | 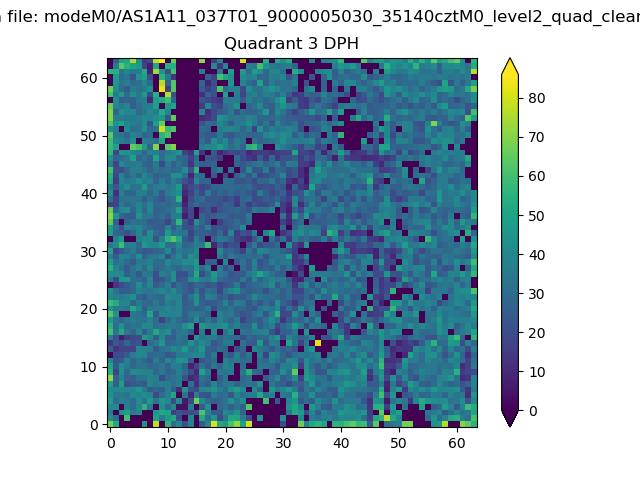 |
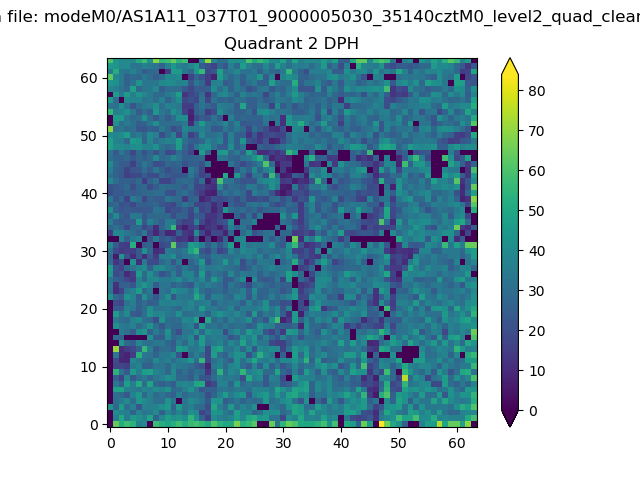 |
Quadrant C |
| Plot type | Count rate plots | Images |
|---|---|---|
| Comparison with Poisson distribution Blue bars denote a histogram of data divided into 1 sec bins. Red curve is a Poisson curve with rate = median count rate of data. |
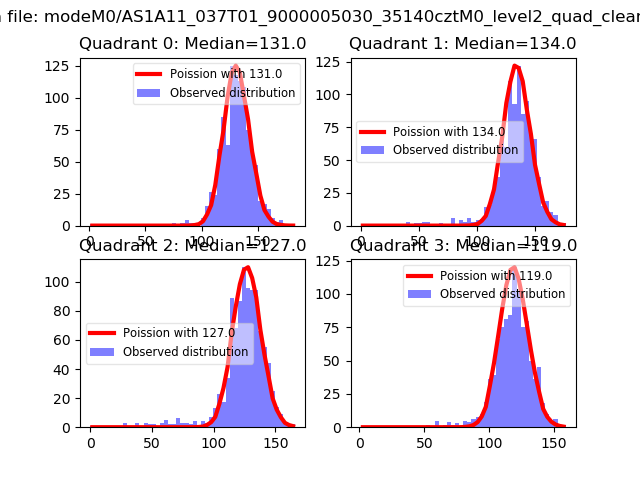 |
 |
| Quadrant-wise count rates Data is divided into 100 sec bins |
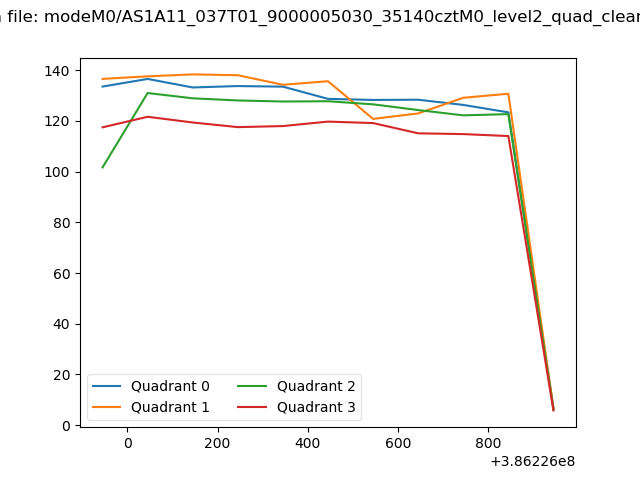 |
|
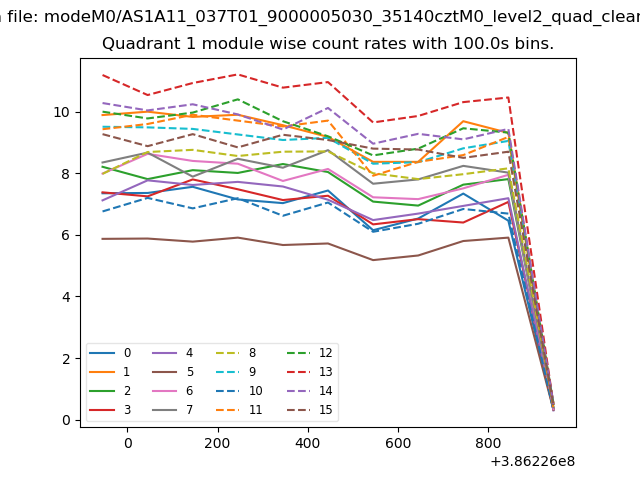
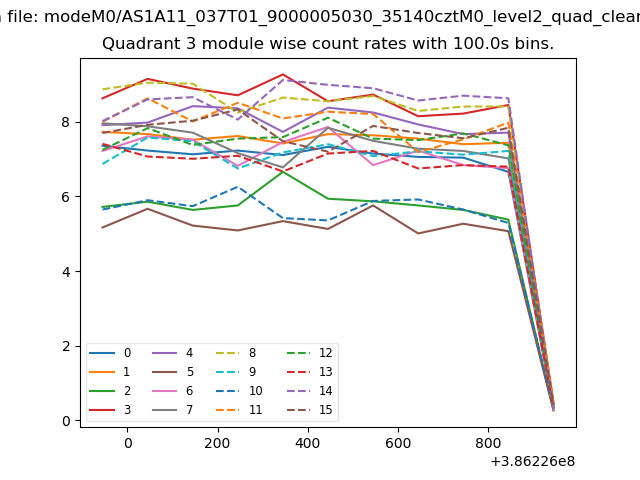
| Module-wise count rates for Quadrant A Data is divided into 100 sec bins |
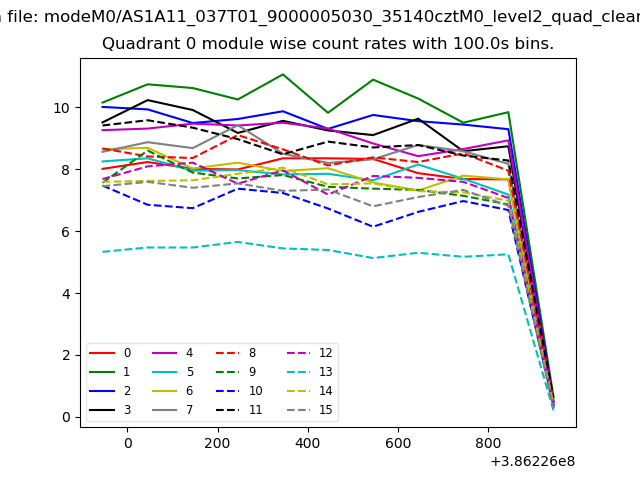 |
 |
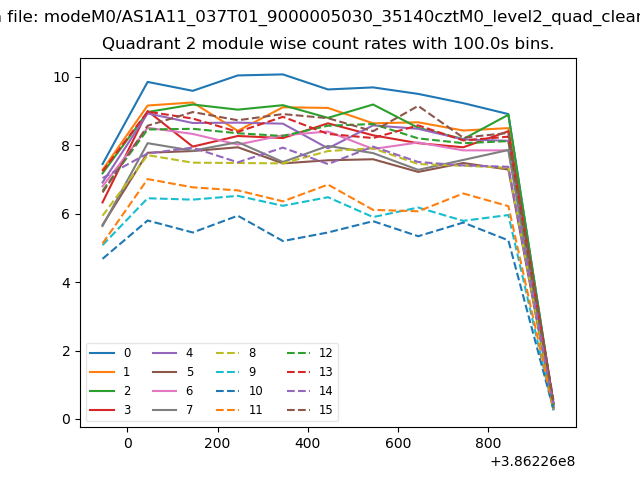
| Module-wise count rates for Quadrant B Data is divided into 100 sec bins |
 |
 |
| Module-wise count rates for Quadrant C Data is divided into 100 sec bins |
 |
 |
| Module-wise count rates for Quadrant D Data is divided into 100 sec bins |
 |
 |
| Parameter | Plot |
|---|---|
| CZT HV Monitor | 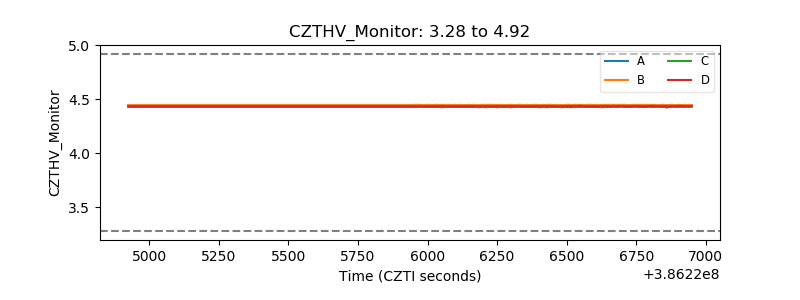 |
| D_VDD | 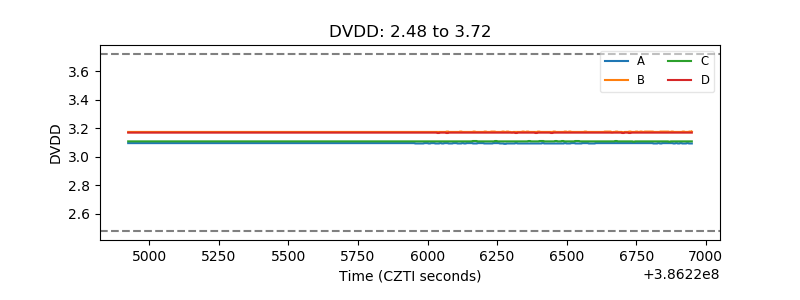 |
| Temperature 1 | 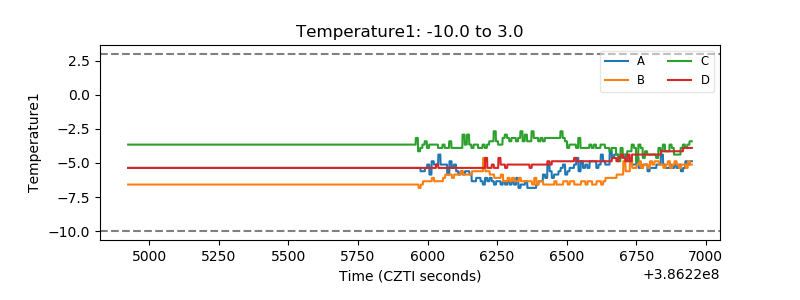 |
| Veto HV Monitor | 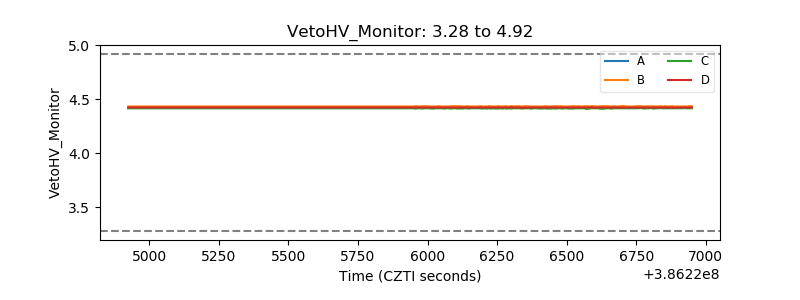 |
| Veto LLD | 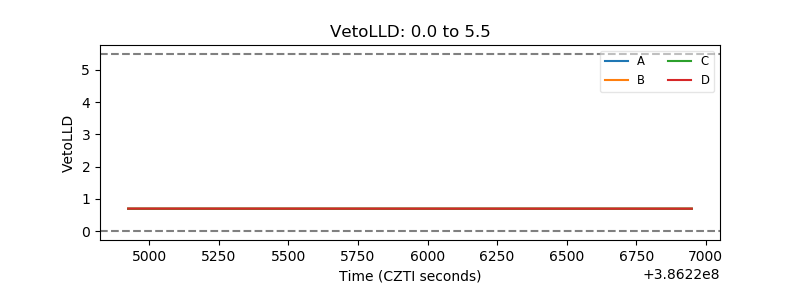 |
| Alpha Counter | 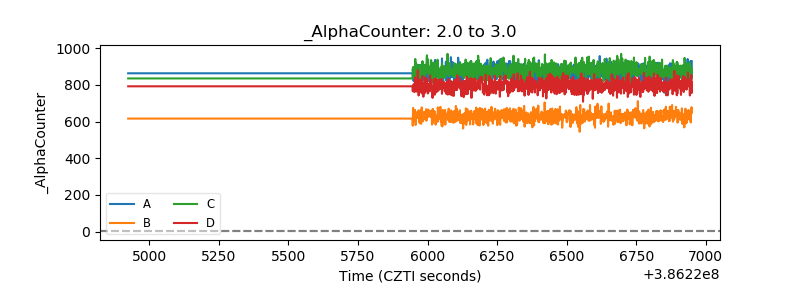 |
| _CPM_Rate | 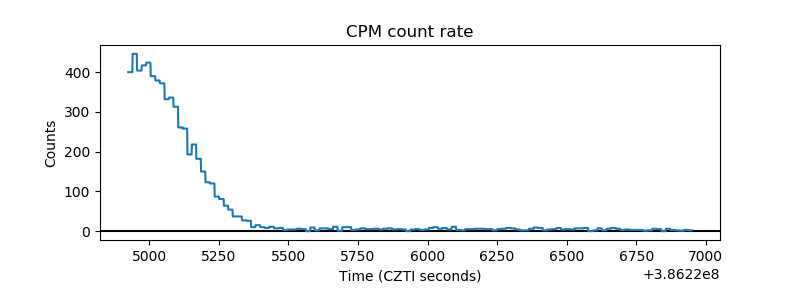 |
| CZT Counter | 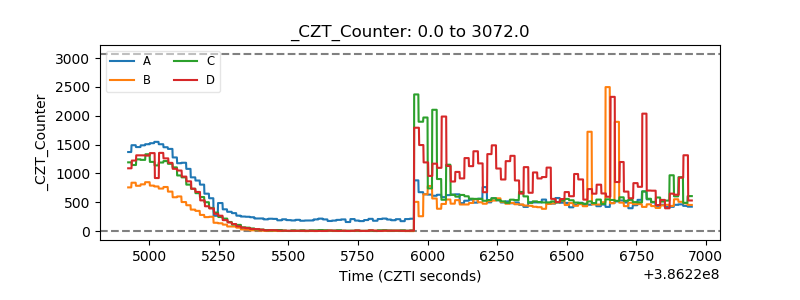 |
| +2.5 Volts monitor | 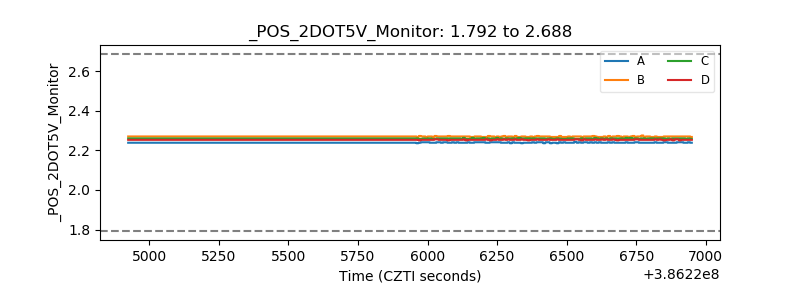 |
| +5 Volts monitor | 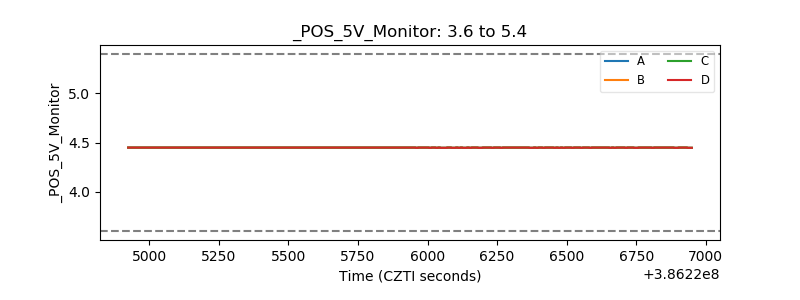 |
| _ROLL_ROT | 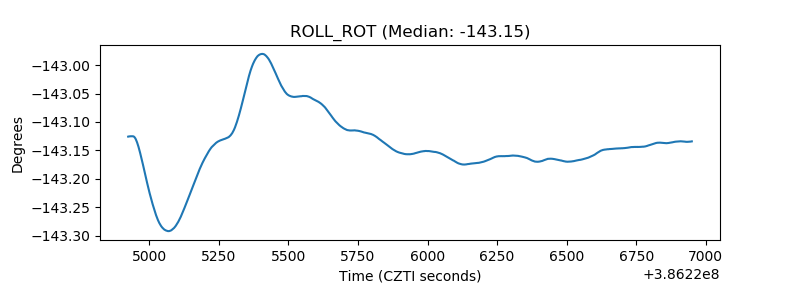 |
| _Roll_DEC | 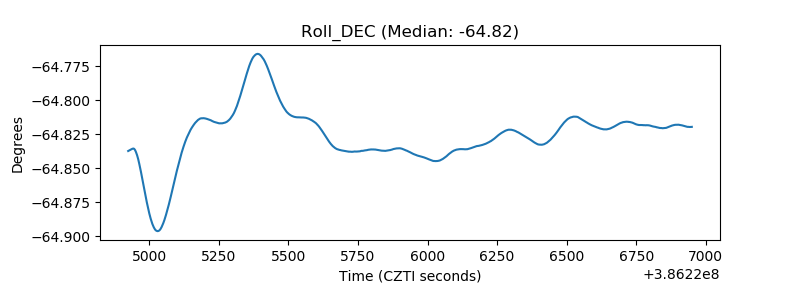 |
| _Roll_RA | 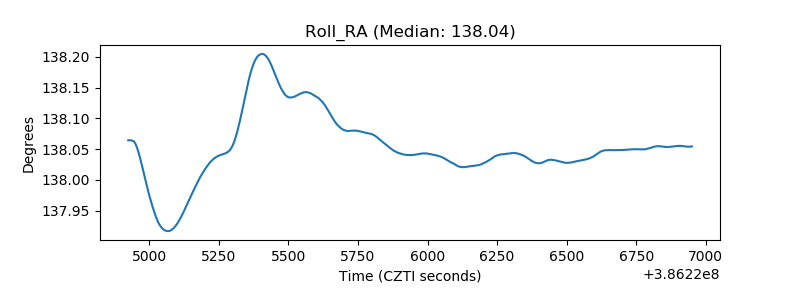 |
| Veto Counter | 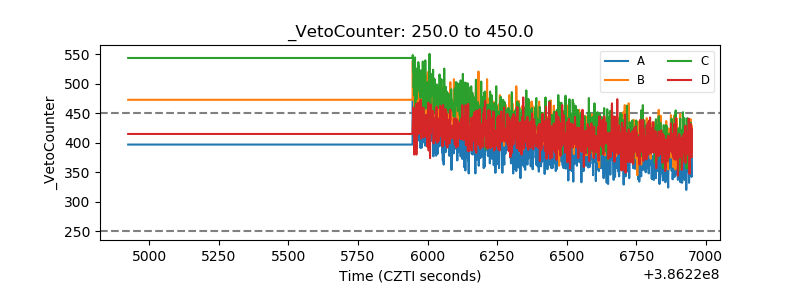 |