| Param | Original file | Final file |
|---|---|---|
| Filename | modeM0/AS1A11_037T01_9000005030cztM0_level2_bc.evt | modeM0/AS1A11_037T01_9000005030cztM0_level2_quad_clean.evt |
| Size (bytes) | 921,211,200 | 248,950,080 |
| Size | 878.5 MB | 237.4 MB |
| Events in quadrant A | 7,904,341 | 1,584,888 |
| Events in quadrant B | 4,582,553 | 1,754,359 |
| Events in quadrant C | 3,935,949 | 1,740,744 |
| Events in quadrant D | 10,623,580 | 1,596,276 |
| Mode M0 | |||
|---|---|---|---|
| Quadrant | BADHDUFLAG | Total packets | Discarded packets |
| A | 0 | 50598 | 0 |
| B | 0 | 33343 | 0 |
| C | 0 | 28742 | 0 |
| D | 0 | 51413 | 0 |
| Mode SS | |||
|---|---|---|---|
| Quadrant | BADHDUFLAG | Total packets | Discarded packets |
| A | 0 | 254 | 0 |
| B | 0 | 254 | 0 |
| C | 0 | 254 | 0 |
| D | 0 | 254 | 0 |
| Mode M9 | |||
|---|---|---|---|
| Quadrant | BADHDUFLAG | Total packets | Discarded packets |
| A | 0 | 39 | 0 |
| B | 0 | 40 | 0 |
| C | 0 | 40 | 0 |
| D | 0 | 40 | 0 |
| Quadrant | Total seconds | Saturated seconds | Saturation percentage |
|---|---|---|---|
| A | 12480 | 3076 | 24.647436% |
| B | 12480 | 582 | 4.663462% |
| C | 12480 | 153 | 1.225962% |
| D | 12480 | 831 | 6.658654% |
Noise dominated data is calculated using 1-second bins in cleaned event files. If a bin has >2000 counts, and if more than 50% of those come from <1% of pixels, then it is considered to be noise-dominated and hence unusable.
| Quadrant | # 1 sec bins | Bins with >0 counts | Bins with >2000 counts | High rate bins dominated by noise | Noise dominated (total time) | Noise dominated (detector-on time) | Marked lightcurve |
|---|---|---|---|---|---|---|---|
| A | 16158 | 12482 | 72 | 72 | 0.45% | 0.58% | 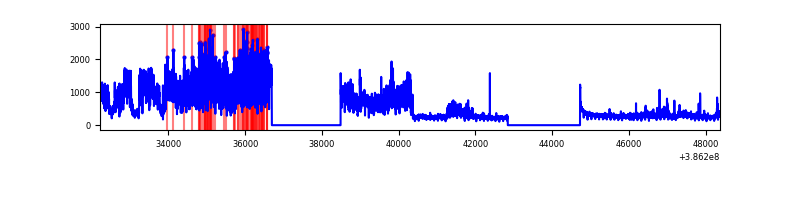 |
| B | 16157 | 12479 | 33 | 33 | 0.20% | 0.26% | 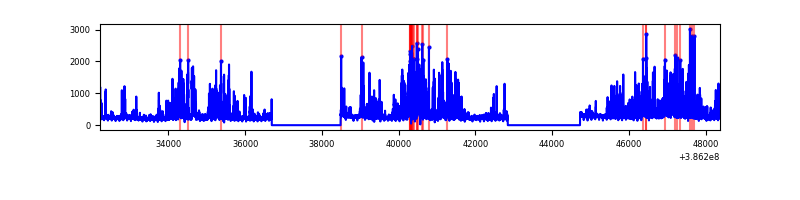 |
| C | 16157 | 12479 | 17 | 17 | 0.11% | 0.14% | 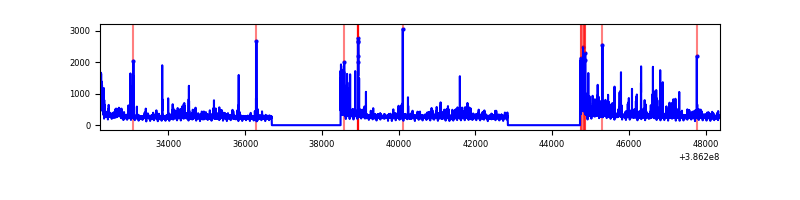 |
| D | 16157 | 12479 | 193 | 193 | 1.19% | 1.55% | 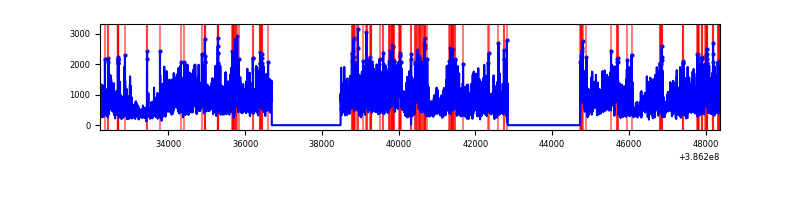 |
Top three noisy pixels from each quadrant. If the there are fewer than three noisy pixels in the level2.evt file, extra rows are filled as -1
| Pixel properties | Quadrant properties | ||||||
|---|---|---|---|---|---|---|---|
| Quadrant | DetID | PixID | Counts | Sigma | Mean | Median | Sigma |
| A | 15 | 169 | 5122017 | 36271.73 | 644 | 638 | 141.2 |
| A | 10 | 83 | 148423 | 1046.67 | 644 | 638 | 141.2 |
| A | 15 | 174 | 105430 | 742.18 | 644 | 638 | 141.2 |
| B | 5 | 172 | 943218 | 6821.47 | 700 | 691 | 138.2 |
| B | 5 | 236 | 624432 | 4514.28 | 700 | 691 | 138.2 |
| B | 4 | 232 | 100488 | 722.27 | 700 | 691 | 138.2 |
| C | 15 | 214 | 493404 | 3122.04 | 686 | 685 | 157.8 |
| C | 0 | 10 | 402456 | 2545.76 | 686 | 685 | 157.8 |
| C | 14 | 67 | 127029 | 800.56 | 686 | 685 | 157.8 |
| D | 8 | 195 | 5696123 | 34283.05 | 680 | 661 | 166.1 |
| D | 13 | 249 | 440036 | 2644.76 | 680 | 661 | 166.1 |
| D | 7 | 223 | 364789 | 2191.82 | 680 | 661 | 166.1 |
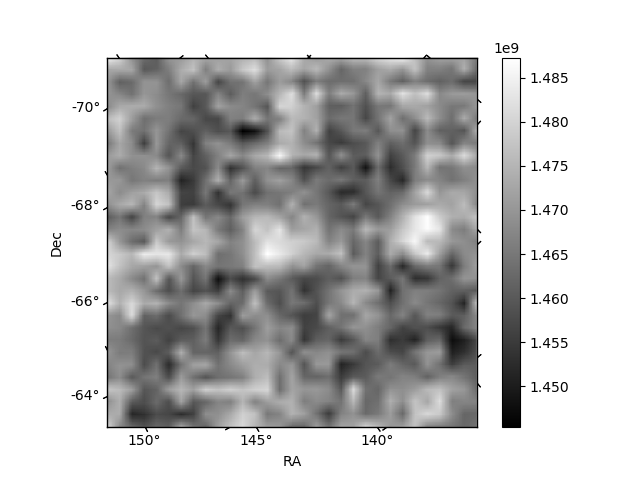
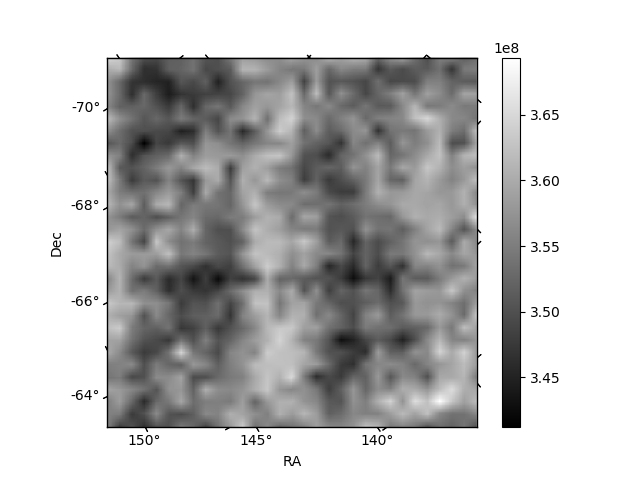
Histogram calculated using DETX and DETY for each event in the final _common_clean file
| Quadrant A | 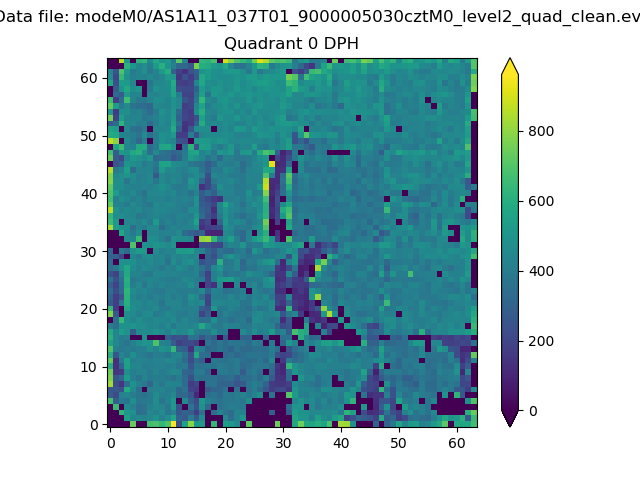 |
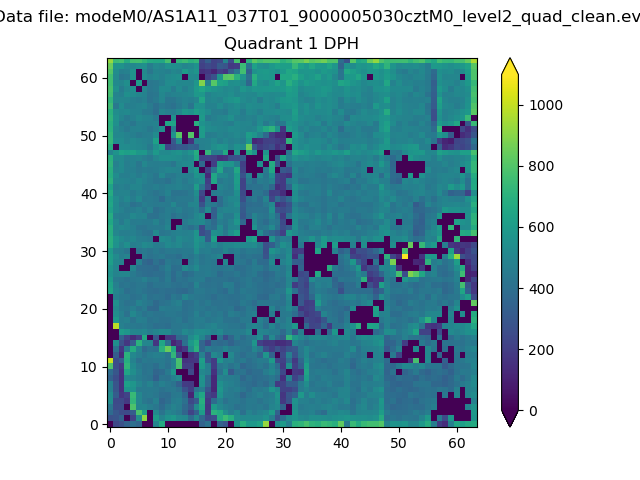 |
Quadrant B |
|---|---|---|---|
| Quadrant D | 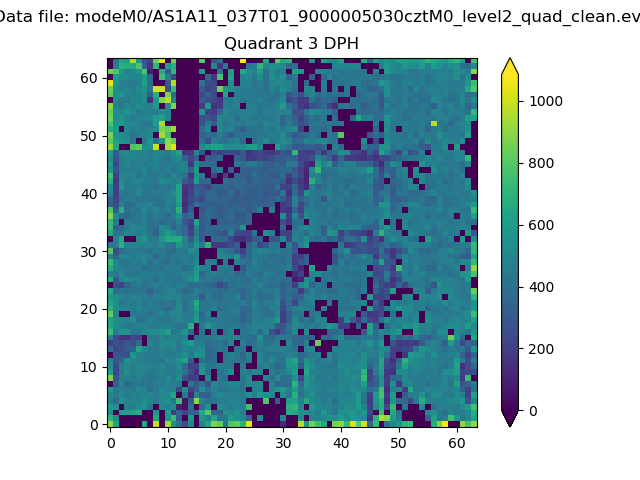 |
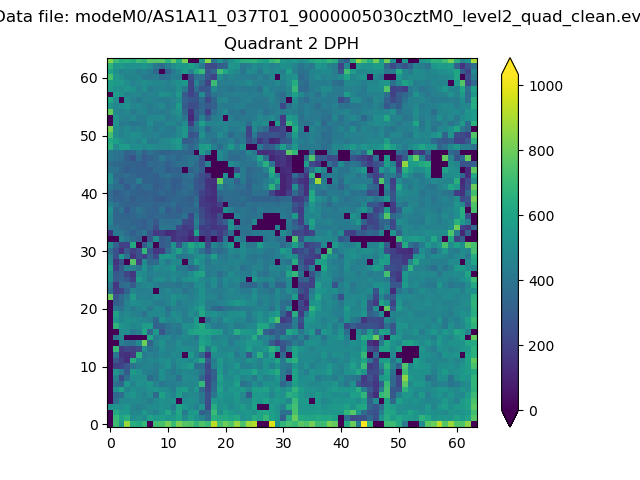 |
Quadrant C |
| Plot type | Count rate plots | Images |
|---|---|---|
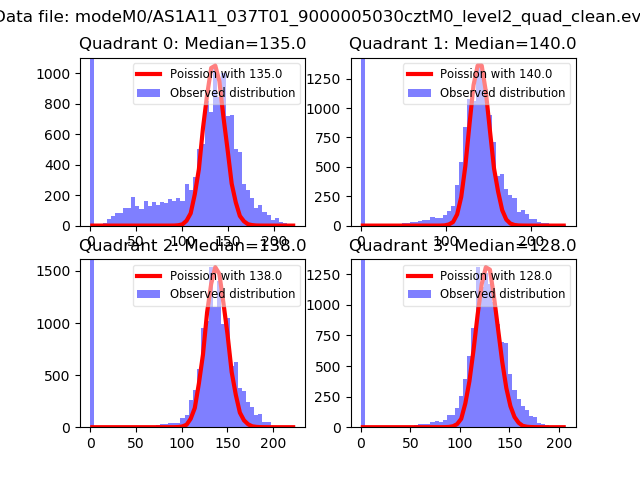
| Comparison with Poisson distribution Blue bars denote a histogram of data divided into 1 sec bins. Red curve is a Poisson curve with rate = median count rate of data. |
 |
 |
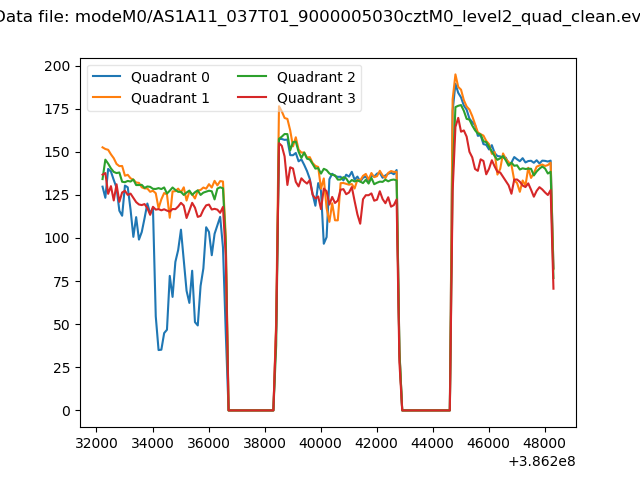
| Quadrant-wise count rates Data is divided into 100 sec bins |
 |
|
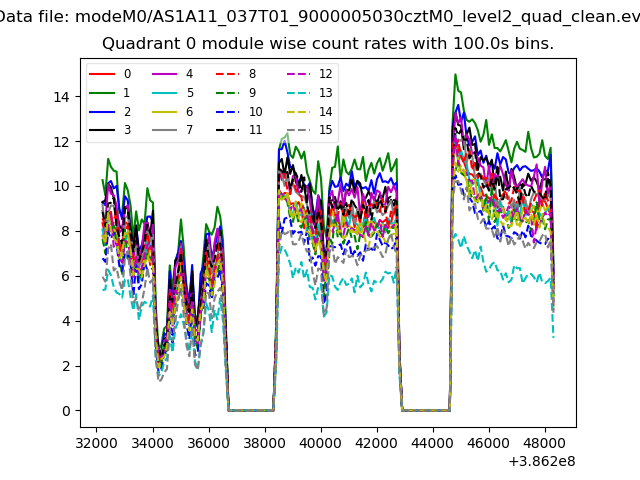
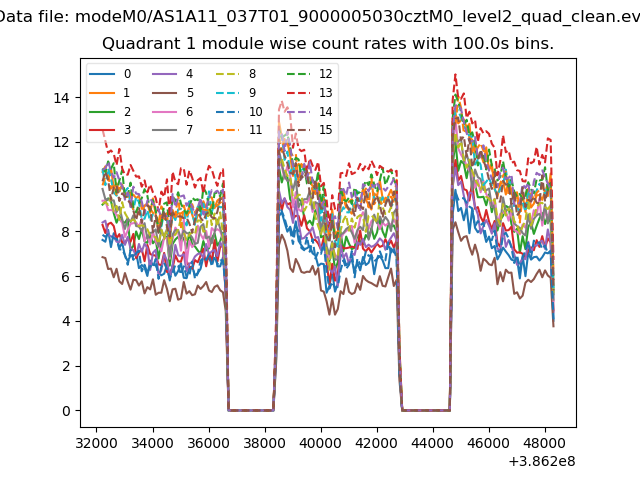
| Module-wise count rates for Quadrant A Data is divided into 100 sec bins |
 |
 |
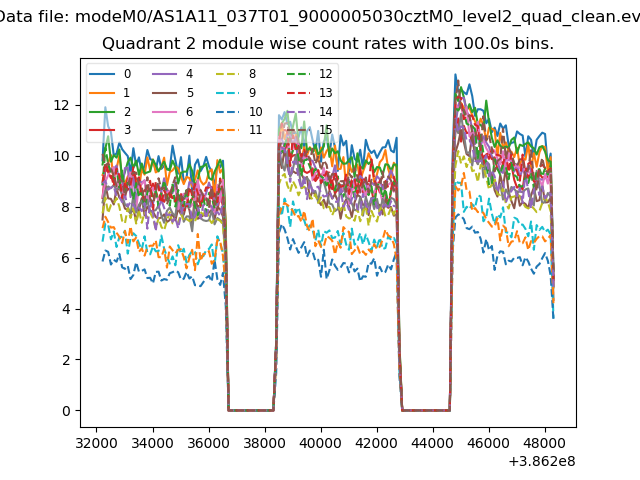
| Module-wise count rates for Quadrant B Data is divided into 100 sec bins |
 |
 |
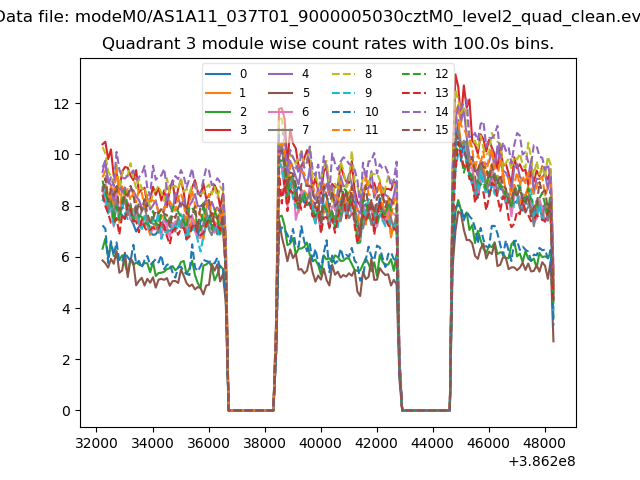
| Module-wise count rates for Quadrant C Data is divided into 100 sec bins |
 |
 |
| Module-wise count rates for Quadrant D Data is divided into 100 sec bins |
 |
 |
| Parameter | Plot |
|---|---|
| CZT HV Monitor |  |
| D_VDD | 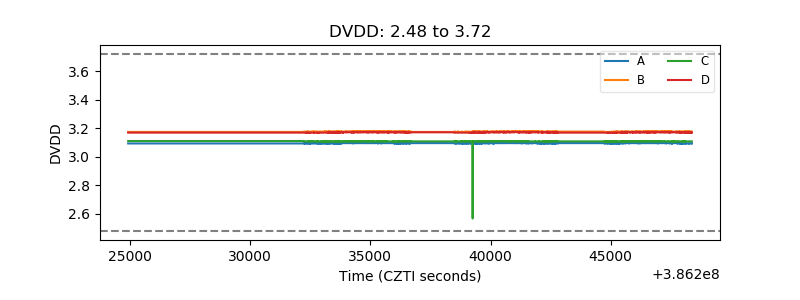 |
| Temperature 1 | 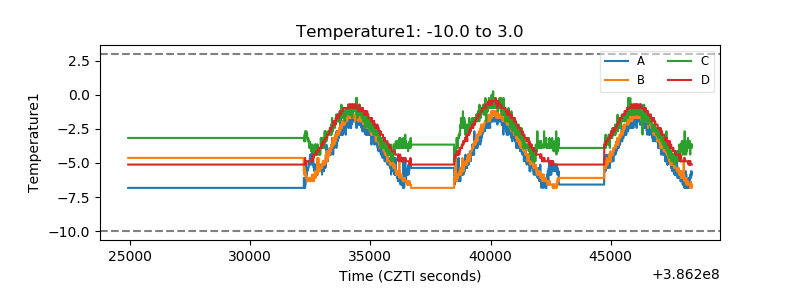 |
| Veto HV Monitor | 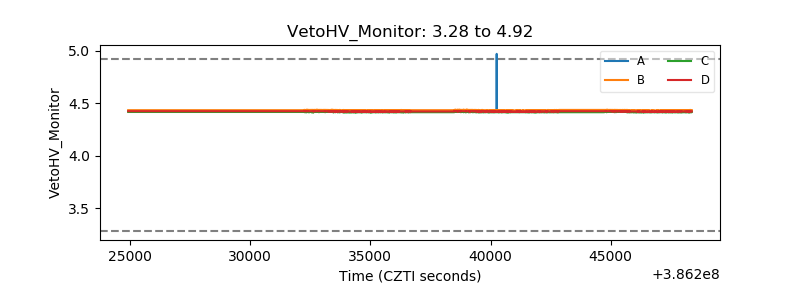 |
| Veto LLD | 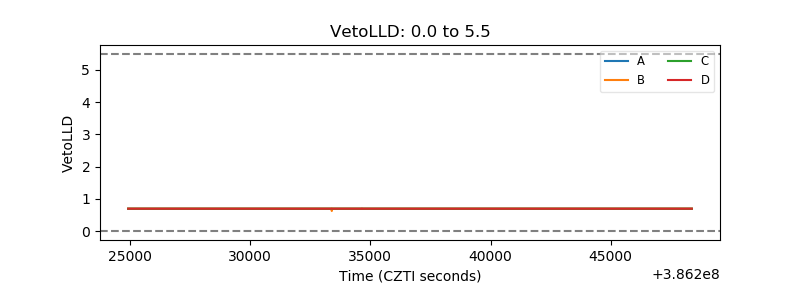 |
| Alpha Counter | 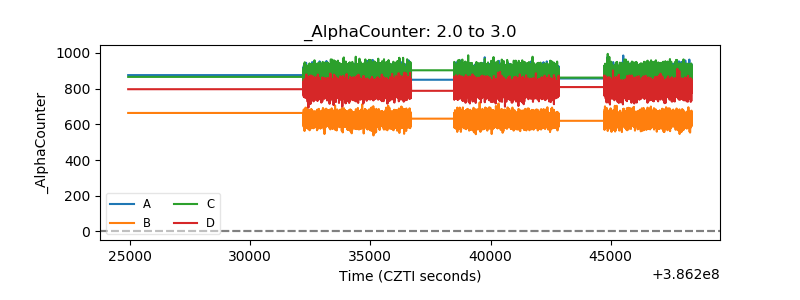 |
| _CPM_Rate | 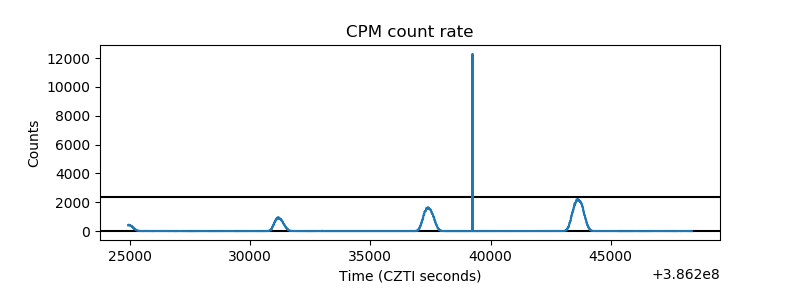 |
| CZT Counter | 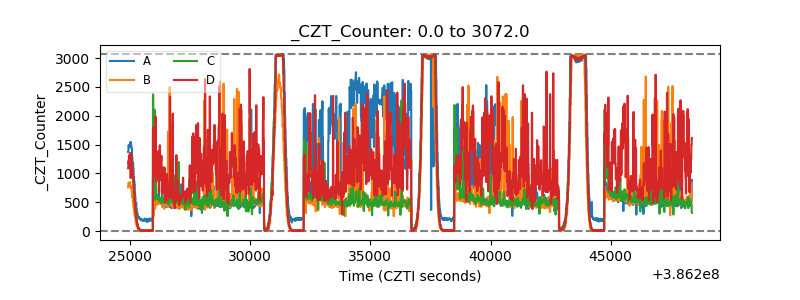 |
| +2.5 Volts monitor | 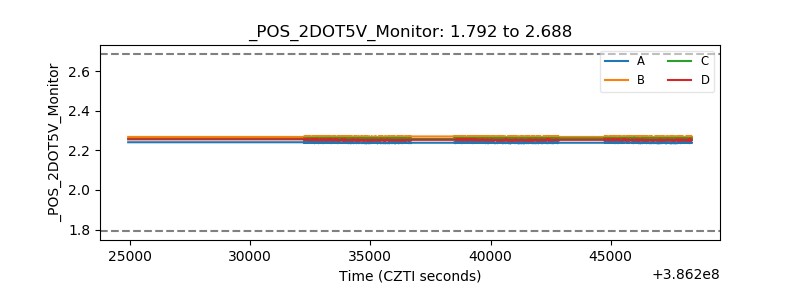 |
| +5 Volts monitor | 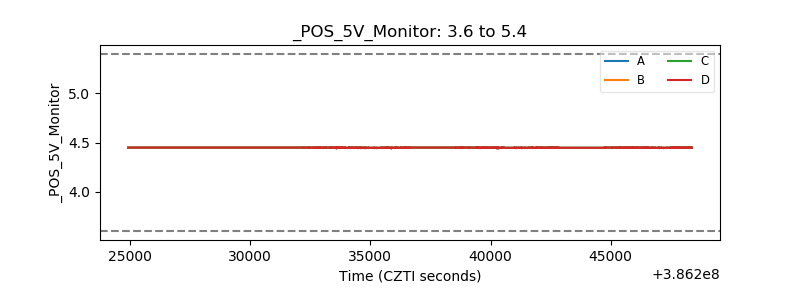 |
| _ROLL_ROT | 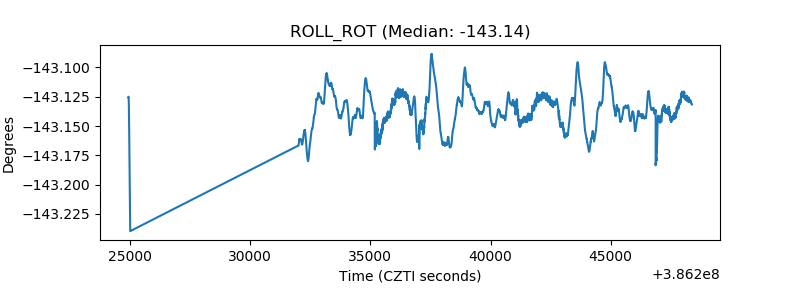 |
| _Roll_DEC | 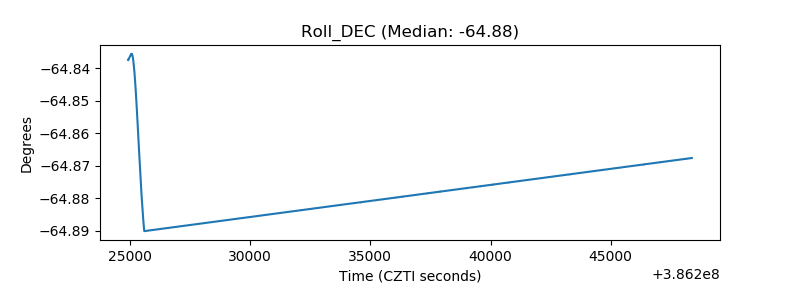 |
| _Roll_RA | 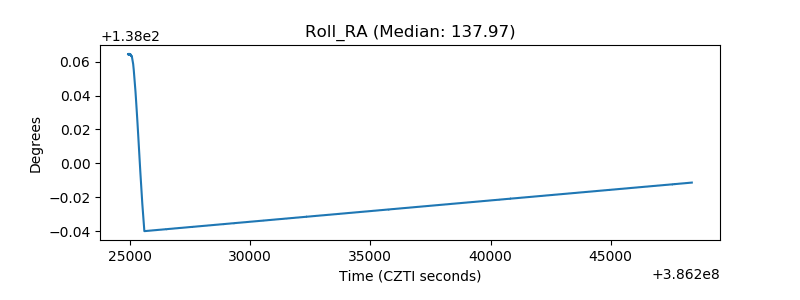 |
| Veto Counter | 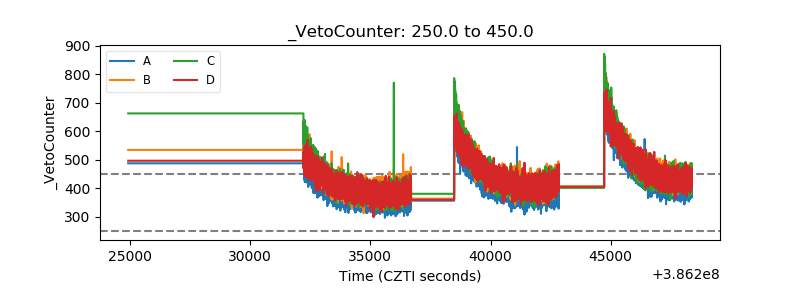 |