| Param | Original file | Final file |
|---|---|---|
| Filename | modeM0/AS1A11_047T09_9000005028_35143cztM0_level2.evt | modeM0/AS1A11_047T09_9000005028_35143cztM0_level2_quad_clean.evt |
| Size (bytes) | 1,236,312,000 | 143,663,040 |
| Size | 1.2 GB | 137.0 MB |
| Events in quadrant A | 6,897,110 | 887,854 |
| Events in quadrant B | 8,736,818 | 866,746 |
| Events in quadrant C | 7,296,680 | 880,910 |
| Events in quadrant D | 13,592,235 | 772,856 |
| Mode SS | |||
|---|---|---|---|
| Quadrant | BADHDUFLAG | Total packets | Discarded packets |
| A | 0 | 278 | 0 |
| B | 0 | 278 | 0 |
| C | 0 | 278 | 0 |
| D | 0 | 278 | 0 |
| Mode M9 | |||
|---|---|---|---|
| Quadrant | BADHDUFLAG | Total packets | Discarded packets |
| A | 0 | 27 | 0 |
| B | 0 | 27 | 0 |
| C | 0 | 27 | 0 |
| D | 0 | 27 | 0 |
| Mode M0 | |||
|---|---|---|---|
| Quadrant | BADHDUFLAG | Total packets | Discarded packets |
| A | 0 | 28904 | 2 |
| B | 0 | 34771 | 2 |
| C | 0 | 29570 | 2 |
| D | 0 | 49743 | 2 |
| Quadrant | Total seconds | Saturated seconds | Saturation percentage |
|---|---|---|---|
| A | 13627 | 57 | 0.418287% |
| B | 13627 | 698 | 5.122184% |
| C | 13627 | 83 | 0.609085% |
| D | 13627 | 1376 | 10.097600% |
Noise dominated data is calculated using 1-second bins in cleaned event files. If a bin has >2000 counts, and if more than 50% of those come from <1% of pixels, then it is considered to be noise-dominated and hence unusable.
| Quadrant | # 1 sec bins | Bins with >0 counts | Bins with >2000 counts | High rate bins dominated by noise | Noise dominated (total time) | Noise dominated (detector-on time) | Marked lightcurve |
|---|---|---|---|---|---|---|---|
| A | 16374 | 13629 | 28 | 28 | 0.17% | 0.21% | 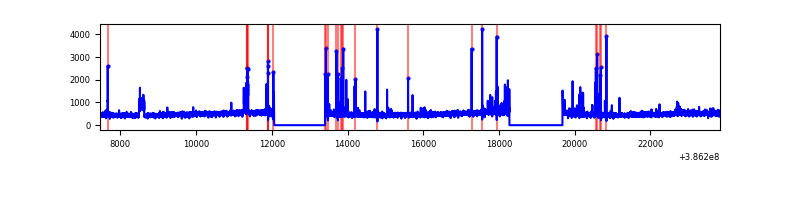 |
| B | 16374 | 13629 | 430 | 430 | 2.63% | 3.16% | 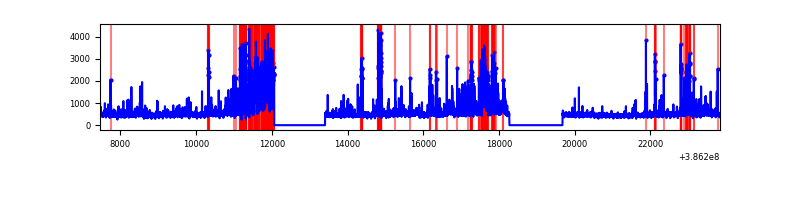 |
| C | 16374 | 13629 | 59 | 59 | 0.36% | 0.43% | 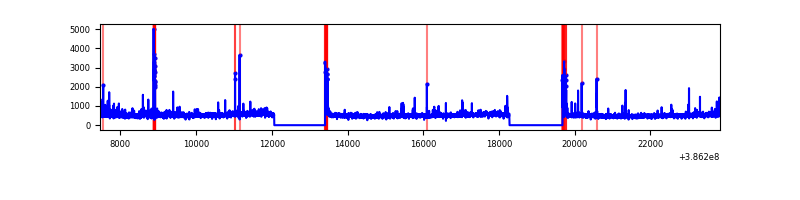 |
| D | 16374 | 13629 | 1135 | 1135 | 6.93% | 8.33% | 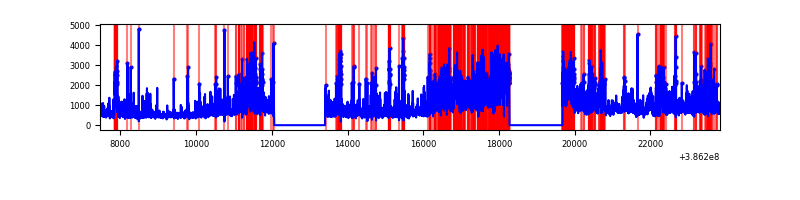 |
Top three noisy pixels from each quadrant. If the there are fewer than three noisy pixels in the level2.evt file, extra rows are filled as -1
| Pixel properties | Quadrant properties | ||||||
|---|---|---|---|---|---|---|---|
| Quadrant | DetID | PixID | Counts | Sigma | Mean | Median | Sigma |
| A | 15 | 169 | 543978 | 1688.78 | 1599 | 1565 | 321.2 |
| A | 10 | 83 | 141795 | 436.6 | 1599 | 1565 | 321.2 |
| A | 13 | 6 | 35384 | 105.29 | 1599 | 1565 | 321.2 |
| B | 5 | 172 | 1553555 | 5153.36 | 1557 | 1517 | 301.2 |
| B | 5 | 236 | 739809 | 2451.41 | 1557 | 1517 | 301.2 |
| B | 10 | 245 | 92406 | 301.79 | 1557 | 1517 | 301.2 |
| C | 15 | 214 | 561523 | 1561.57 | 1548 | 1559 | 358.6 |
| C | 0 | 10 | 301052 | 835.2 | 1548 | 1559 | 358.6 |
| C | 14 | 67 | 208017 | 575.75 | 1548 | 1559 | 358.6 |
| D | 8 | 195 | 2974232 | 8117.32 | 1495 | 1454 | 366.2 |
| D | 5 | 223 | 1635167 | 4460.94 | 1495 | 1454 | 366.2 |
| D | 7 | 80 | 831717 | 2267.08 | 1495 | 1454 | 366.2 |
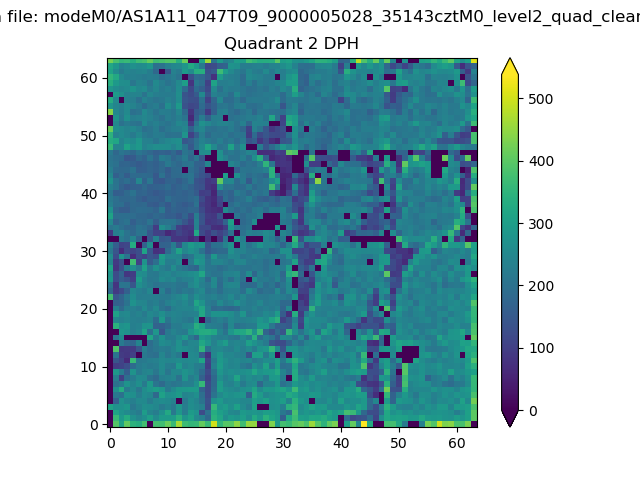
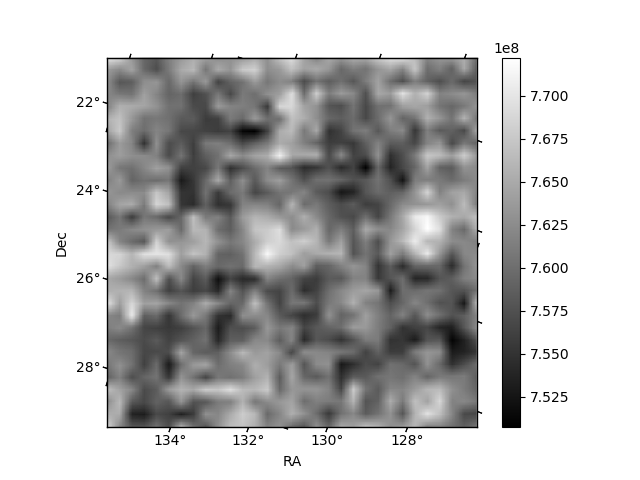
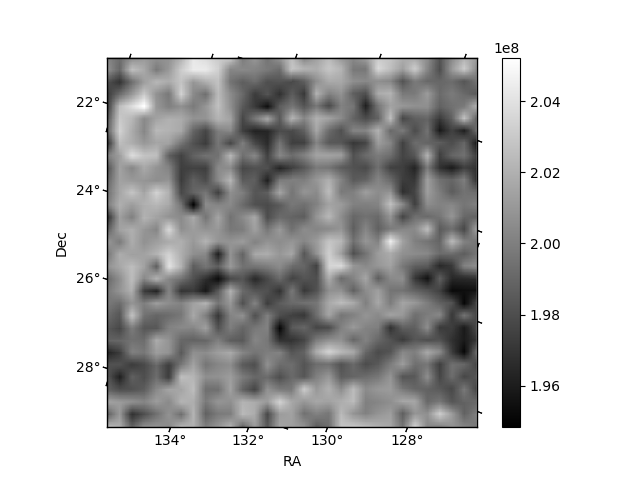
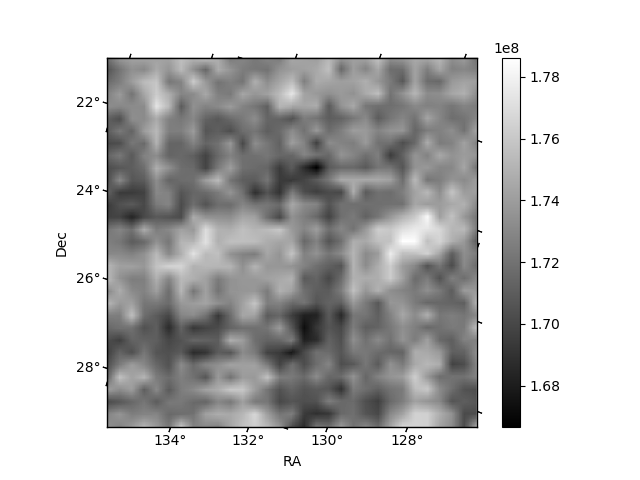
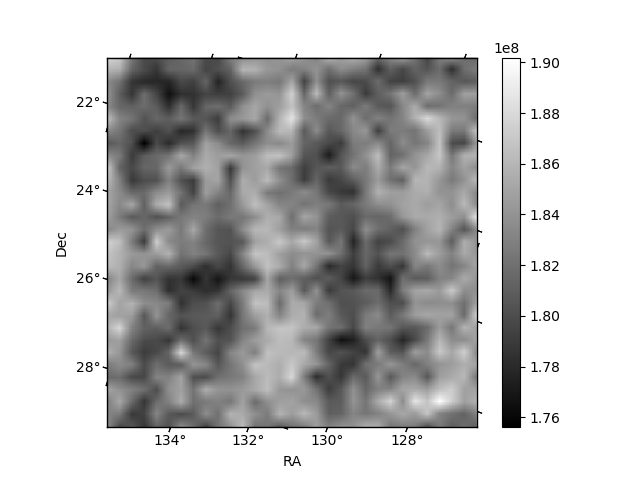
Histogram calculated using DETX and DETY for each event in the final _common_clean file
| Quadrant A | 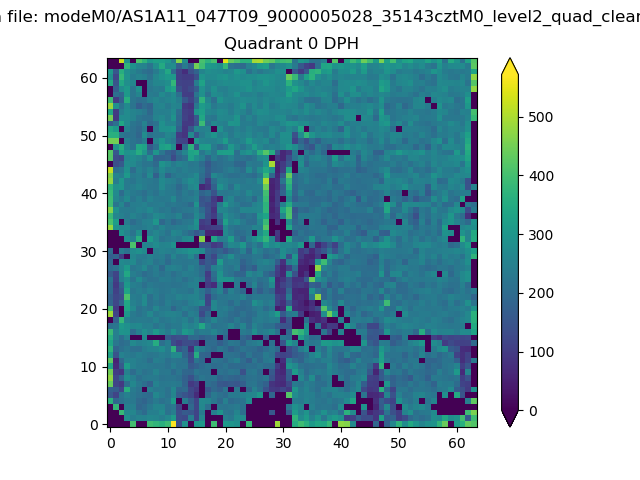 |
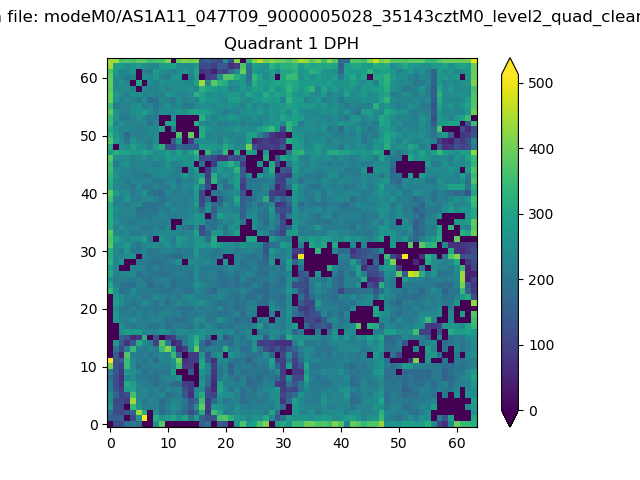 |
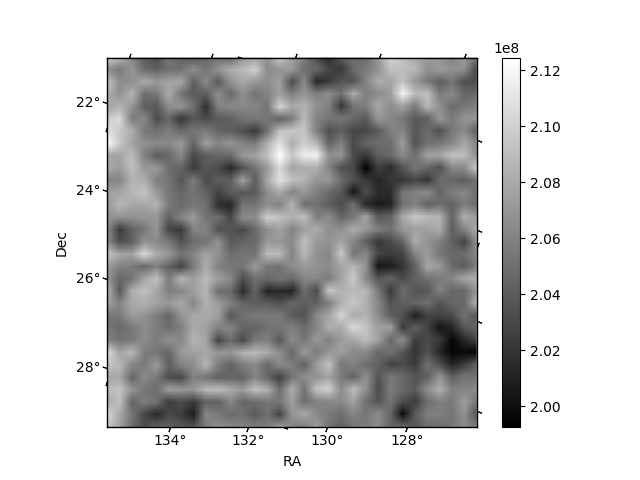
Quadrant B |
|---|---|---|---|
| Quadrant D | 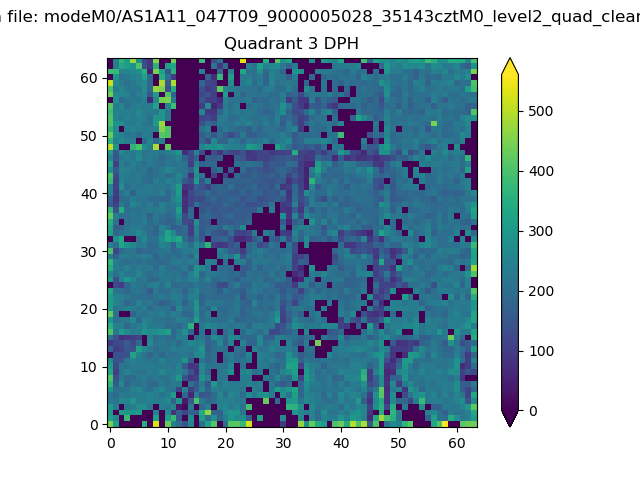 |
 |
Quadrant C |
| Plot type | Count rate plots | Images |
|---|---|---|
| Comparison with Poisson distribution Blue bars denote a histogram of data divided into 1 sec bins. Red curve is a Poisson curve with rate = median count rate of data. |
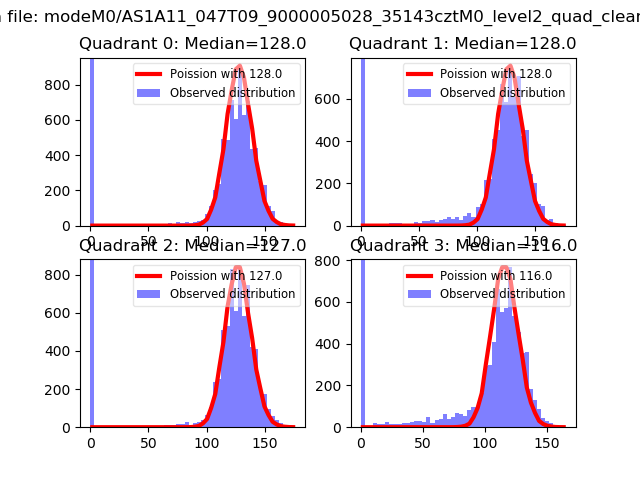 |
 |
| Quadrant-wise count rates Data is divided into 100 sec bins |
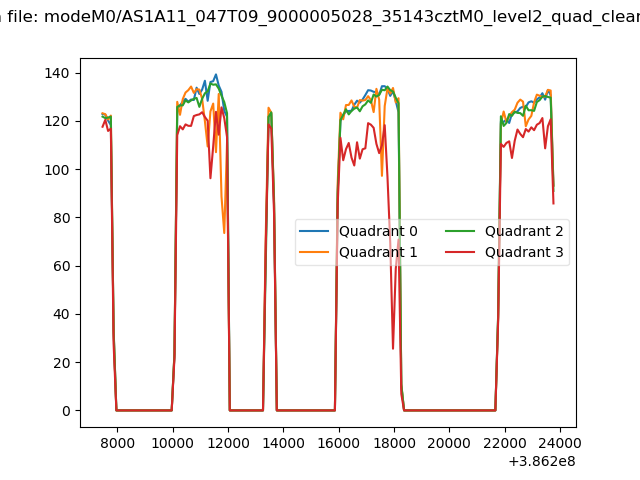 |
|
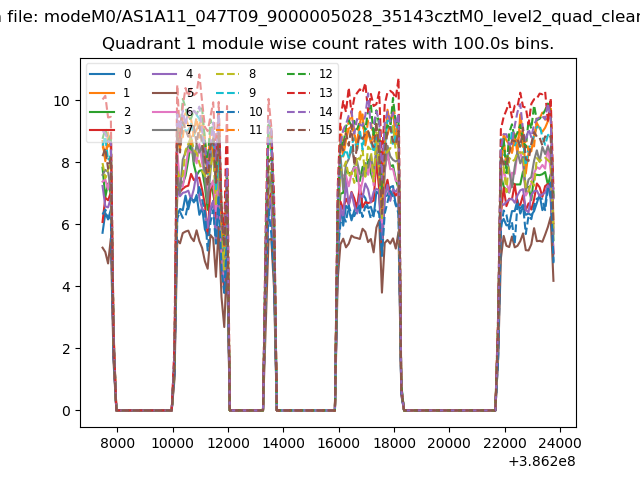
| Module-wise count rates for Quadrant A Data is divided into 100 sec bins |
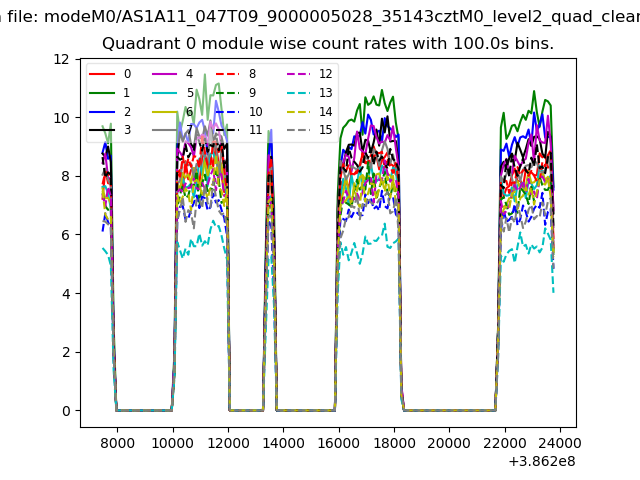 |
 |
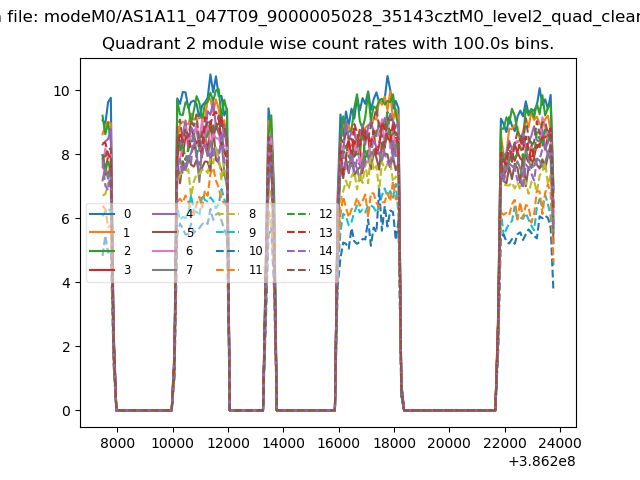
| Module-wise count rates for Quadrant B Data is divided into 100 sec bins |
 |
 |
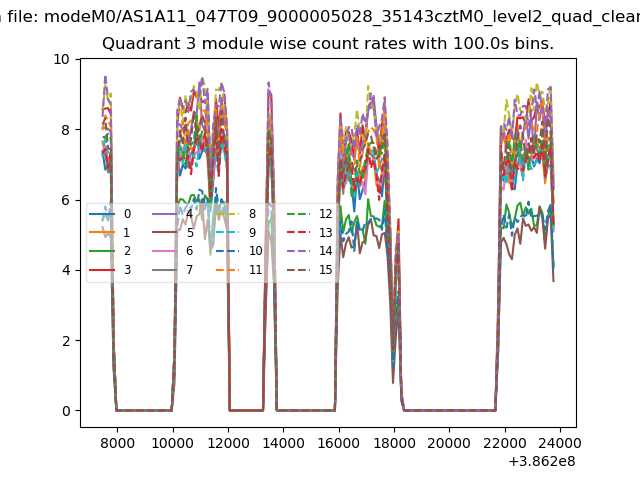
| Module-wise count rates for Quadrant C Data is divided into 100 sec bins |
 |
 |
| Module-wise count rates for Quadrant D Data is divided into 100 sec bins |
 |
 |
| Parameter | Plot |
|---|---|
| CZT HV Monitor | 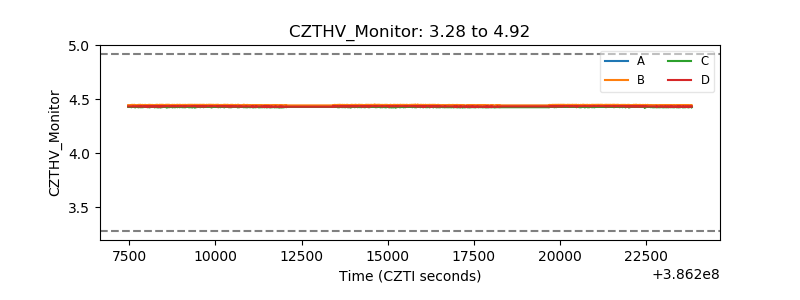 |
| D_VDD | 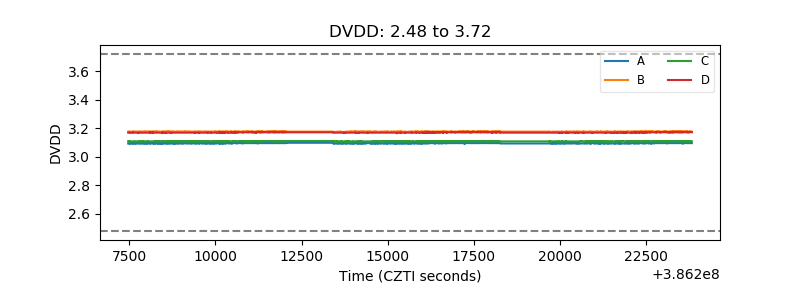 |
| Temperature 1 | 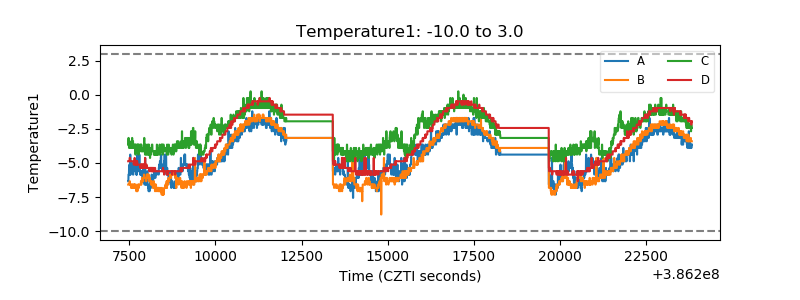 |
| Veto HV Monitor | 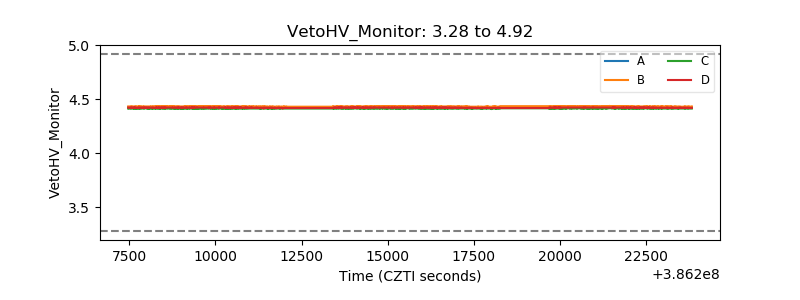 |
| Veto LLD | 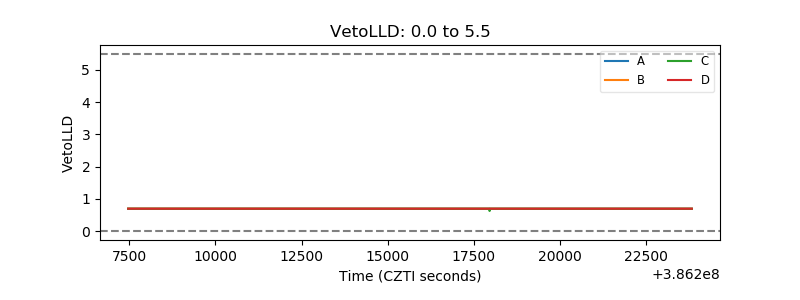 |
| Alpha Counter | 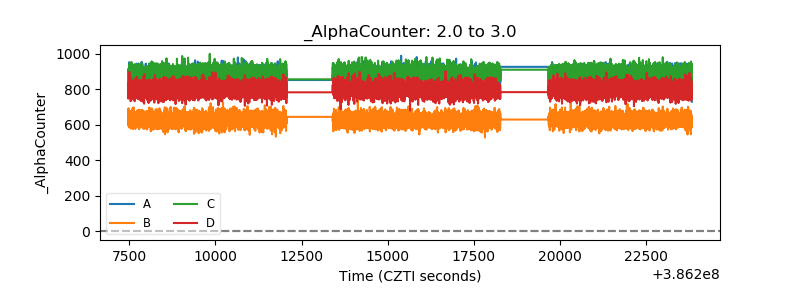 |
| _CPM_Rate | 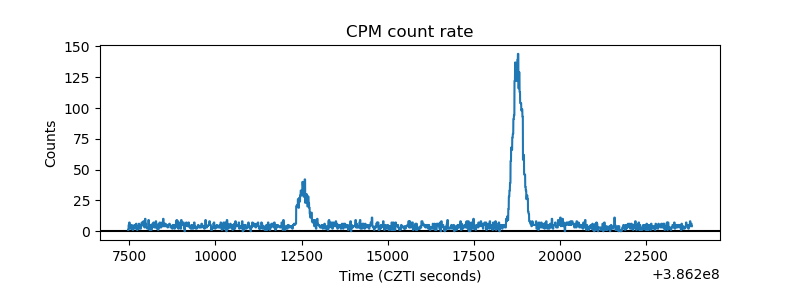 |
| CZT Counter | 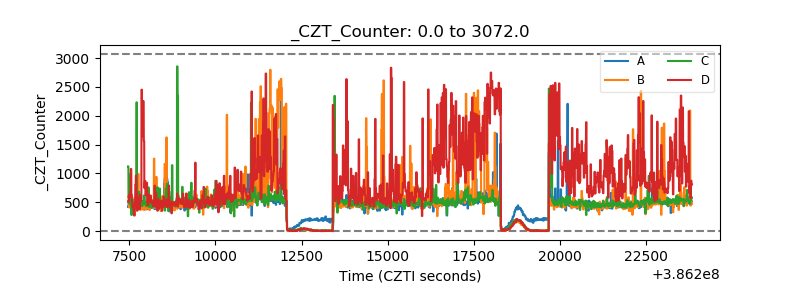 |
| +2.5 Volts monitor | 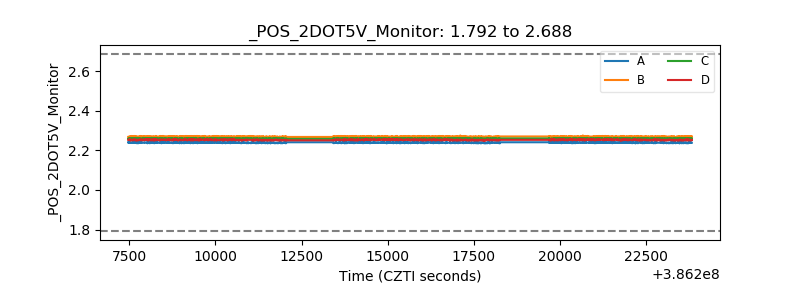 |
| +5 Volts monitor | 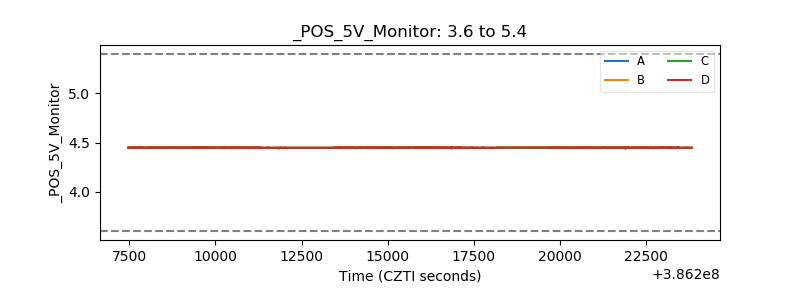 |
| _ROLL_ROT | 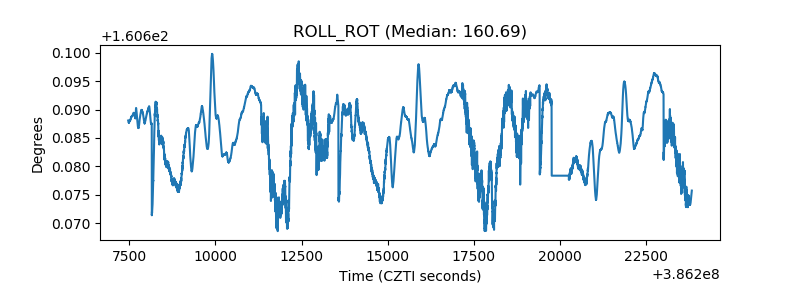 |
| _Roll_DEC | 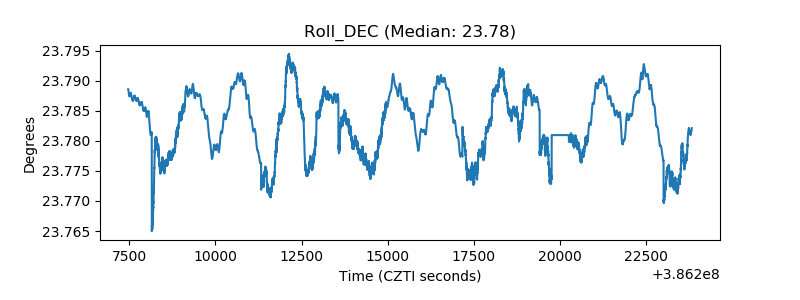 |
| _Roll_RA | 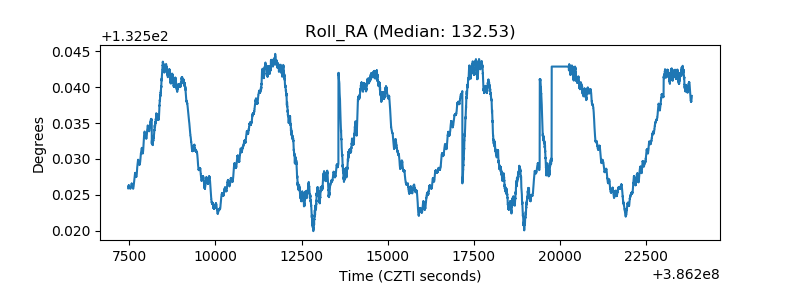 |
| Veto Counter | 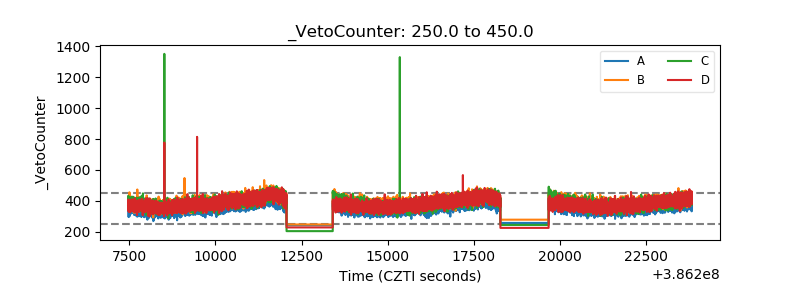 |