| Param | Original file | Final file |
|---|---|---|
| Filename | modeM0/AS1A11_047T09_9000005028_35141cztM0_level2.evt | modeM0/AS1A11_047T09_9000005028_35141cztM0_level2_quad_clean.evt |
| Size (bytes) | 194,172,480 | 13,449,600 |
| Size | 185.2 MB | 12.8 MB |
| Events in quadrant A | 1,278,578 | 53,563 |
| Events in quadrant B | 1,346,885 | 54,034 |
| Events in quadrant C | 1,481,099 | 53,728 |
| Events in quadrant D | 1,588,525 | 51,913 |
| Mode SS | |||
|---|---|---|---|
| Quadrant | BADHDUFLAG | Total packets | Discarded packets |
| A | 0 | 54 | 0 |
| B | 0 | 54 | 0 |
| C | 0 | 54 | 0 |
| D | 0 | 54 | 0 |
| Mode M0 | |||
|---|---|---|---|
| Quadrant | BADHDUFLAG | Total packets | Discarded packets |
| A | 0 | 5632 | 1 |
| B | 0 | 5775 | 0 |
| C | 0 | 6014 | 0 |
| D | 0 | 6386 | 0 |
| Quadrant | Total seconds | Saturated seconds | Saturation percentage |
|---|---|---|---|
| A | 2697 | 0 | 0.000000% |
| B | 2697 | 6 | 0.222469% |
| C | 2697 | 27 | 1.001112% |
| D | 2697 | 28 | 1.038191% |
Noise dominated data is calculated using 1-second bins in cleaned event files. If a bin has >2000 counts, and if more than 50% of those come from <1% of pixels, then it is considered to be noise-dominated and hence unusable.
| Quadrant | # 1 sec bins | Bins with >0 counts | Bins with >2000 counts | High rate bins dominated by noise | Noise dominated (total time) | Noise dominated (detector-on time) | Marked lightcurve |
|---|---|---|---|---|---|---|---|
| A | 2697 | 2697 | 1 | 1 | 0.04% | 0.04% | 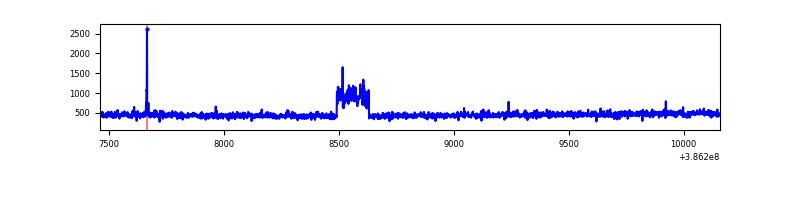 |
| B | 2697 | 2697 | 1 | 1 | 0.04% | 0.04% | 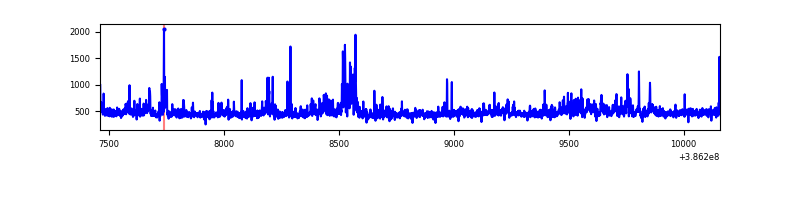 |
| C | 2697 | 2697 | 26 | 26 | 0.96% | 0.96% | 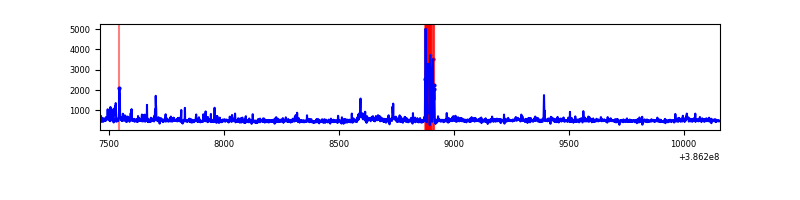 |
| D | 2697 | 2697 | 39 | 39 | 1.45% | 1.45% |  |
Top three noisy pixels from each quadrant. If the there are fewer than three noisy pixels in the level2.evt file, extra rows are filled as -1
| Pixel properties | Quadrant properties | ||||||
|---|---|---|---|---|---|---|---|
| Quadrant | DetID | PixID | Counts | Sigma | Mean | Median | Sigma |
| A | 15 | 169 | 104181 | 1685.7 | 297 | 292 | 61.6 |
| A | 10 | 83 | 17059 | 272.06 | 297 | 292 | 61.6 |
| A | 13 | 6 | 7941 | 124.11 | 297 | 292 | 61.6 |
| B | 0 | 189 | 77294 | 1278.22 | 296 | 286 | 60.2 |
| B | 5 | 172 | 74933 | 1239.03 | 296 | 286 | 60.2 |
| B | 3 | 112 | 18217 | 297.63 | 296 | 286 | 60.2 |
| C | 15 | 214 | 107965 | 1541.9 | 289 | 292 | 69.8 |
| C | 9 | 187 | 89255 | 1273.97 | 289 | 292 | 69.8 |
| C | 14 | 67 | 77713 | 1108.69 | 289 | 292 | 69.8 |
| D | 8 | 195 | 228315 | 3160.91 | 286 | 277 | 72.1 |
| D | 2 | 153 | 120069 | 1660.48 | 286 | 277 | 72.1 |
| D | 2 | 250 | 61972 | 855.17 | 286 | 277 | 72.1 |
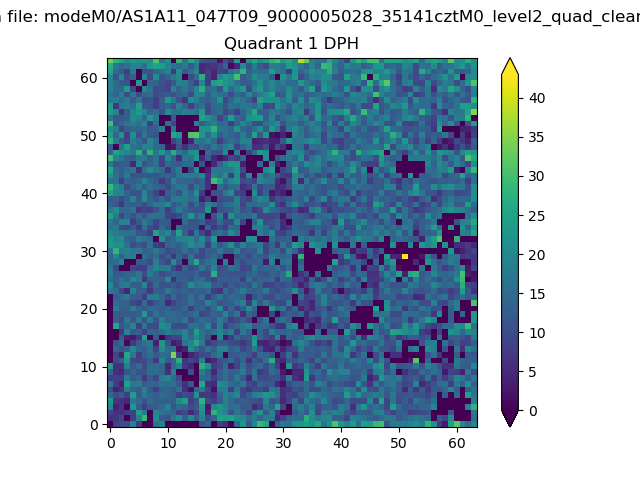
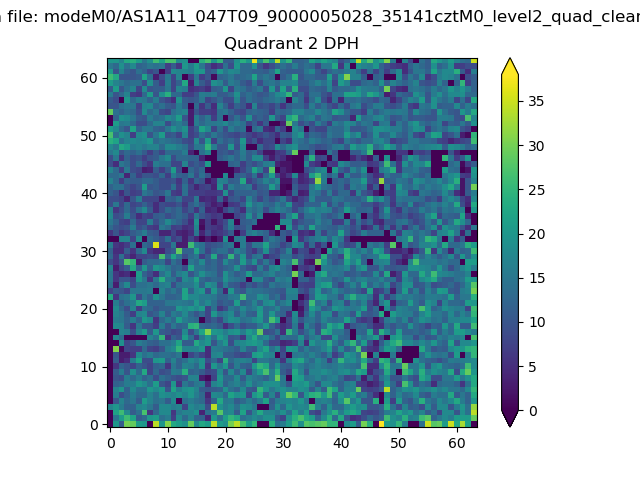
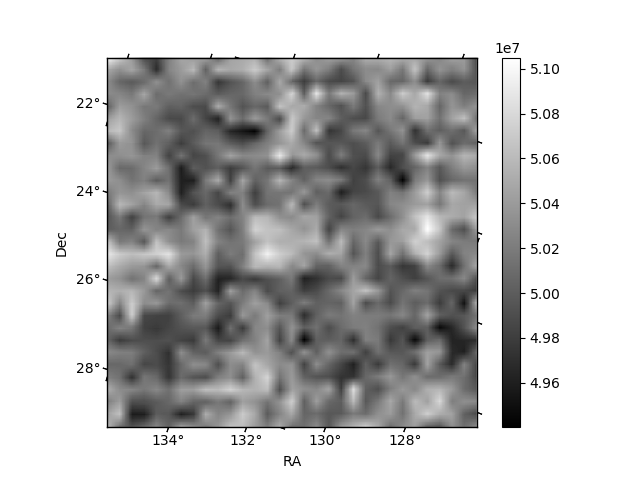
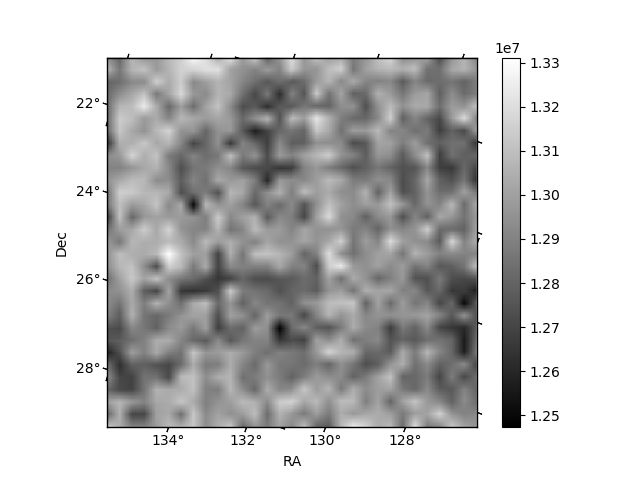
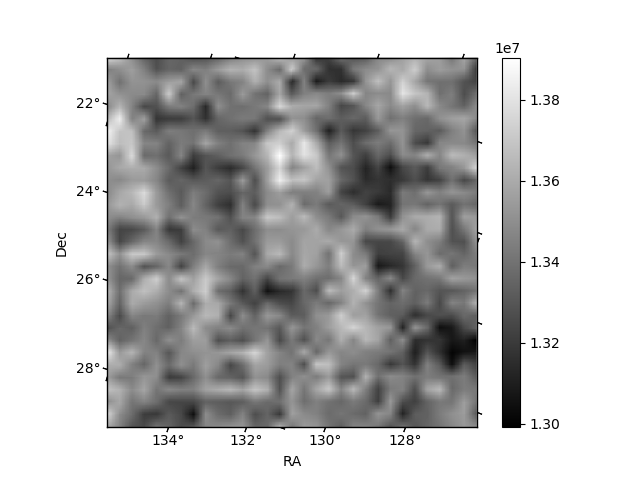
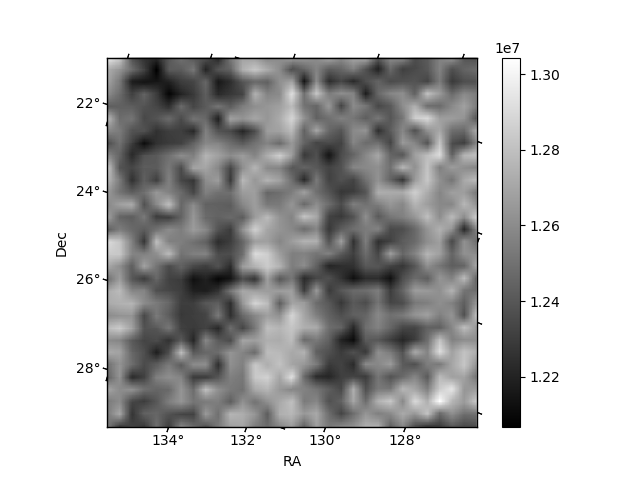
Histogram calculated using DETX and DETY for each event in the final _common_clean file
| Quadrant A | 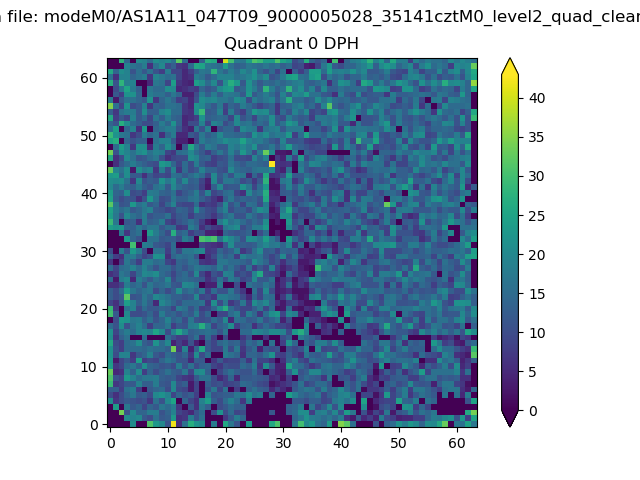 |
 |
Quadrant B |
|---|---|---|---|
| Quadrant D | 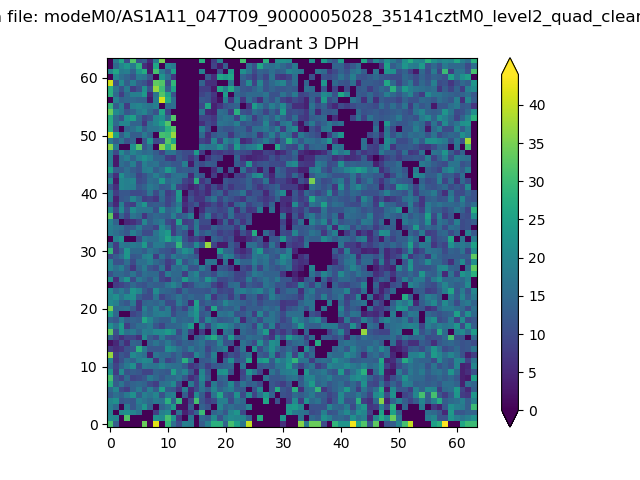 |
 |
Quadrant C |
| Plot type | Count rate plots | Images |
|---|---|---|
| Comparison with Poisson distribution Blue bars denote a histogram of data divided into 1 sec bins. Red curve is a Poisson curve with rate = median count rate of data. |
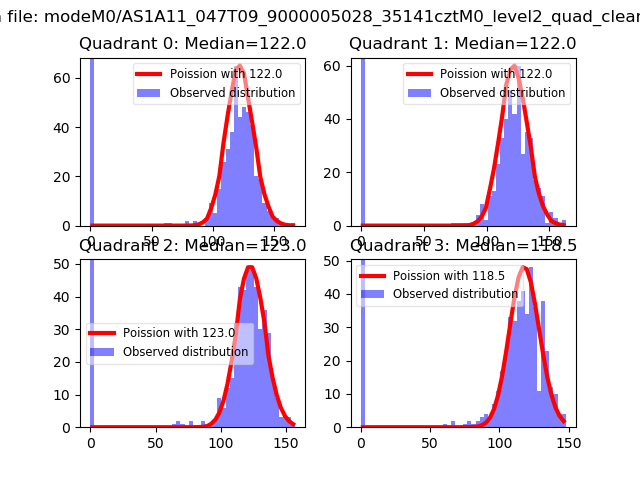 |
 |
| Quadrant-wise count rates Data is divided into 100 sec bins |
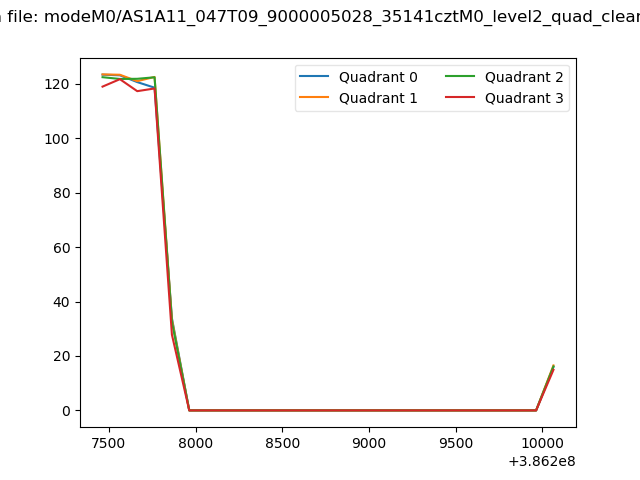 |
|
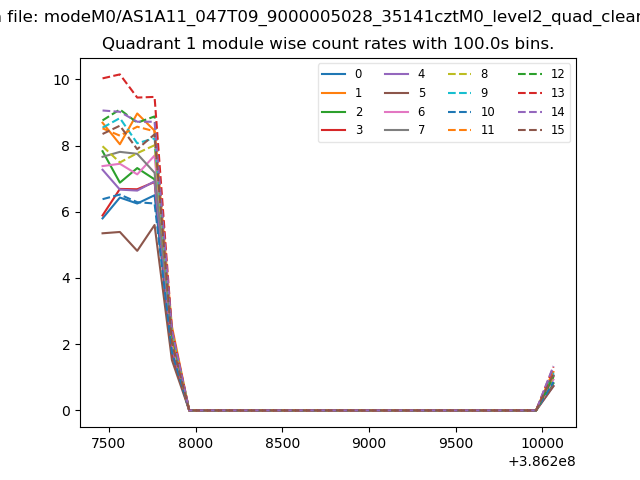
| Module-wise count rates for Quadrant A Data is divided into 100 sec bins |
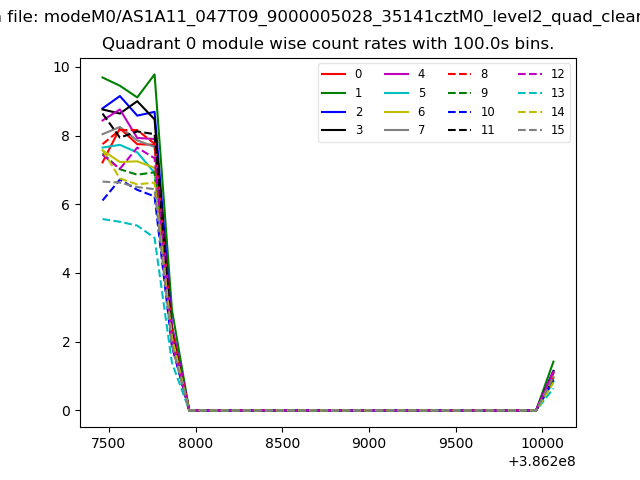 |
 |
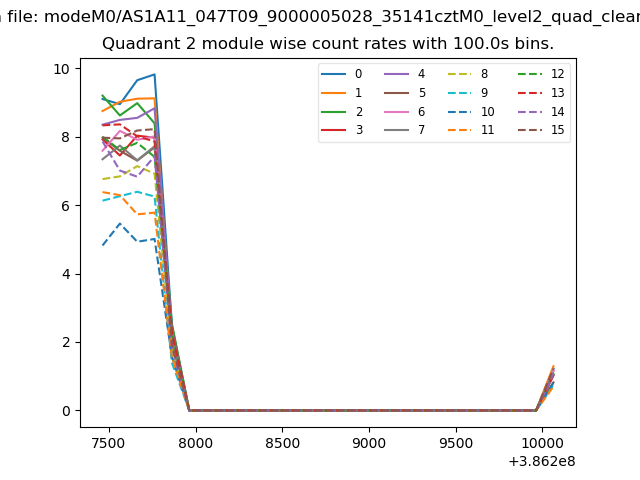
| Module-wise count rates for Quadrant B Data is divided into 100 sec bins |
 |
 |
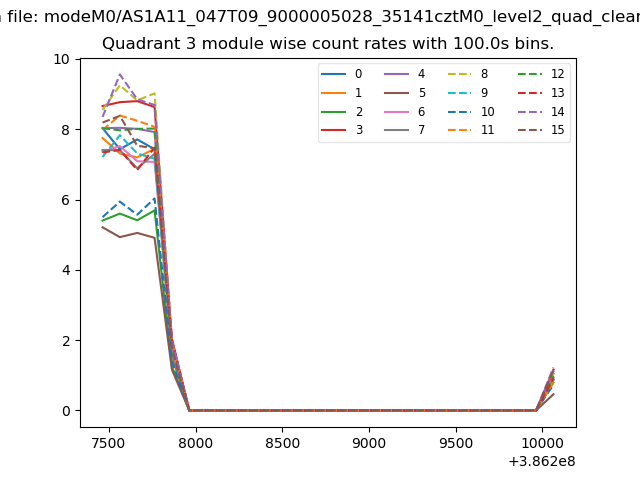
| Module-wise count rates for Quadrant C Data is divided into 100 sec bins |
 |
 |
| Module-wise count rates for Quadrant D Data is divided into 100 sec bins |
 |
 |
| Parameter | Plot |
|---|---|
| CZT HV Monitor |  |
| D_VDD | 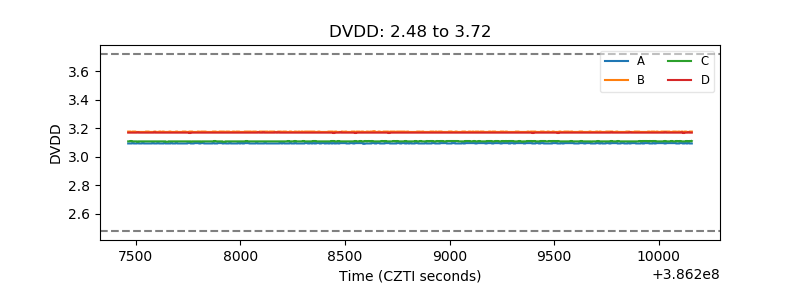 |
| Temperature 1 | 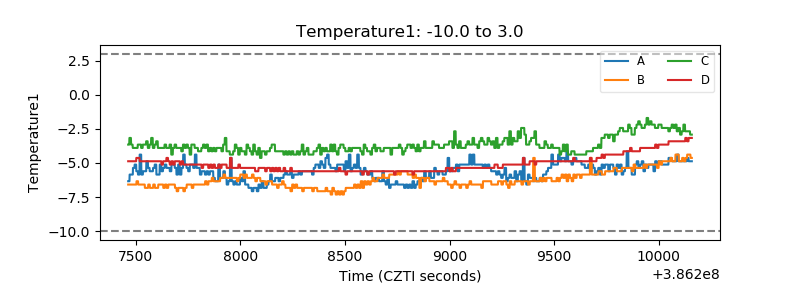 |
| Veto HV Monitor | 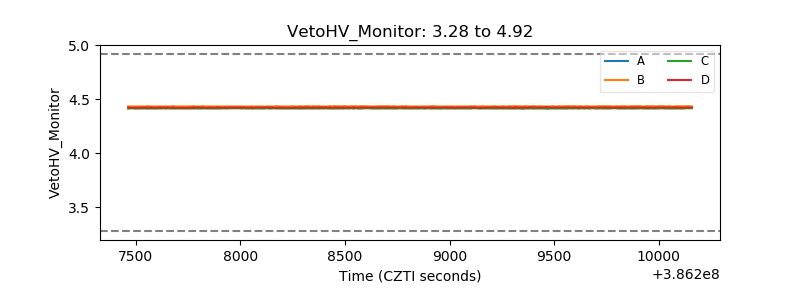 |
| Veto LLD | 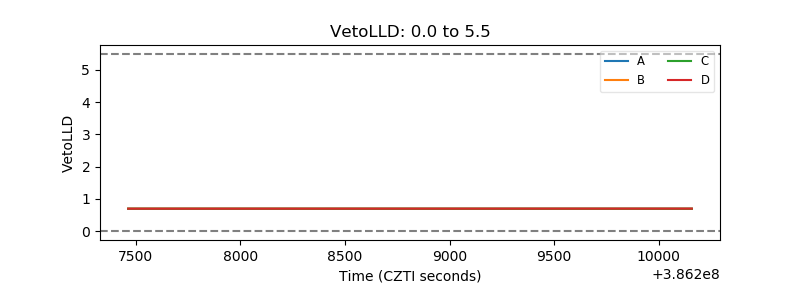 |
| Alpha Counter | 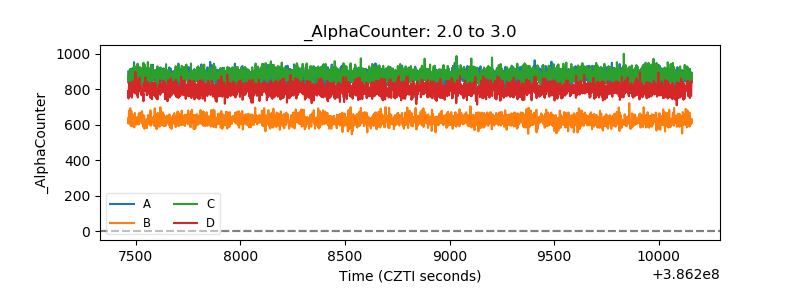 |
| _CPM_Rate | 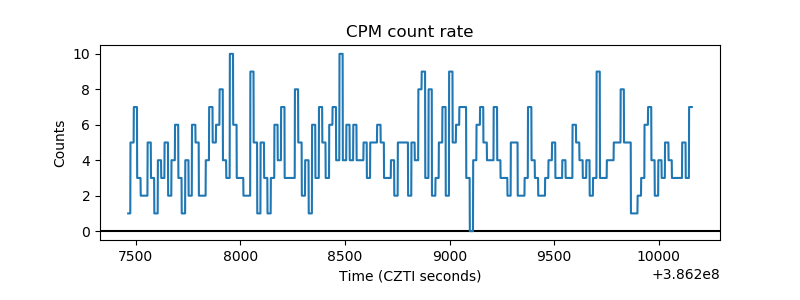 |
| CZT Counter | 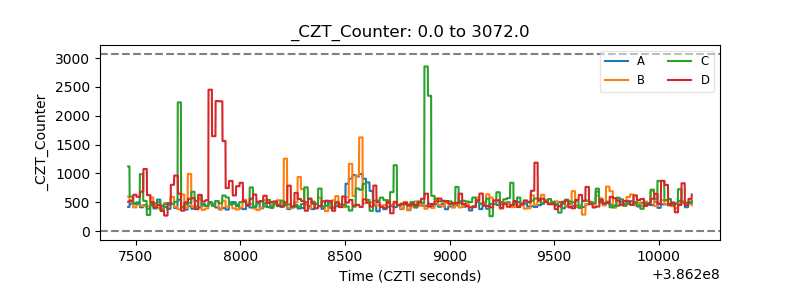 |
| +2.5 Volts monitor | 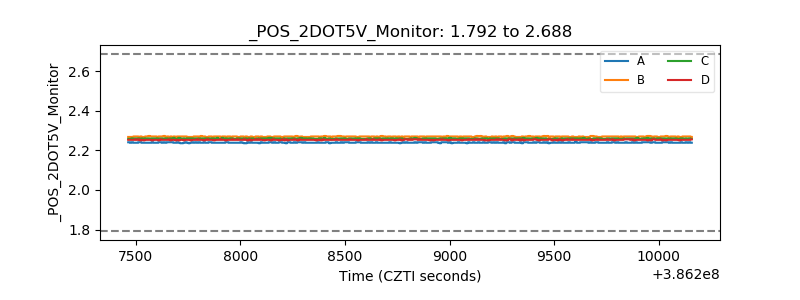 |
| +5 Volts monitor | 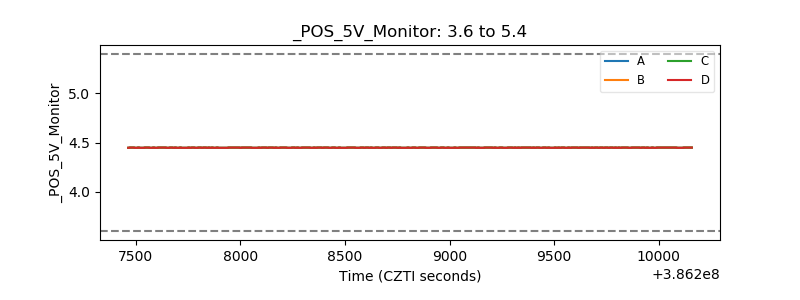 |
| _ROLL_ROT | 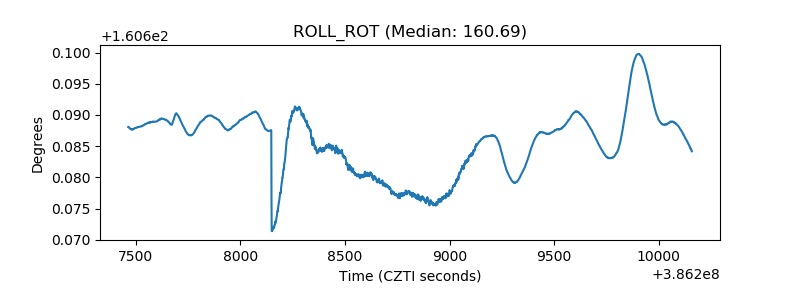 |
| _Roll_DEC | 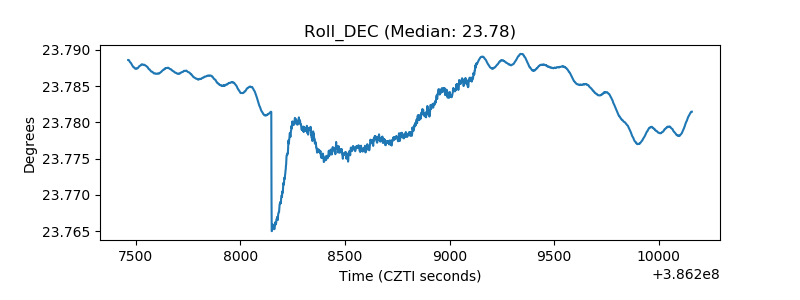 |
| _Roll_RA | 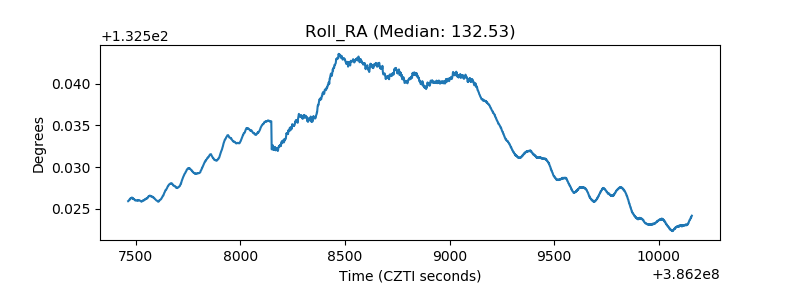 |
| Veto Counter | 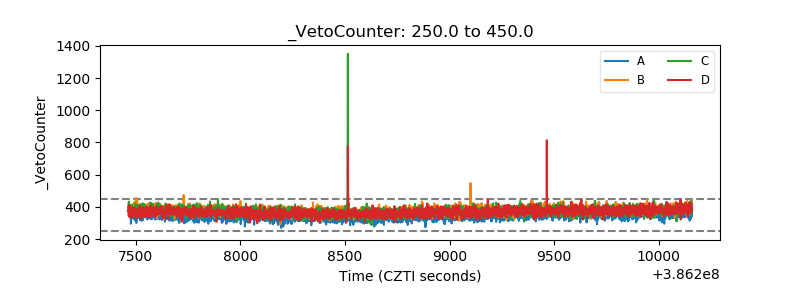 |