| Param | Original file | Final file |
|---|---|---|
| Filename | modeM0/AS1A11_047T09_9000005028_35140cztM0_level2.evt | modeM0/AS1A11_047T09_9000005028_35140cztM0_level2_quad_clean.evt |
| Size (bytes) | 1,313,164,800 | 156,746,880 |
| Size | 1.2 GB | 149.5 MB |
| Events in quadrant A | 7,285,476 | 979,601 |
| Events in quadrant B | 9,163,999 | 958,063 |
| Events in quadrant C | 7,862,679 | 968,755 |
| Events in quadrant D | 14,491,021 | 849,972 |
| Mode SS | |||
|---|---|---|---|
| Quadrant | BADHDUFLAG | Total packets | Discarded packets |
| A | 0 | 292 | 0 |
| B | 0 | 292 | 0 |
| C | 0 | 292 | 0 |
| D | 0 | 292 | 0 |
| Mode M9 | |||
|---|---|---|---|
| Quadrant | BADHDUFLAG | Total packets | Discarded packets |
| A | 0 | 41 | 0 |
| B | 0 | 41 | 0 |
| C | 0 | 41 | 0 |
| D | 0 | 41 | 0 |
| Mode M0 | |||
|---|---|---|---|
| Quadrant | BADHDUFLAG | Total packets | Discarded packets |
| A | 0 | 30463 | 3 |
| B | 0 | 36515 | 3 |
| C | 0 | 31747 | 3 |
| D | 0 | 52901 | 3 |
| Quadrant | Total seconds | Saturated seconds | Saturation percentage |
|---|---|---|---|
| A | 14339 | 61 | 0.425413% |
| B | 14339 | 707 | 4.930609% |
| C | 14339 | 138 | 0.962410% |
| D | 14339 | 1560 | 10.879420% |
Noise dominated data is calculated using 1-second bins in cleaned event files. If a bin has >2000 counts, and if more than 50% of those come from <1% of pixels, then it is considered to be noise-dominated and hence unusable.
| Quadrant | # 1 sec bins | Bins with >0 counts | Bins with >2000 counts | High rate bins dominated by noise | Noise dominated (total time) | Noise dominated (detector-on time) | Marked lightcurve |
|---|---|---|---|---|---|---|---|
| A | 18400 | 14342 | 28 | 28 | 0.15% | 0.20% | 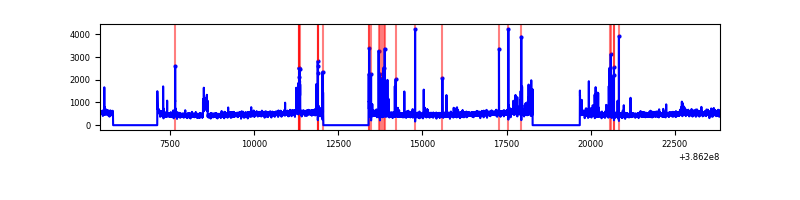 |
| B | 18400 | 14342 | 433 | 433 | 2.35% | 3.02% | 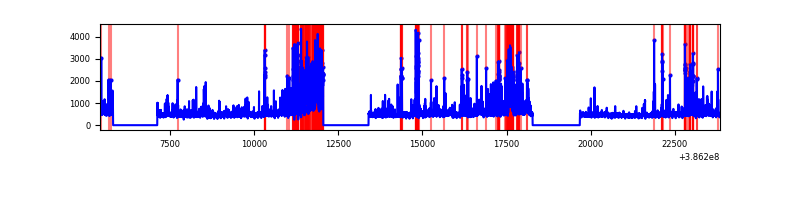 |
| C | 18400 | 14342 | 100 | 100 | 0.54% | 0.70% | 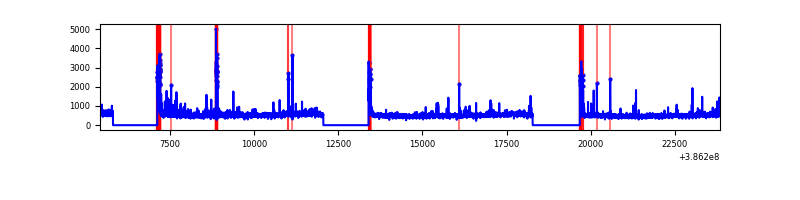 |
| D | 18400 | 14342 | 1248 | 1248 | 6.78% | 8.70% | 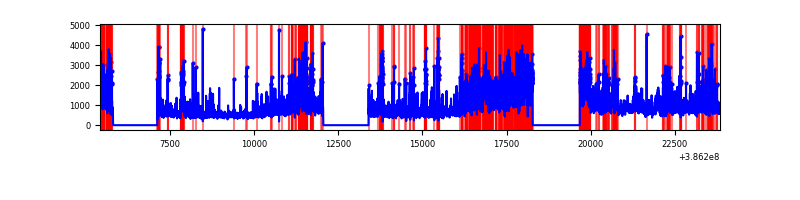 |
Top three noisy pixels from each quadrant. If the there are fewer than three noisy pixels in the level2.evt file, extra rows are filled as -1
| Pixel properties | Quadrant properties | ||||||
|---|---|---|---|---|---|---|---|
| Quadrant | DetID | PixID | Counts | Sigma | Mean | Median | Sigma |
| A | 15 | 169 | 553460 | 1631.61 | 1685 | 1651 | 338.2 |
| A | 10 | 83 | 173395 | 507.82 | 1685 | 1651 | 338.2 |
| A | 13 | 6 | 38814 | 109.89 | 1685 | 1651 | 338.2 |
| B | 5 | 172 | 1599492 | 5023.82 | 1643 | 1602 | 318.1 |
| B | 5 | 236 | 751005 | 2356.15 | 1643 | 1602 | 318.1 |
| B | 10 | 245 | 92472 | 285.7 | 1643 | 1602 | 318.1 |
| C | 15 | 214 | 594821 | 1571.25 | 1631 | 1643 | 377.5 |
| C | 0 | 10 | 480251 | 1267.77 | 1631 | 1643 | 377.5 |
| C | 14 | 67 | 233950 | 615.35 | 1631 | 1643 | 377.5 |
| D | 8 | 195 | 3216047 | 8354.32 | 1574 | 1532 | 384.8 |
| D | 5 | 223 | 1654830 | 4296.82 | 1574 | 1532 | 384.8 |
| D | 7 | 80 | 833150 | 2161.32 | 1574 | 1532 | 384.8 |
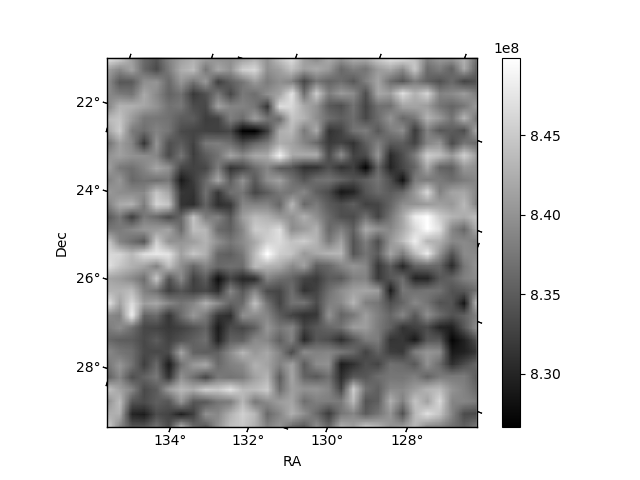
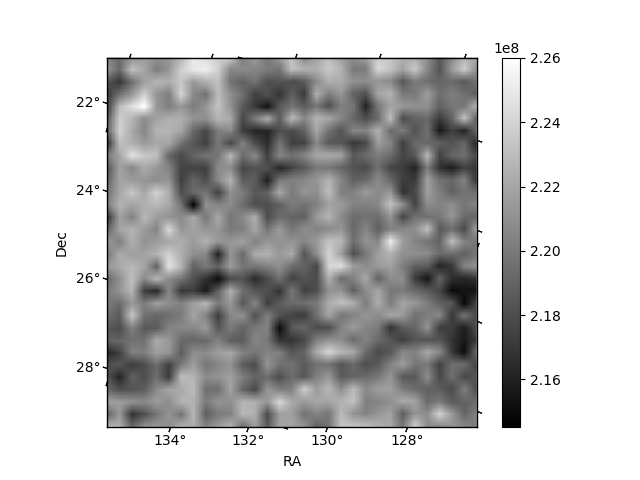
Histogram calculated using DETX and DETY for each event in the final _common_clean file
| Quadrant A | 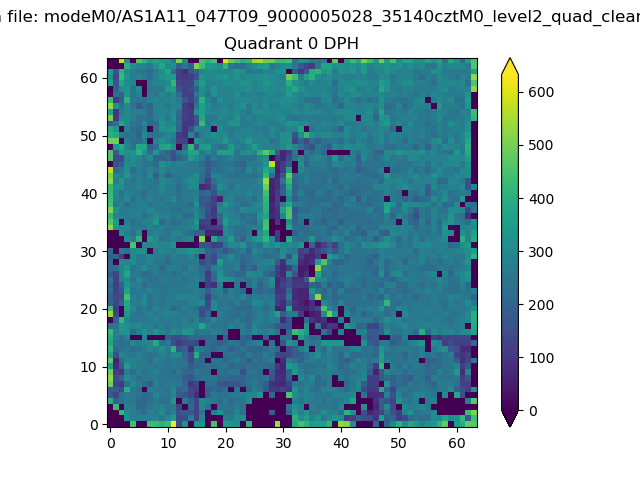 |
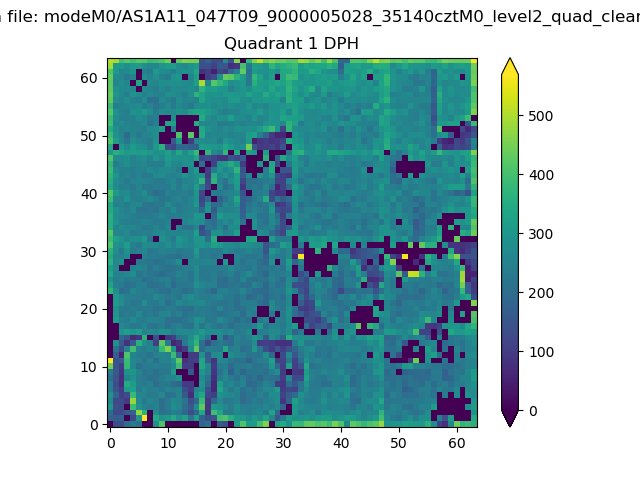 |
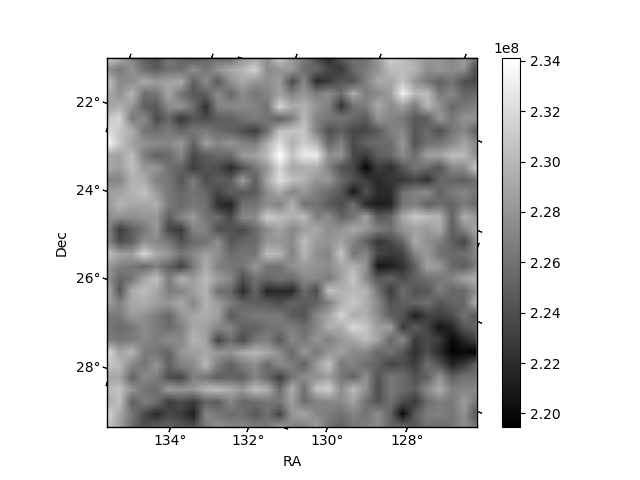
Quadrant B |
|---|---|---|---|
| Quadrant D | 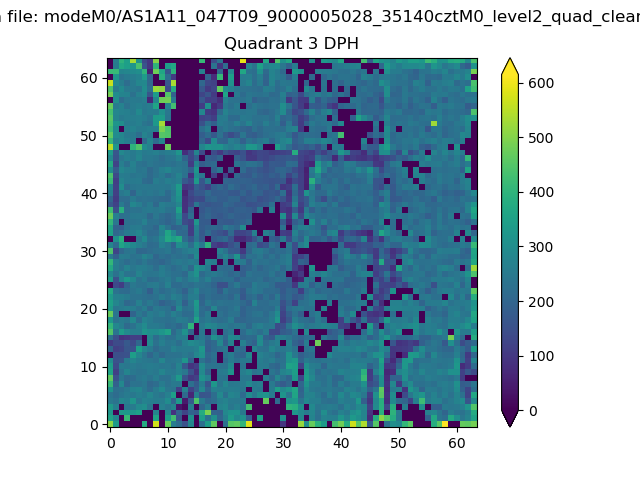 |
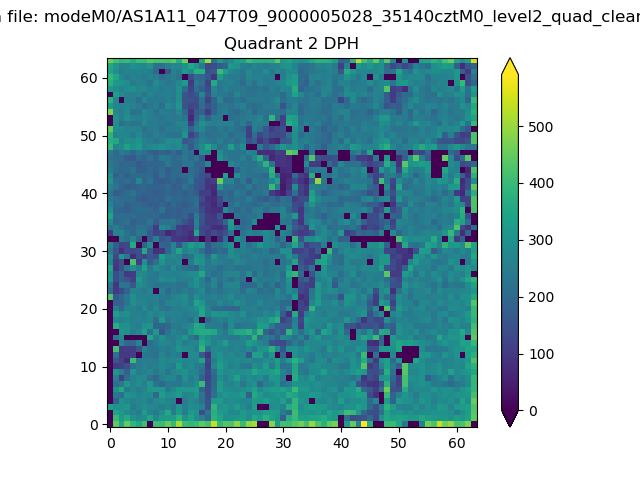 |
Quadrant C |
| Plot type | Count rate plots | Images |
|---|---|---|
| Comparison with Poisson distribution Blue bars denote a histogram of data divided into 1 sec bins. Red curve is a Poisson curve with rate = median count rate of data. |
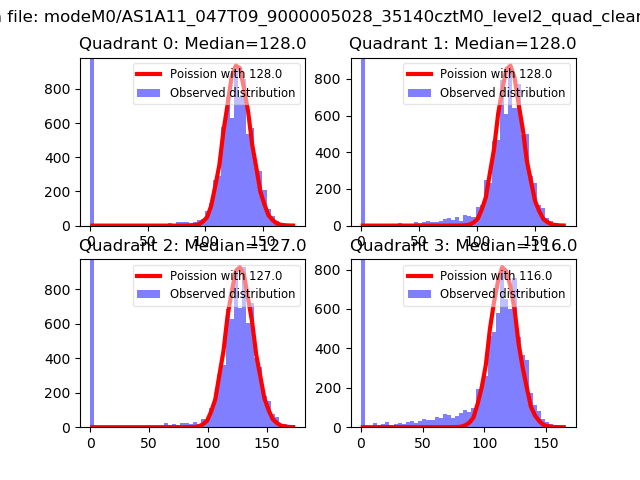 |
 |
| Quadrant-wise count rates Data is divided into 100 sec bins |
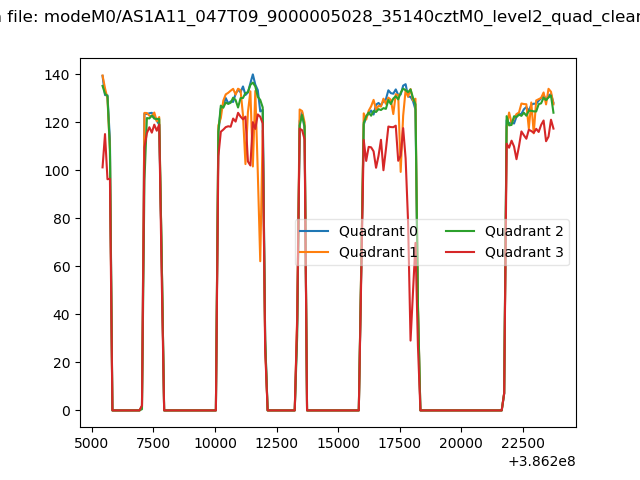 |
|
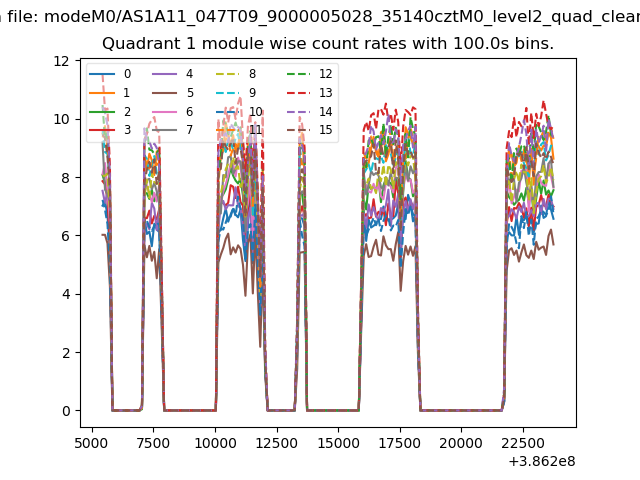
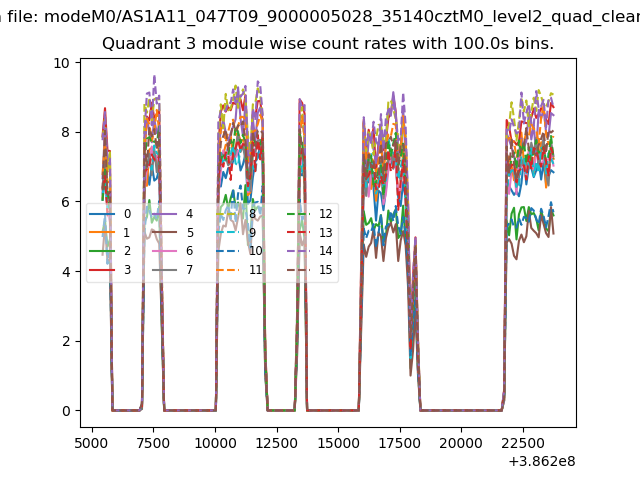
| Module-wise count rates for Quadrant A Data is divided into 100 sec bins |
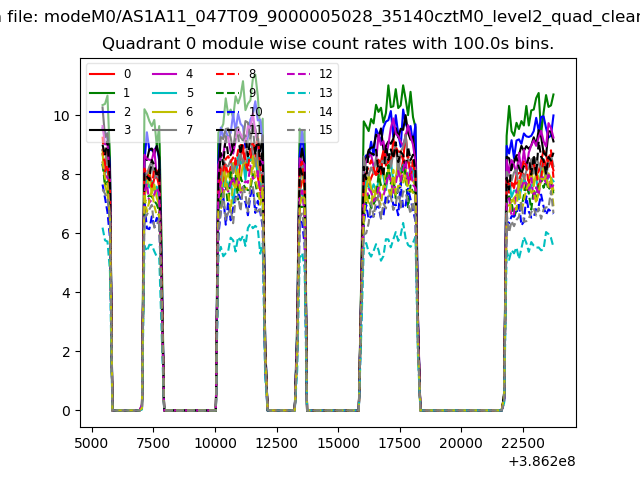 |
 |
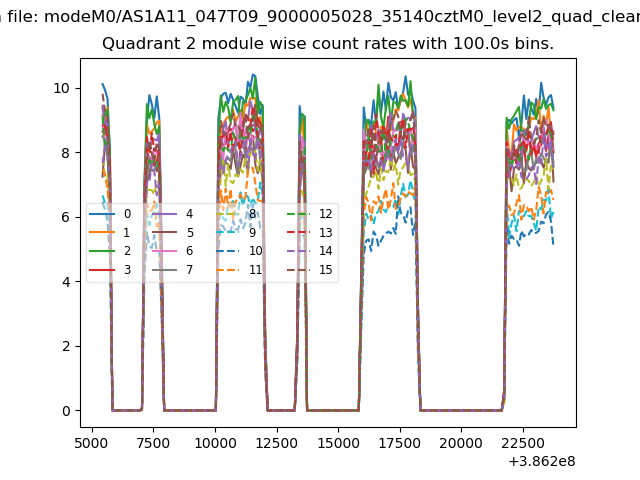
| Module-wise count rates for Quadrant B Data is divided into 100 sec bins |
 |
 |
| Module-wise count rates for Quadrant C Data is divided into 100 sec bins |
 |
 |
| Module-wise count rates for Quadrant D Data is divided into 100 sec bins |
 |
 |
| Parameter | Plot |
|---|---|
| CZT HV Monitor |  |
| D_VDD | 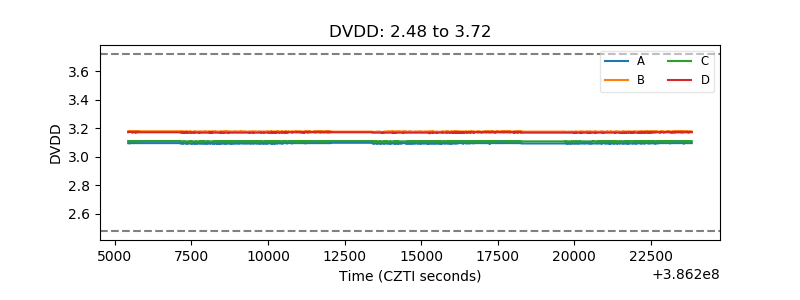 |
| Temperature 1 | 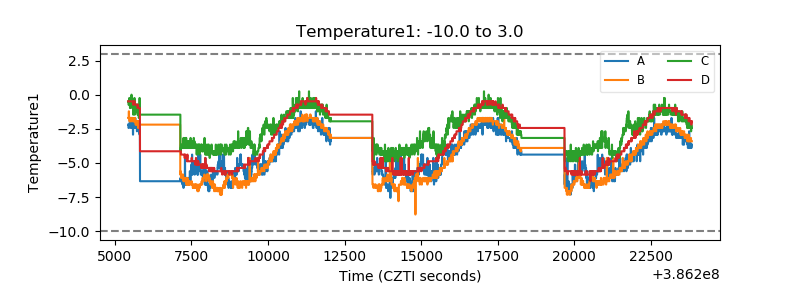 |
| Veto HV Monitor | 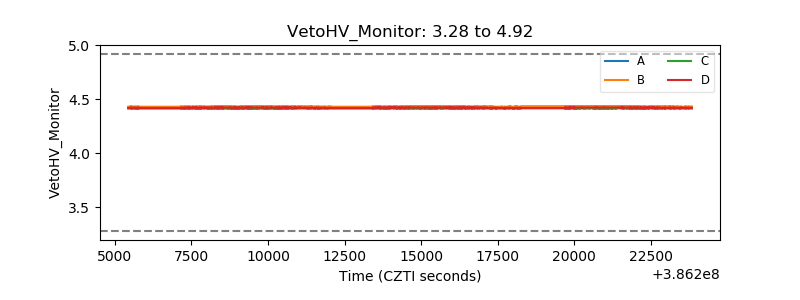 |
| Veto LLD | 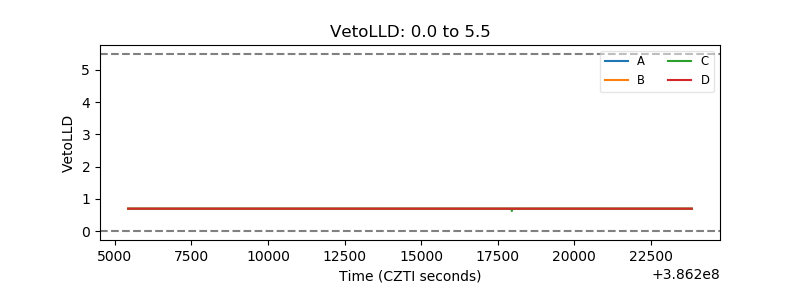 |
| Alpha Counter | 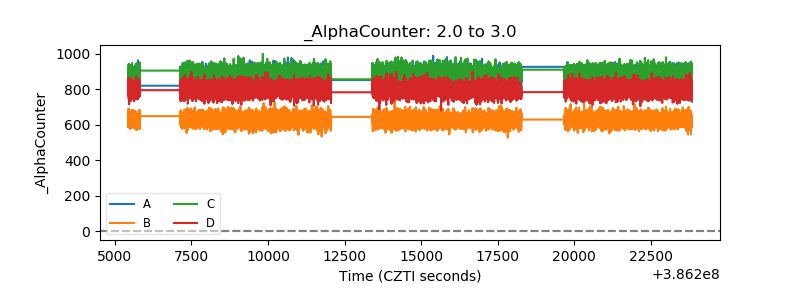 |
| _CPM_Rate | 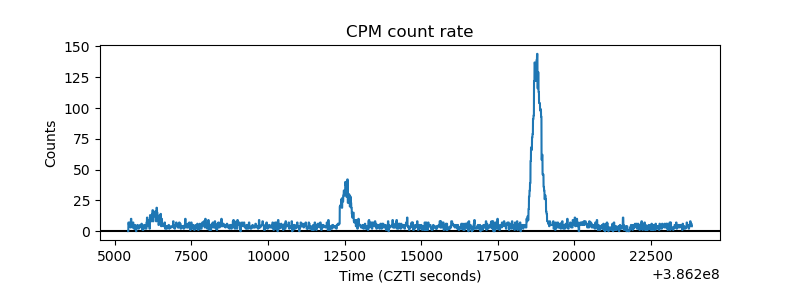 |
| CZT Counter | 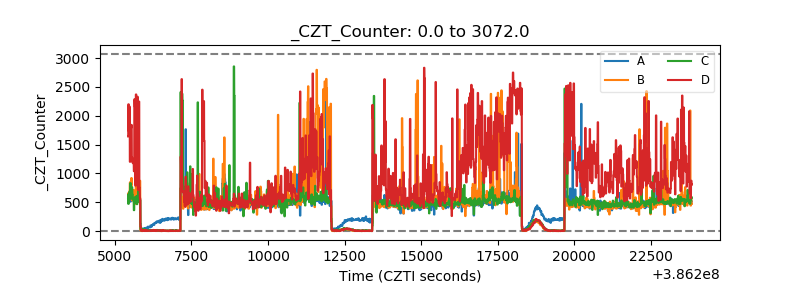 |
| +2.5 Volts monitor | 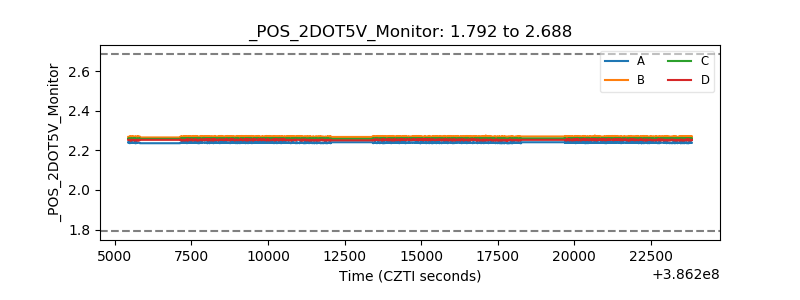 |
| +5 Volts monitor | 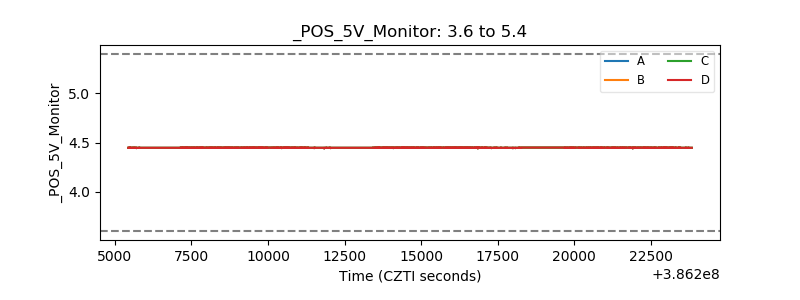 |
| _ROLL_ROT | 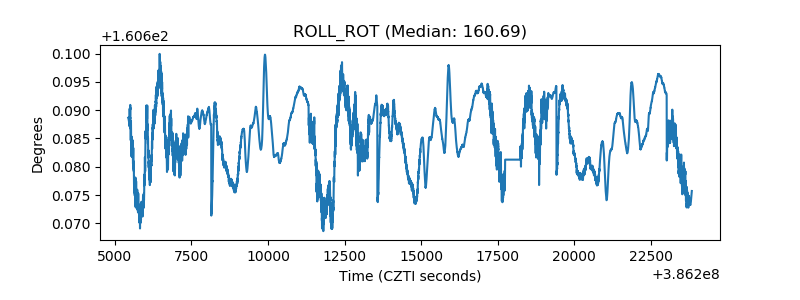 |
| _Roll_DEC | 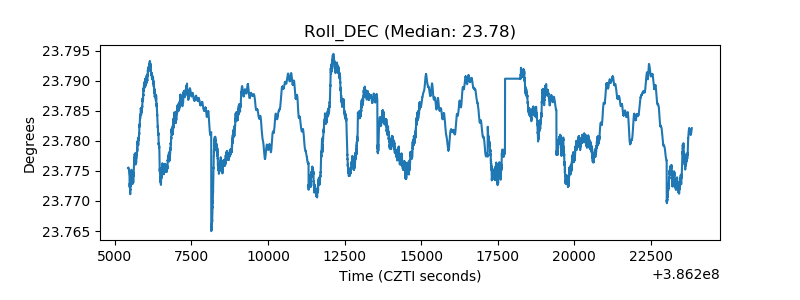 |
| _Roll_RA | 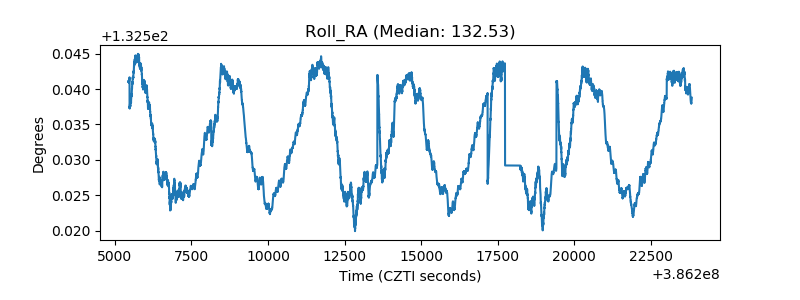 |
| Veto Counter | 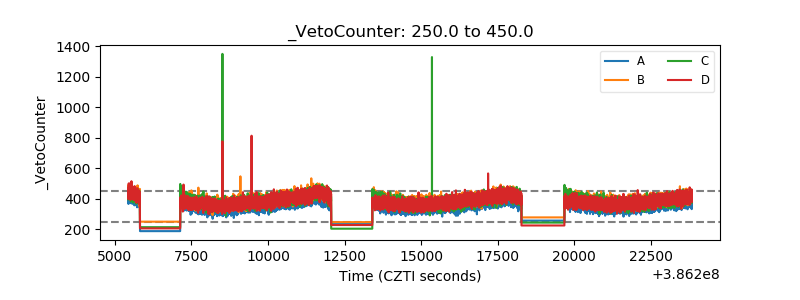 |