| Param | Original file | Final file |
|---|---|---|
| Filename | modeM0/AS1A11_047T09_9000005028_35137cztM0_level2.evt | modeM0/AS1A11_047T09_9000005028_35137cztM0_level2_quad_clean.evt |
| Size (bytes) | 557,228,160 | 72,892,800 |
| Size | 531.4 MB | 69.5 MB |
| Events in quadrant A | 3,237,490 | 454,362 |
| Events in quadrant B | 3,315,485 | 466,879 |
| Events in quadrant C | 3,468,816 | 455,528 |
| Events in quadrant D | 6,449,218 | 412,559 |
| Mode SS | |||
|---|---|---|---|
| Quadrant | BADHDUFLAG | Total packets | Discarded packets |
| A | 0 | 122 | 0 |
| B | 0 | 122 | 0 |
| C | 0 | 122 | 0 |
| D | 0 | 122 | 0 |
| Mode M9 | |||
|---|---|---|---|
| Quadrant | BADHDUFLAG | Total packets | Discarded packets |
| A | 0 | 28 | 0 |
| B | 0 | 28 | 0 |
| C | 0 | 28 | 0 |
| D | 0 | 28 | 0 |
| Mode M0 | |||
|---|---|---|---|
| Quadrant | BADHDUFLAG | Total packets | Discarded packets |
| A | 0 | 13304 | 3 |
| B | 0 | 13688 | 2 |
| C | 0 | 13929 | 2 |
| D | 0 | 23322 | 2 |
| Quadrant | Total seconds | Saturated seconds | Saturation percentage |
|---|---|---|---|
| A | 5983 | 145 | 2.423533% |
| B | 5983 | 97 | 1.621260% |
| C | 5983 | 125 | 2.089253% |
| D | 5983 | 619 | 10.345980% |
Noise dominated data is calculated using 1-second bins in cleaned event files. If a bin has >2000 counts, and if more than 50% of those come from <1% of pixels, then it is considered to be noise-dominated and hence unusable.
| Quadrant | # 1 sec bins | Bins with >0 counts | Bins with >2000 counts | High rate bins dominated by noise | Noise dominated (total time) | Noise dominated (detector-on time) | Marked lightcurve |
|---|---|---|---|---|---|---|---|
| A | 8699 | 5985 | 96 | 96 | 1.10% | 1.60% | 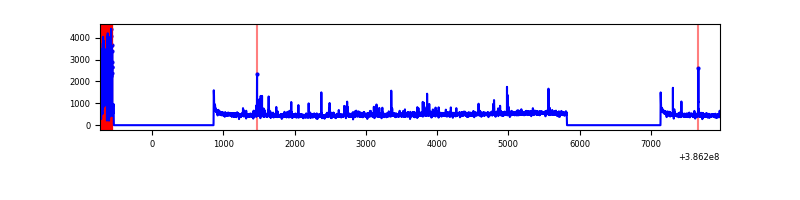 |
| B | 8699 | 5985 | 57 | 57 | 0.66% | 0.95% | 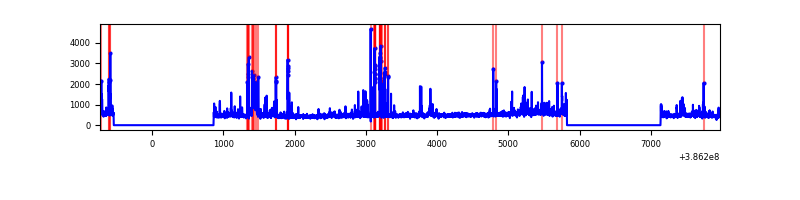 |
| C | 8699 | 5985 | 91 | 91 | 1.05% | 1.52% | 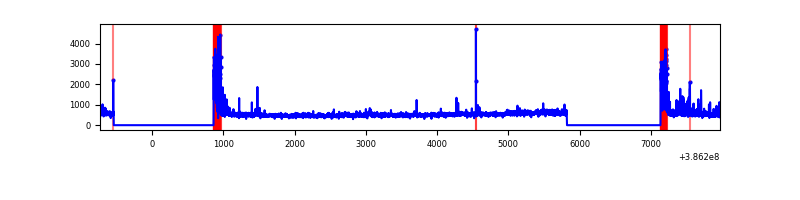 |
| D | 8699 | 5985 | 498 | 498 | 5.72% | 8.32% | 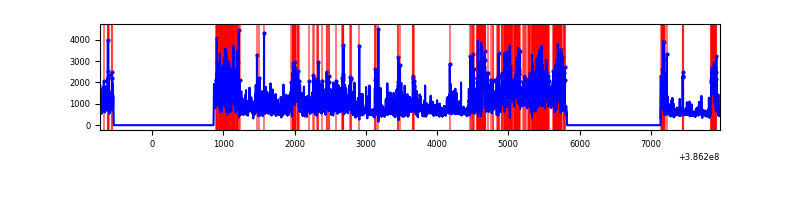 |
Top three noisy pixels from each quadrant. If the there are fewer than three noisy pixels in the level2.evt file, extra rows are filled as -1
| Pixel properties | Quadrant properties | ||||||
|---|---|---|---|---|---|---|---|
| Quadrant | DetID | PixID | Counts | Sigma | Mean | Median | Sigma |
| A | 15 | 169 | 458486 | 3298.52 | 689 | 678 | 138.8 |
| A | 10 | 83 | 92037 | 658.24 | 689 | 678 | 138.8 |
| A | 13 | 6 | 11936 | 81.11 | 689 | 678 | 138.8 |
| B | 5 | 172 | 211943 | 1548.95 | 692 | 674 | 136.4 |
| B | 3 | 112 | 107603 | 783.97 | 692 | 674 | 136.4 |
| B | 5 | 200 | 90446 | 658.18 | 692 | 674 | 136.4 |
| C | 0 | 10 | 405710 | 2586.62 | 674 | 680 | 156.6 |
| C | 15 | 214 | 249532 | 1589.23 | 674 | 680 | 156.6 |
| C | 14 | 67 | 120759 | 766.85 | 674 | 680 | 156.6 |
| D | 8 | 195 | 2184351 | 13606.61 | 657 | 640 | 160.5 |
| D | 12 | 233 | 224180 | 1392.87 | 657 | 640 | 160.5 |
| D | 2 | 153 | 222612 | 1383.1 | 657 | 640 | 160.5 |
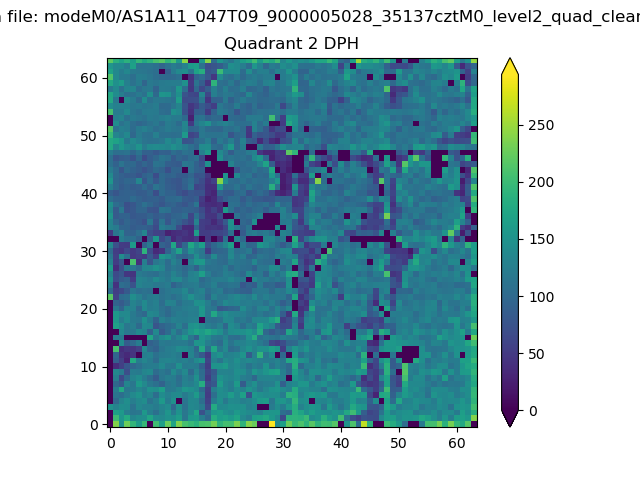
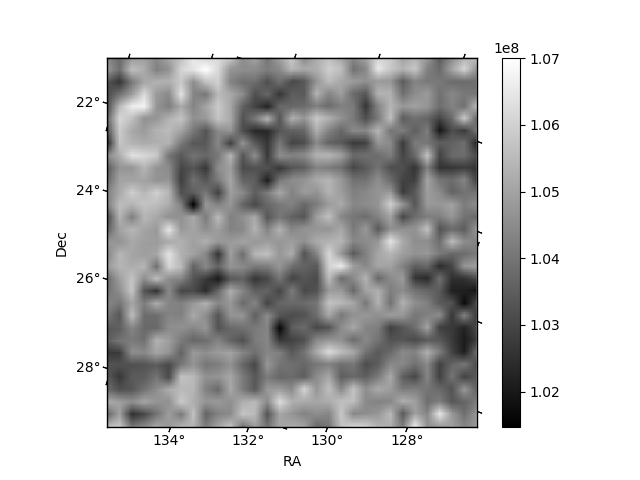
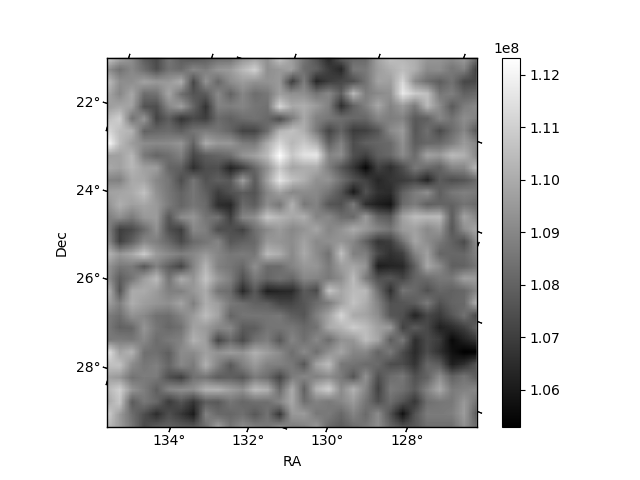
Histogram calculated using DETX and DETY for each event in the final _common_clean file
| Quadrant A | 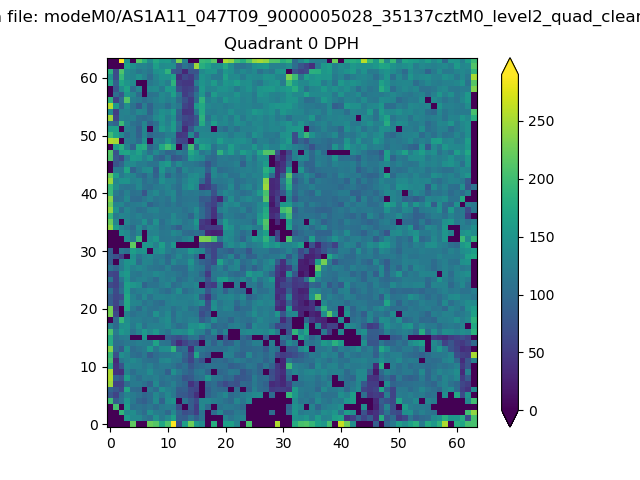 |
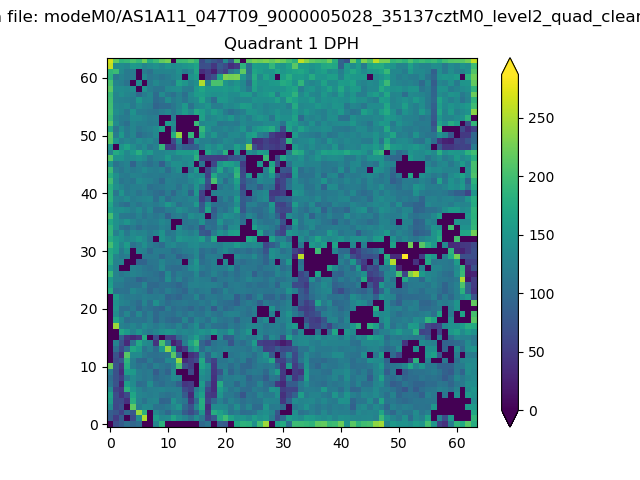 |
Quadrant B |
|---|---|---|---|
| Quadrant D | 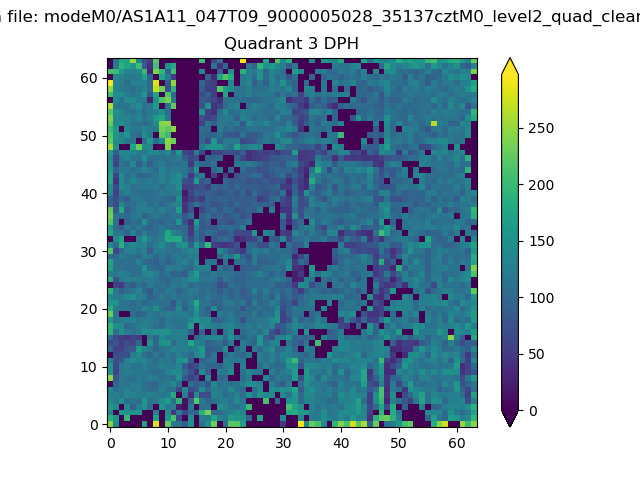 |
 |
Quadrant C |
| Plot type | Count rate plots | Images |
|---|---|---|
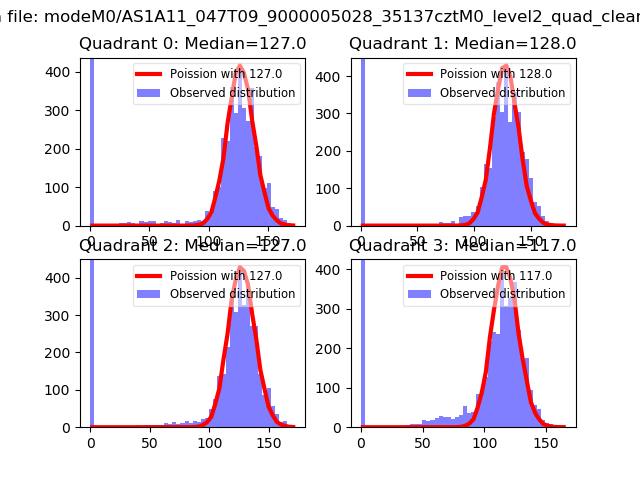
| Comparison with Poisson distribution Blue bars denote a histogram of data divided into 1 sec bins. Red curve is a Poisson curve with rate = median count rate of data. |
 |
 |
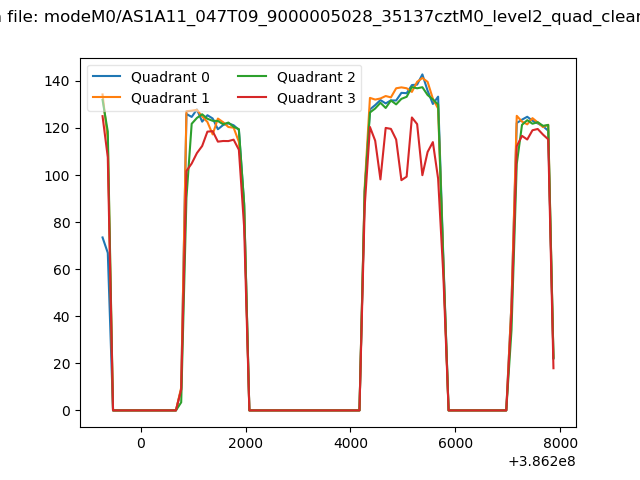
| Quadrant-wise count rates Data is divided into 100 sec bins |
 |
|
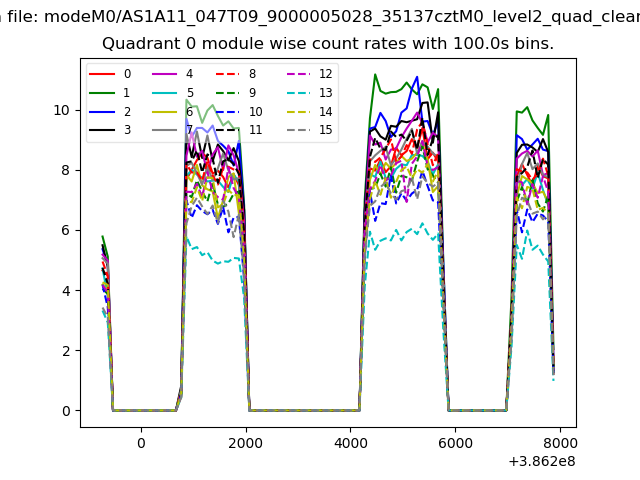
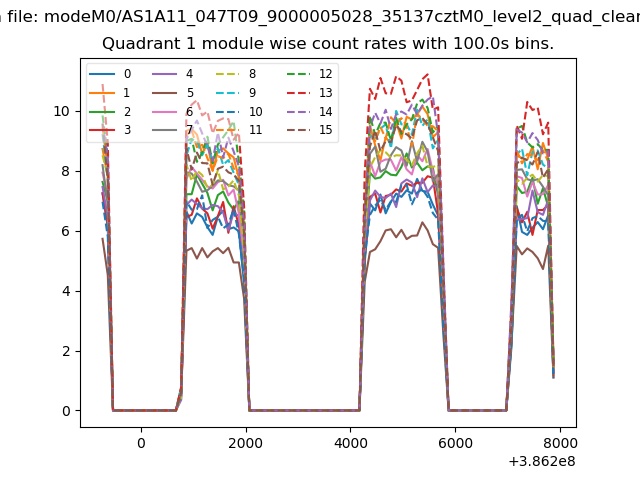
| Module-wise count rates for Quadrant A Data is divided into 100 sec bins |
 |
 |
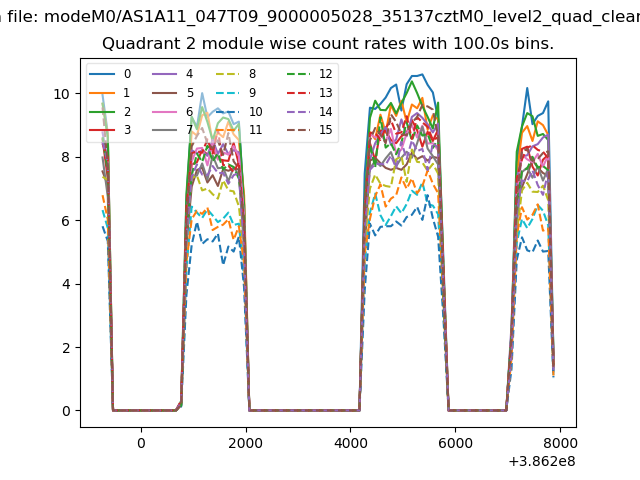
| Module-wise count rates for Quadrant B Data is divided into 100 sec bins |
 |
 |
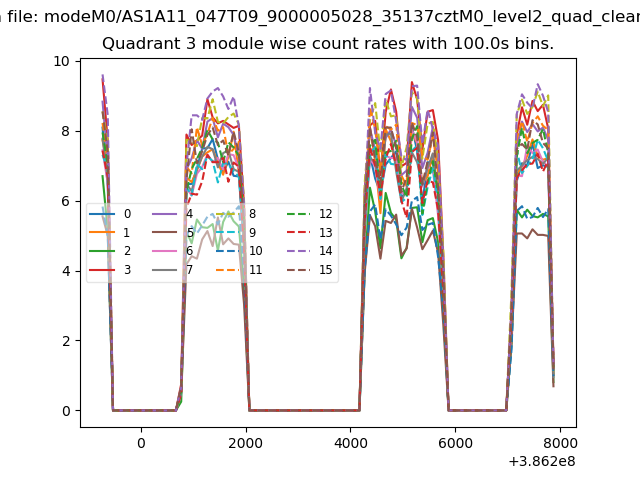
| Module-wise count rates for Quadrant C Data is divided into 100 sec bins |
 |
 |
| Module-wise count rates for Quadrant D Data is divided into 100 sec bins |
 |
 |
| Parameter | Plot |
|---|---|
| CZT HV Monitor | 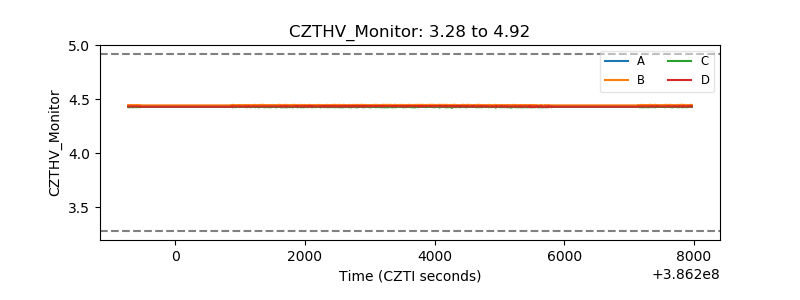 |
| D_VDD | 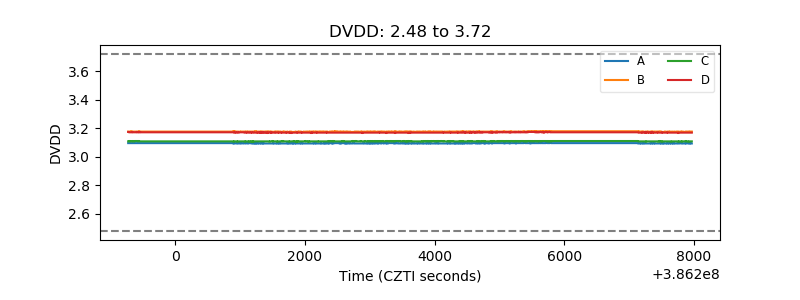 |
| Temperature 1 | 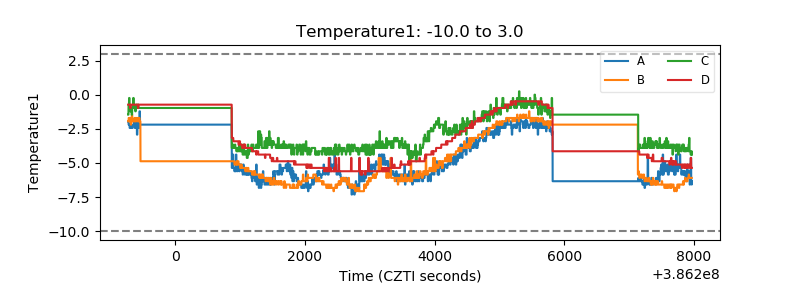 |
| Veto HV Monitor | 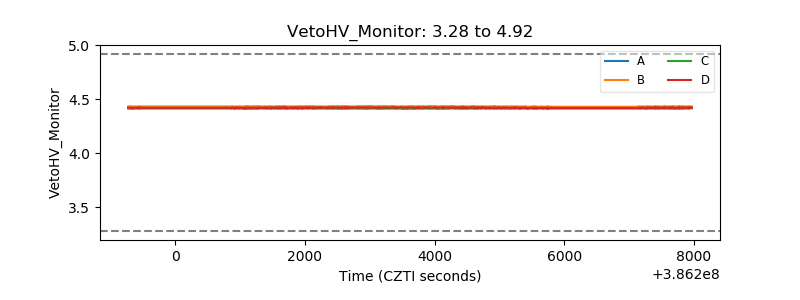 |
| Veto LLD | 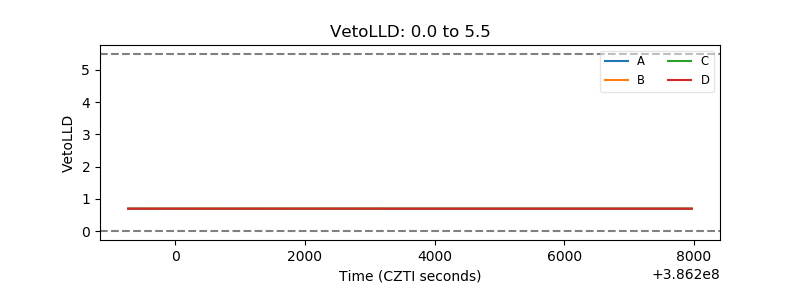 |
| Alpha Counter | 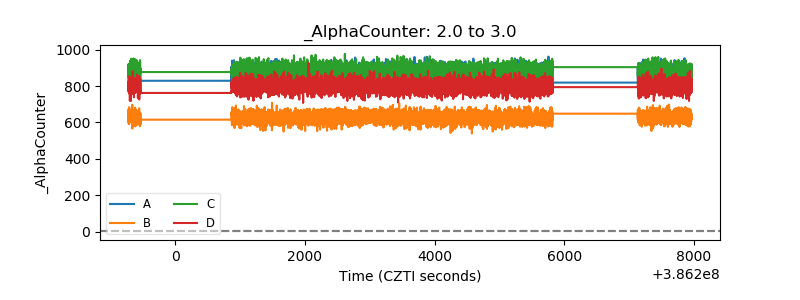 |
| _CPM_Rate | 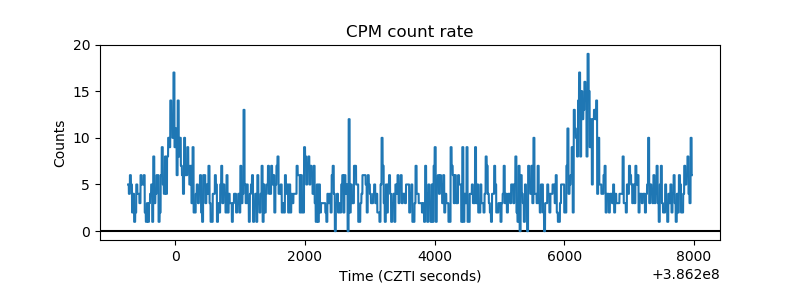 |
| CZT Counter | 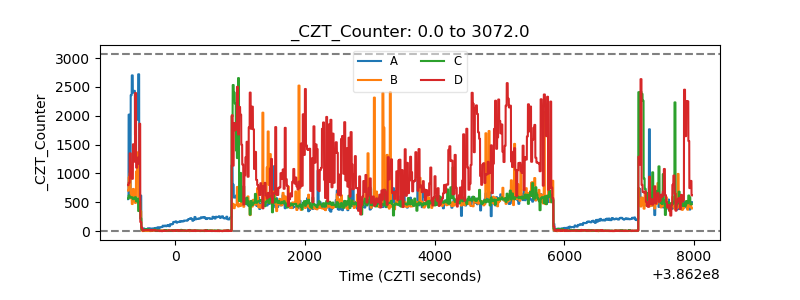 |
| +2.5 Volts monitor |  |
| +5 Volts monitor | 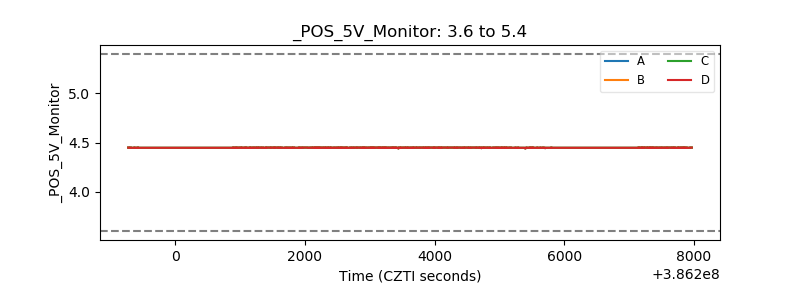 |
| _ROLL_ROT | 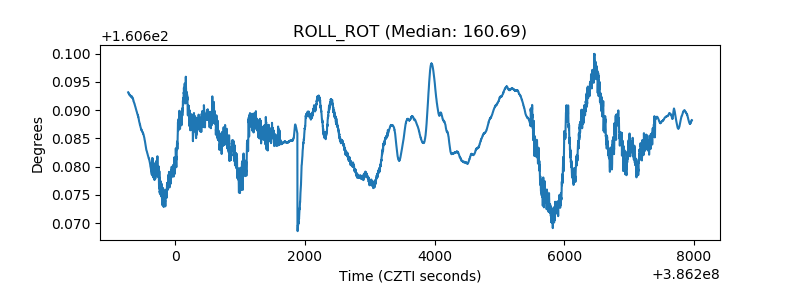 |
| _Roll_DEC | 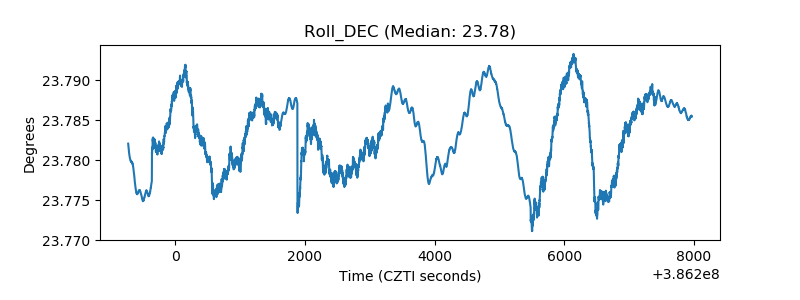 |
| _Roll_RA | 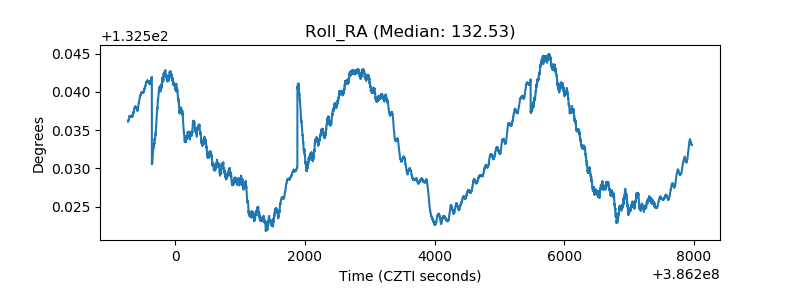 |
| Veto Counter | 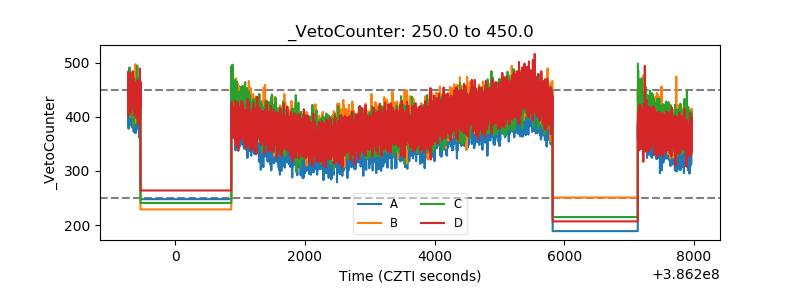 |