| Param | Original file | Final file |
|---|---|---|
| Filename | modeM0/AS1A11_047T09_9000005028_35136cztM0_level2.evt | modeM0/AS1A11_047T09_9000005028_35136cztM0_level2_quad_clean.evt |
| Size (bytes) | 551,059,200 | 68,860,800 |
| Size | 525.5 MB | 65.7 MB |
| Events in quadrant A | 4,175,800 | 405,384 |
| Events in quadrant B | 3,146,293 | 443,473 |
| Events in quadrant C | 3,262,131 | 431,611 |
| Events in quadrant D | 5,717,492 | 404,134 |
| Mode SS | |||
|---|---|---|---|
| Quadrant | BADHDUFLAG | Total packets | Discarded packets |
| A | 0 | 116 | 0 |
| B | 0 | 116 | 0 |
| C | 0 | 116 | 0 |
| D | 0 | 116 | 0 |
| Mode M9 | |||
|---|---|---|---|
| Quadrant | BADHDUFLAG | Total packets | Discarded packets |
| A | 0 | 28 | 0 |
| B | 0 | 28 | 0 |
| C | 0 | 28 | 0 |
| D | 0 | 29 | 0 |
| Mode M0 | |||
|---|---|---|---|
| Quadrant | BADHDUFLAG | Total packets | Discarded packets |
| A | 0 | 16074 | 3 |
| B | 0 | 13003 | 2 |
| C | 0 | 13059 | 2 |
| D | 0 | 21084 | 2 |
| Quadrant | Total seconds | Saturated seconds | Saturation percentage |
|---|---|---|---|
| A | 5724 | 465 | 8.123690% |
| B | 5724 | 81 | 1.415094% |
| C | 5724 | 117 | 2.044025% |
| D | 5724 | 290 | 5.066387% |
Noise dominated data is calculated using 1-second bins in cleaned event files. If a bin has >2000 counts, and if more than 50% of those come from <1% of pixels, then it is considered to be noise-dominated and hence unusable.
| Quadrant | # 1 sec bins | Bins with >0 counts | Bins with >2000 counts | High rate bins dominated by noise | Noise dominated (total time) | Noise dominated (detector-on time) | Marked lightcurve |
|---|---|---|---|---|---|---|---|
| A | 7126 | 5725 | 316 | 316 | 4.43% | 5.52% | 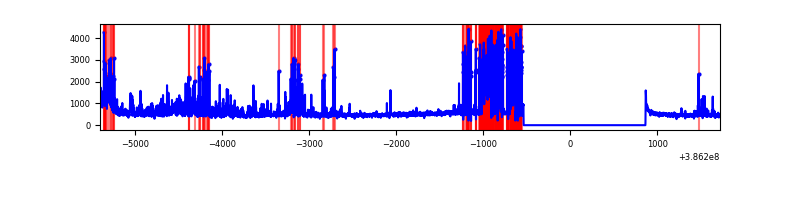 |
| B | 7126 | 5725 | 41 | 41 | 0.58% | 0.72% | 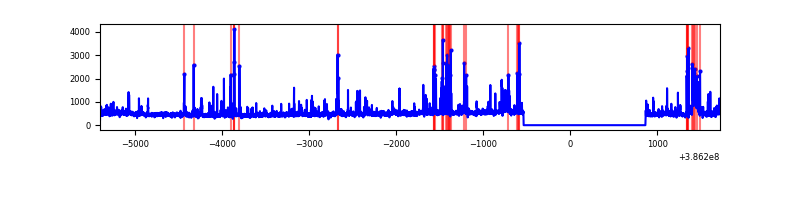 |
| C | 7126 | 5725 | 80 | 80 | 1.12% | 1.40% | 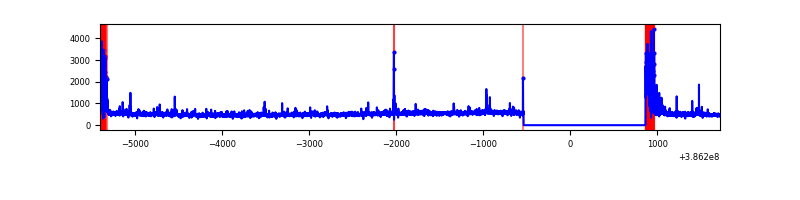 |
| D | 7126 | 5725 | 277 | 277 | 3.89% | 4.84% | 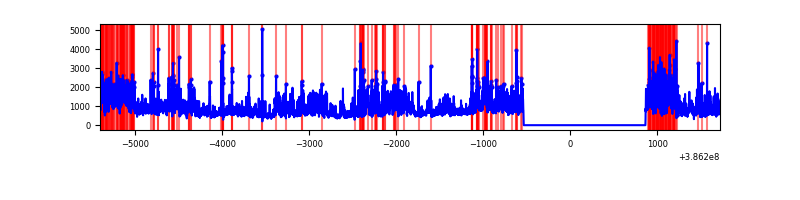 |
Top three noisy pixels from each quadrant. If the there are fewer than three noisy pixels in the level2.evt file, extra rows are filled as -1
| Pixel properties | Quadrant properties | ||||||
|---|---|---|---|---|---|---|---|
| Quadrant | DetID | PixID | Counts | Sigma | Mean | Median | Sigma |
| A | 15 | 169 | 1607275 | 12569.7 | 633 | 622 | 127.8 |
| A | 10 | 83 | 88166 | 684.9 | 633 | 622 | 127.8 |
| A | 13 | 6 | 22820 | 173.67 | 633 | 622 | 127.8 |
| B | 5 | 172 | 232062 | 1812.4 | 657 | 642 | 127.7 |
| B | 5 | 200 | 94338 | 733.8 | 657 | 642 | 127.7 |
| B | 3 | 112 | 80228 | 623.29 | 657 | 642 | 127.7 |
| C | 0 | 10 | 342376 | 2266.79 | 642 | 647 | 150.8 |
| C | 15 | 214 | 237771 | 1572.91 | 642 | 647 | 150.8 |
| C | 14 | 67 | 94874 | 625.04 | 642 | 647 | 150.8 |
| D | 8 | 195 | 2040615 | 12845.04 | 638 | 620 | 158.8 |
| D | 13 | 249 | 219371 | 1377.39 | 638 | 620 | 158.8 |
| D | 2 | 250 | 213666 | 1341.47 | 638 | 620 | 158.8 |
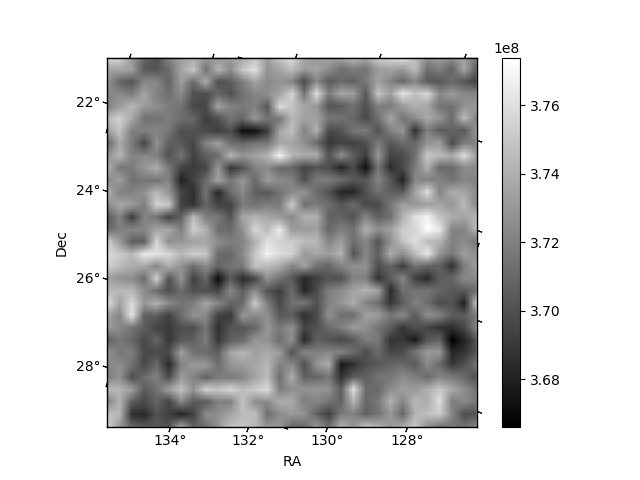
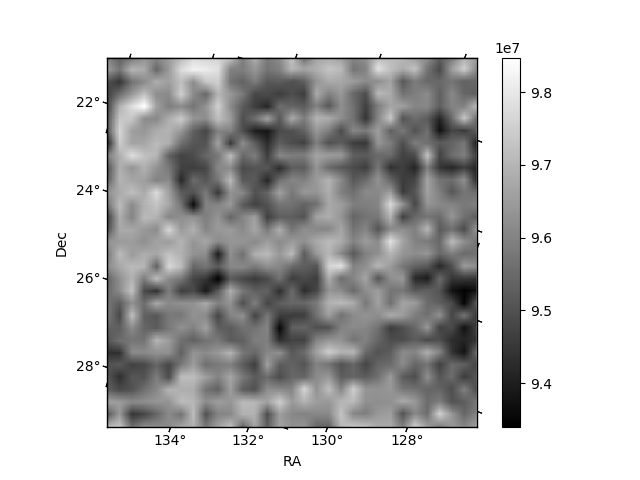
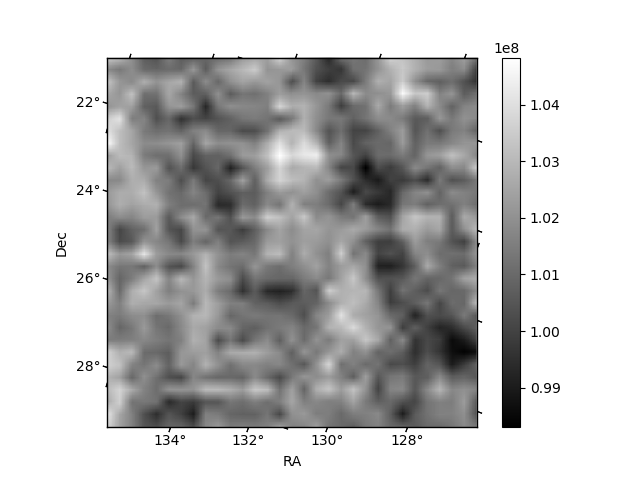
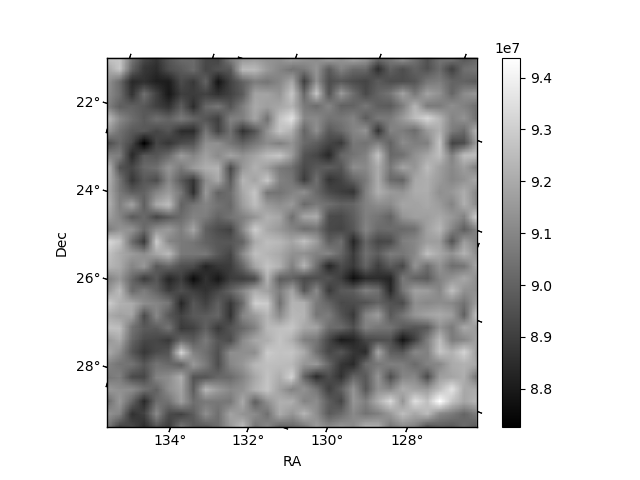
Histogram calculated using DETX and DETY for each event in the final _common_clean file
| Quadrant A | 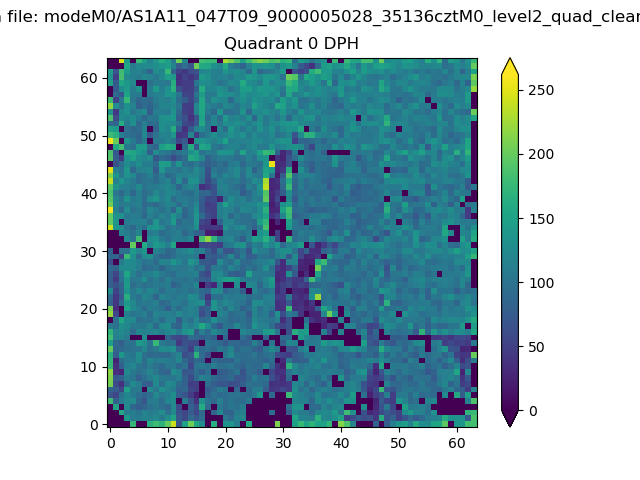 |
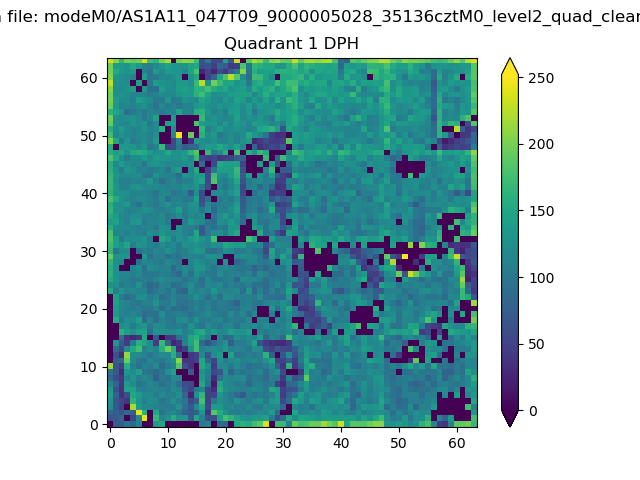 |
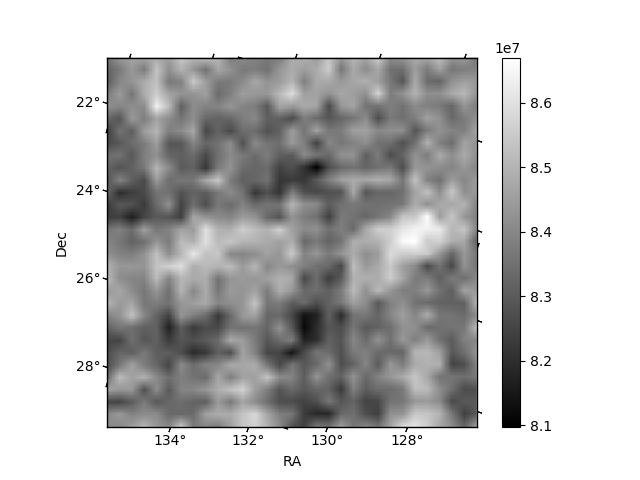
Quadrant B |
|---|---|---|---|
| Quadrant D | 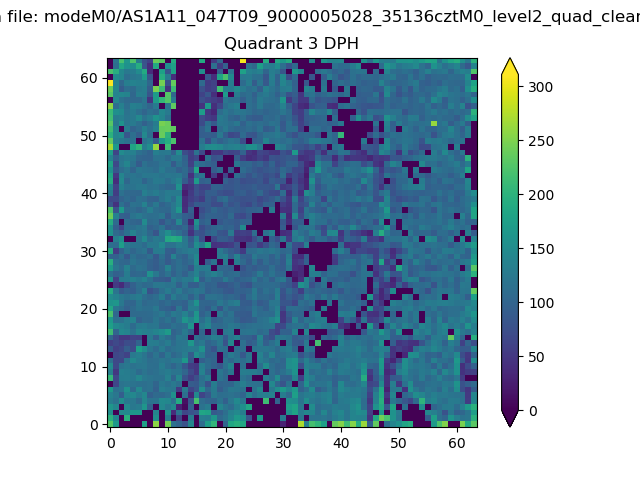 |
 |
Quadrant C |
| Plot type | Count rate plots | Images |
|---|---|---|
| Comparison with Poisson distribution Blue bars denote a histogram of data divided into 1 sec bins. Red curve is a Poisson curve with rate = median count rate of data. |
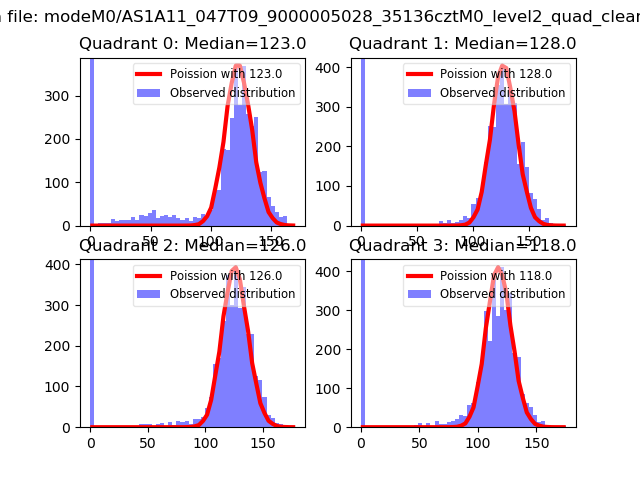 |
 |
| Quadrant-wise count rates Data is divided into 100 sec bins |
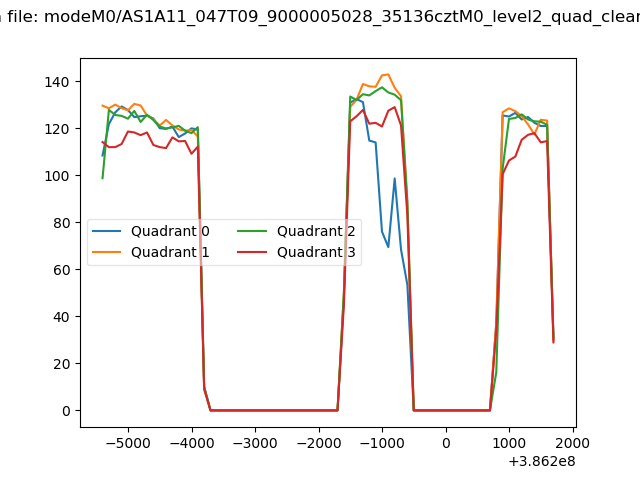 |
|
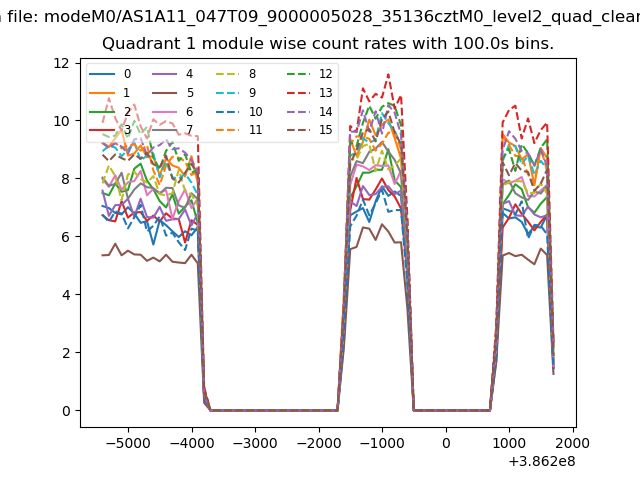
| Module-wise count rates for Quadrant A Data is divided into 100 sec bins |
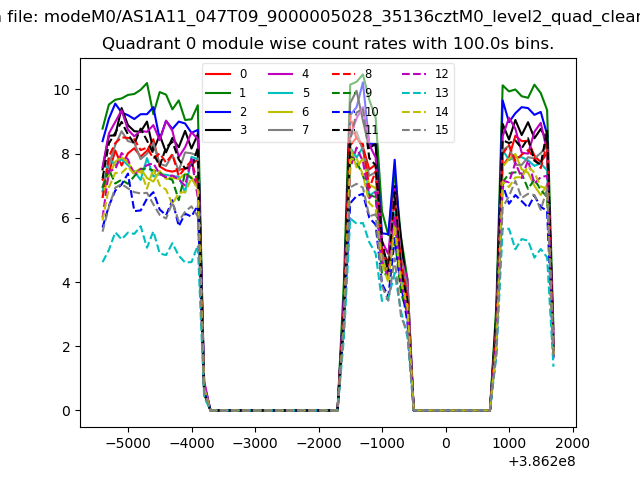 |
 |
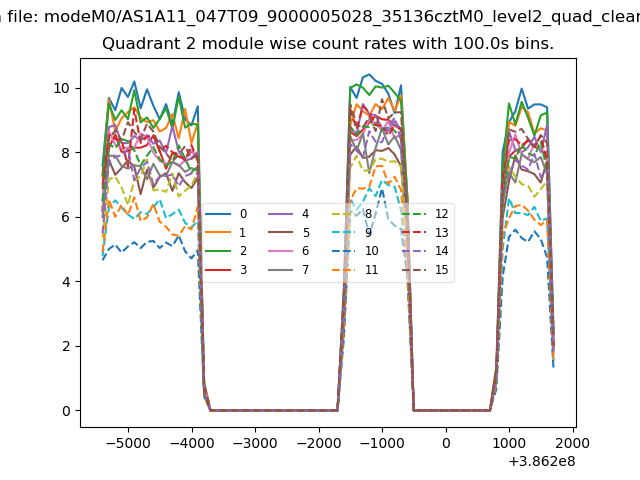
| Module-wise count rates for Quadrant B Data is divided into 100 sec bins |
 |
 |
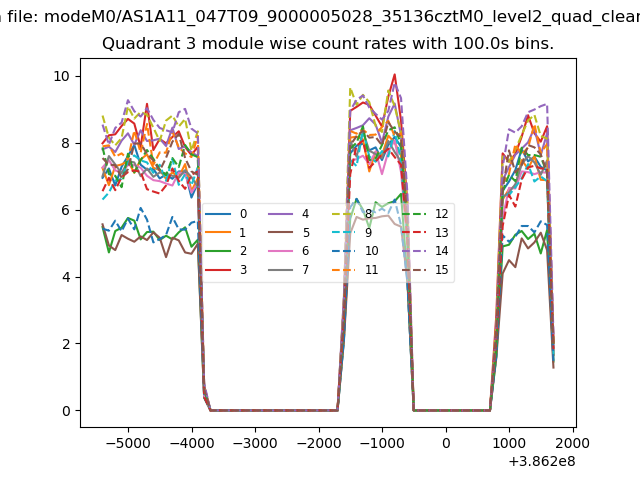
| Module-wise count rates for Quadrant C Data is divided into 100 sec bins |
 |
 |
| Module-wise count rates for Quadrant D Data is divided into 100 sec bins |
 |
 |
| Parameter | Plot |
|---|---|
| CZT HV Monitor | 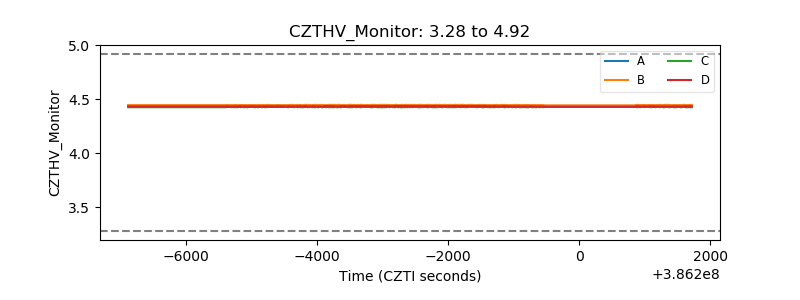 |
| D_VDD | 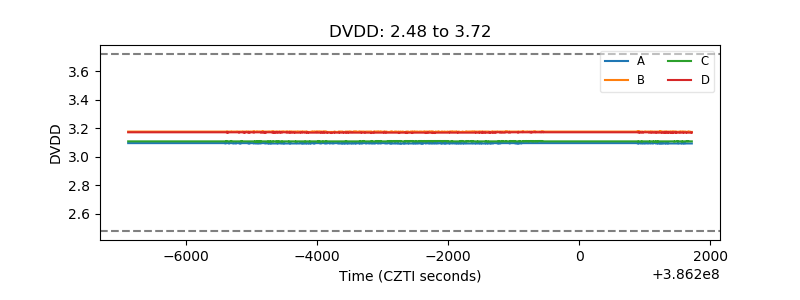 |
| Temperature 1 | 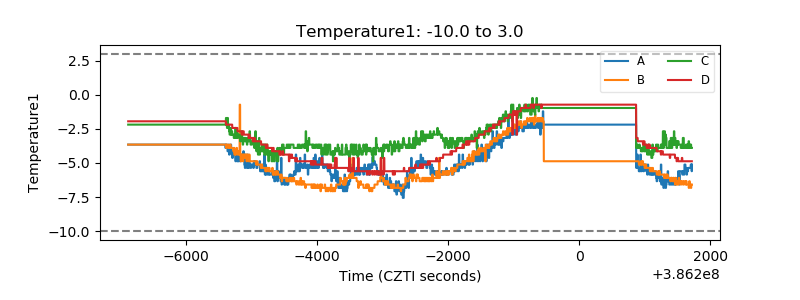 |
| Veto HV Monitor | 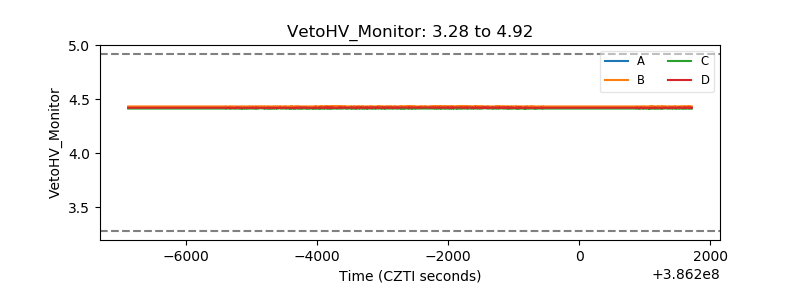 |
| Veto LLD | 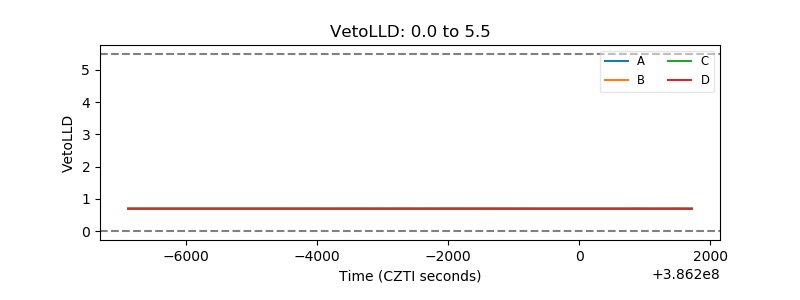 |
| Alpha Counter | 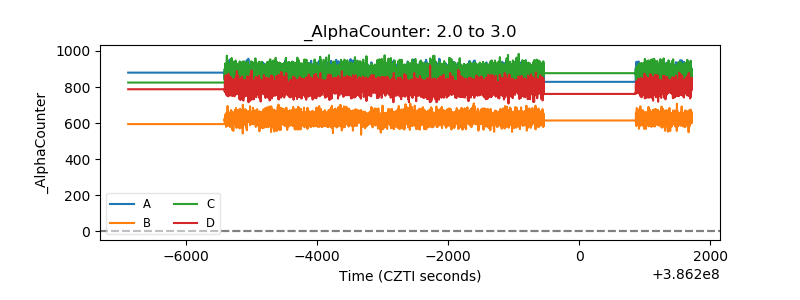 |
| _CPM_Rate | 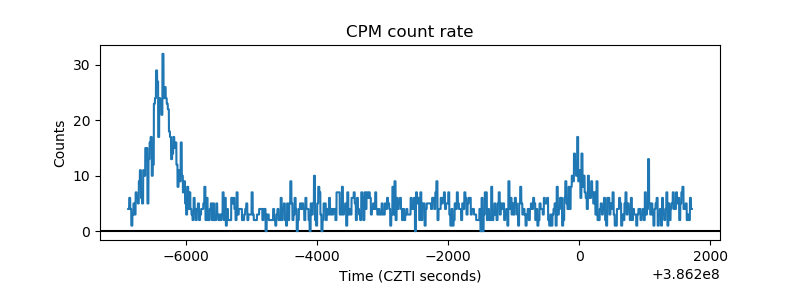 |
| CZT Counter | 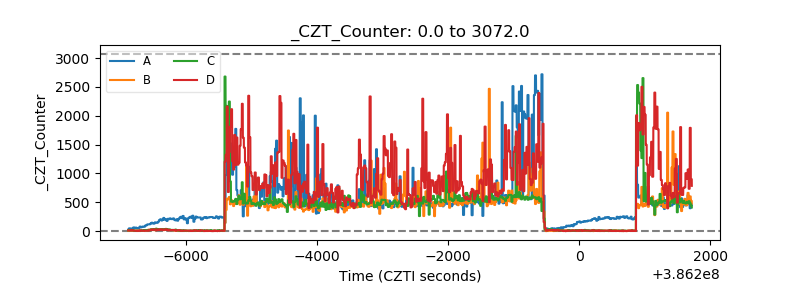 |
| +2.5 Volts monitor | 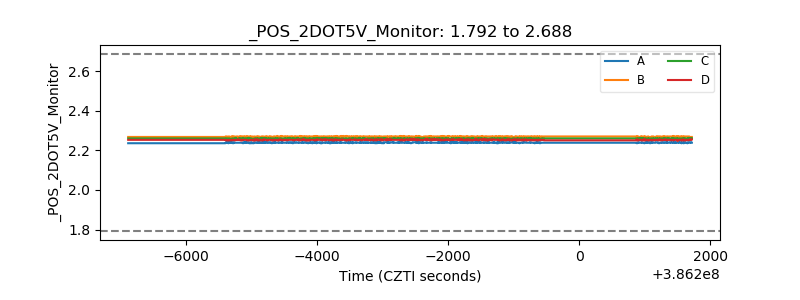 |
| +5 Volts monitor | 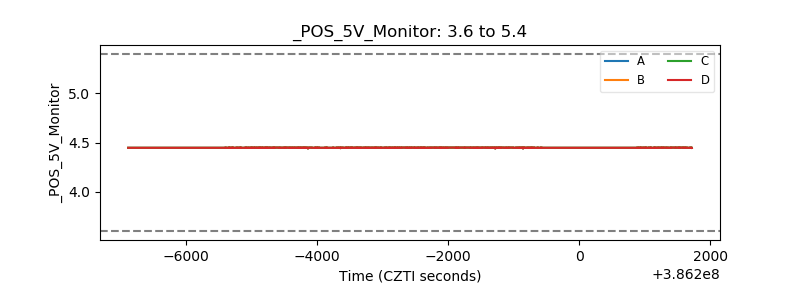 |
| _ROLL_ROT | 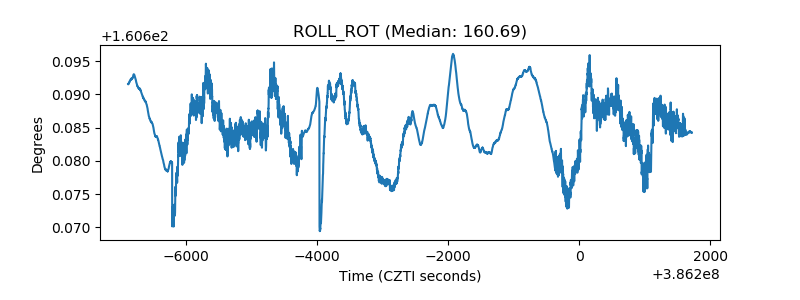 |
| _Roll_DEC | 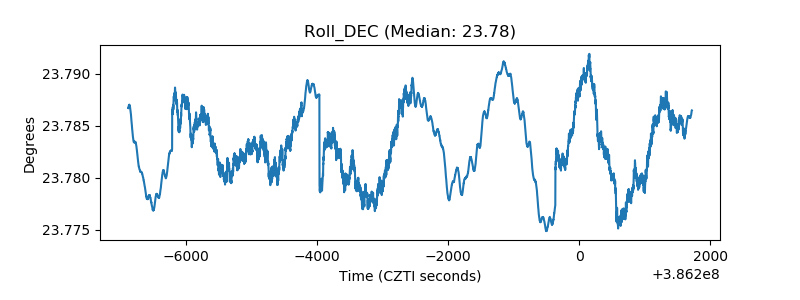 |
| _Roll_RA | 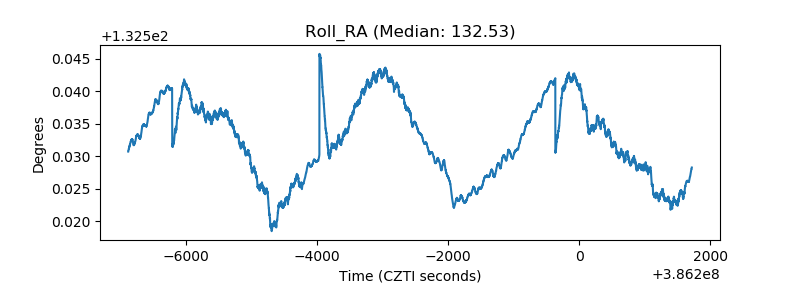 |
| Veto Counter | 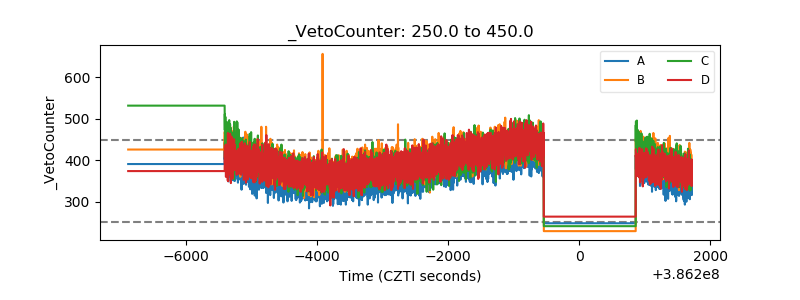 |