| Param | Original file | Final file |
|---|---|---|
| Filename | modeM0/AS1A11_047T09_9000005028_35133cztM0_level2.evt | modeM0/AS1A11_047T09_9000005028_35133cztM0_level2_quad_clean.evt |
| Size (bytes) | 772,064,640 | 71,671,680 |
| Size | 736.3 MB | 68.4 MB |
| Events in quadrant A | 10,409,472 | 279,448 |
| Events in quadrant B | 3,142,479 | 543,872 |
| Events in quadrant C | 2,950,762 | 529,084 |
| Events in quadrant D | 6,540,321 | 463,476 |
| Mode SS | |||
|---|---|---|---|
| Quadrant | BADHDUFLAG | Total packets | Discarded packets |
| A | 0 | 102 | 0 |
| B | 0 | 102 | 0 |
| C | 0 | 102 | 0 |
| D | 0 | 102 | 0 |
| Mode M9 | |||
|---|---|---|---|
| Quadrant | BADHDUFLAG | Total packets | Discarded packets |
| A | 0 | 21 | 0 |
| B | 0 | 21 | 0 |
| C | 0 | 21 | 0 |
| D | 0 | 21 | 0 |
| Mode M0 | |||
|---|---|---|---|
| Quadrant | BADHDUFLAG | Total packets | Discarded packets |
| A | 0 | 34303 | 2 |
| B | 0 | 12533 | 1 |
| C | 0 | 11676 | 1 |
| D | 0 | 23003 | 1 |
| Quadrant | Total seconds | Saturated seconds | Saturation percentage |
|---|---|---|---|
| A | 5031 | 3714 | 73.822302% |
| B | 5031 | 94 | 1.868416% |
| C | 5031 | 81 | 1.610018% |
| D | 5031 | 715 | 14.211886% |
Noise dominated data is calculated using 1-second bins in cleaned event files. If a bin has >2000 counts, and if more than 50% of those come from <1% of pixels, then it is considered to be noise-dominated and hence unusable.
| Quadrant | # 1 sec bins | Bins with >0 counts | Bins with >2000 counts | High rate bins dominated by noise | Noise dominated (total time) | Noise dominated (detector-on time) | Marked lightcurve |
|---|---|---|---|---|---|---|---|
| A | 7154 | 5032 | 3169 | 3169 | 44.30% | 62.98% | 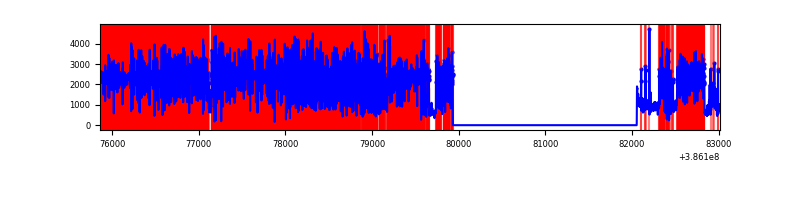 |
| B | 7154 | 5032 | 58 | 58 | 0.81% | 1.15% | 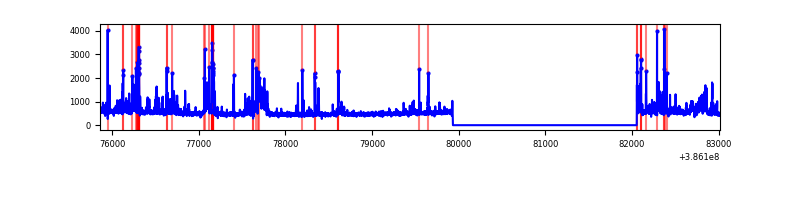 |
| C | 7154 | 5032 | 49 | 49 | 0.68% | 0.97% | 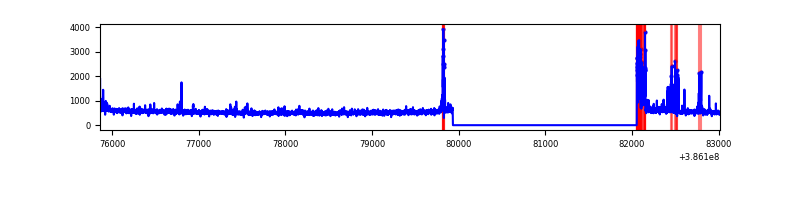 |
| D | 7153 | 5031 | 781 | 781 | 10.92% | 15.52% | 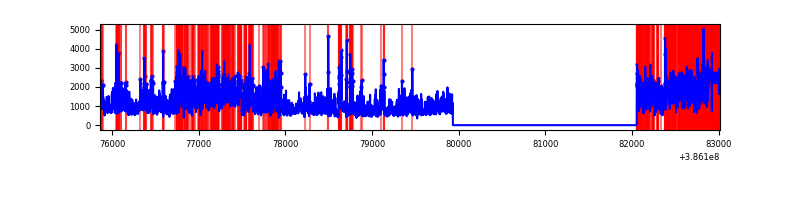 |
Top three noisy pixels from each quadrant. If the there are fewer than three noisy pixels in the level2.evt file, extra rows are filled as -1
| Pixel properties | Quadrant properties | ||||||
|---|---|---|---|---|---|---|---|
| Quadrant | DetID | PixID | Counts | Sigma | Mean | Median | Sigma |
| A | 15 | 169 | 8865696 | 115761.05 | 380 | 374 | 76.6 |
| A | 10 | 83 | 52449 | 679.98 | 380 | 374 | 76.6 |
| A | 9 | 254 | 10343 | 130.17 | 380 | 374 | 76.6 |
| B | 5 | 172 | 472317 | 4033.52 | 615 | 600 | 116.9 |
| B | 0 | 190 | 190628 | 1624.88 | 615 | 600 | 116.9 |
| B | 15 | 85 | 25335 | 211.5 | 615 | 600 | 116.9 |
| C | 0 | 10 | 259265 | 1868.66 | 600 | 608 | 138.4 |
| C | 15 | 214 | 210837 | 1518.79 | 600 | 608 | 138.4 |
| C | 14 | 67 | 81366 | 583.43 | 600 | 608 | 138.4 |
| D | 8 | 195 | 2747571 | 19229.81 | 583 | 569 | 142.9 |
| D | 10 | 118 | 555572 | 3885.18 | 583 | 569 | 142.9 |
| D | 14 | 52 | 302355 | 2112.59 | 583 | 569 | 142.9 |
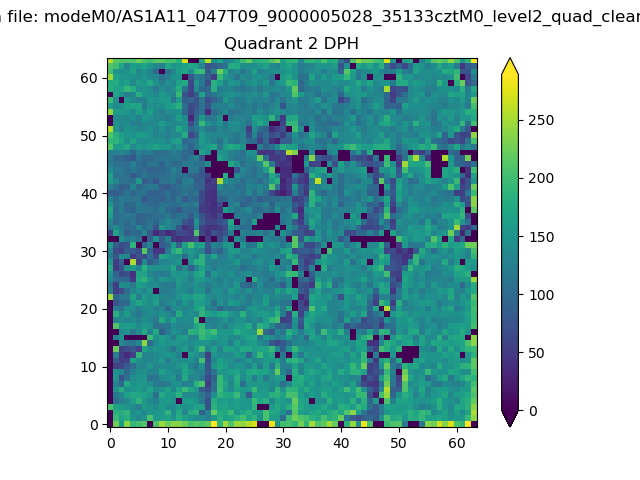
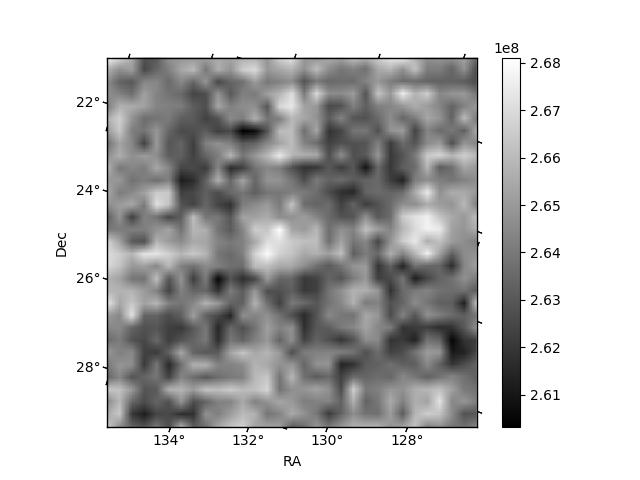
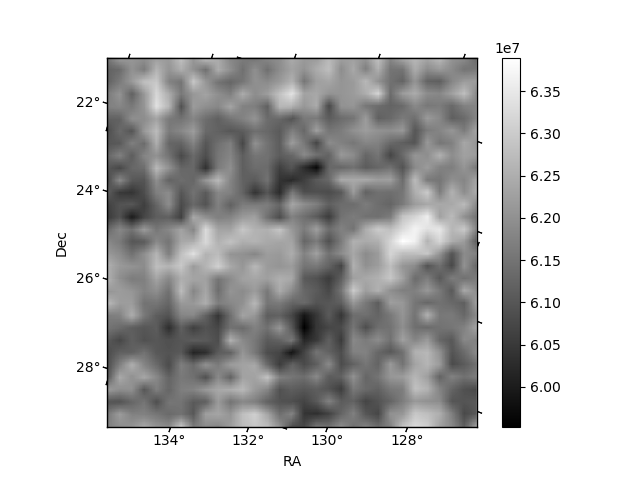
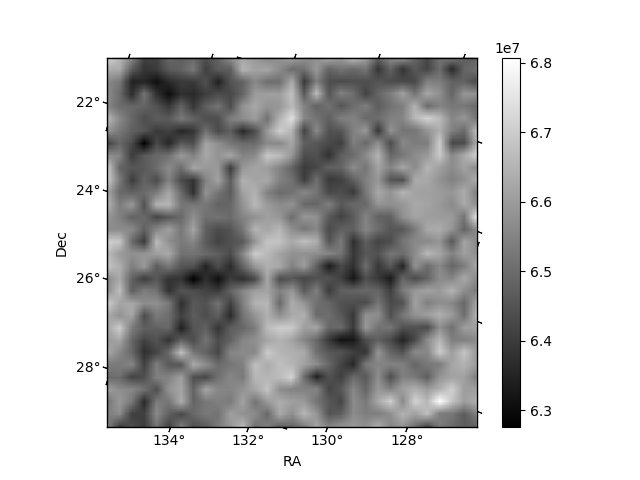
Histogram calculated using DETX and DETY for each event in the final _common_clean file
| Quadrant A | 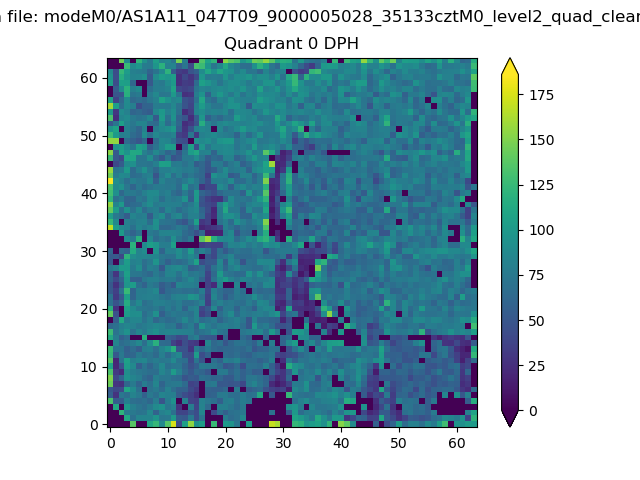 |
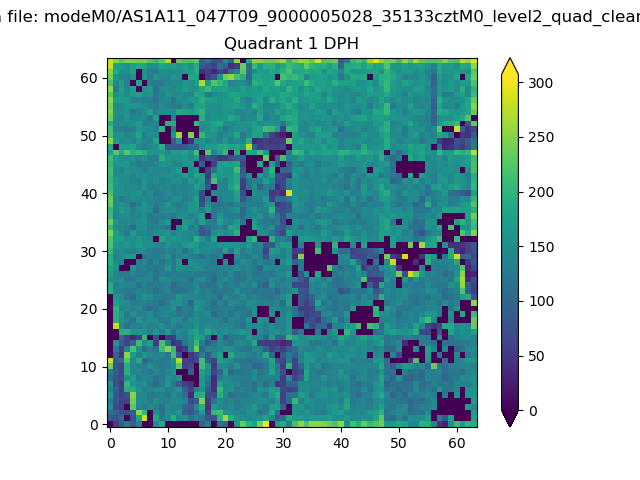 |
Quadrant B |
|---|---|---|---|
| Quadrant D | 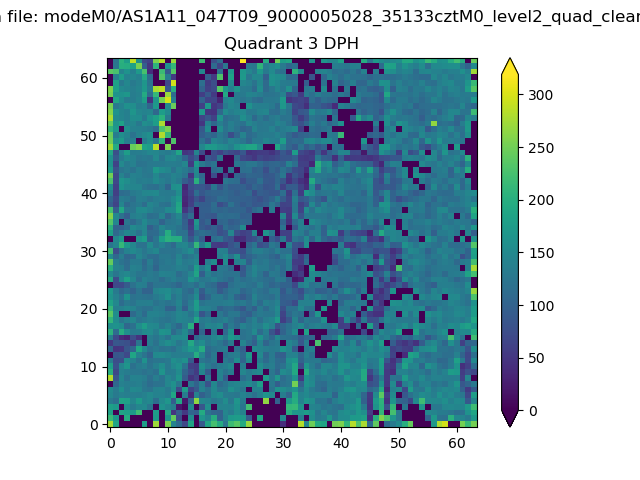 |
 |
Quadrant C |
| Plot type | Count rate plots | Images |
|---|---|---|
| Comparison with Poisson distribution Blue bars denote a histogram of data divided into 1 sec bins. Red curve is a Poisson curve with rate = median count rate of data. |
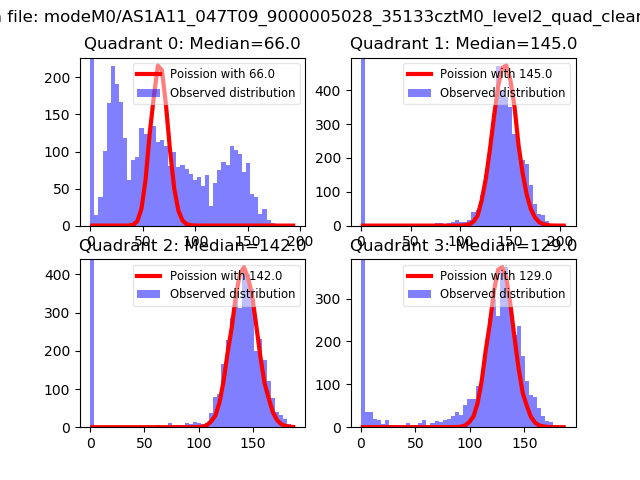 |
 |
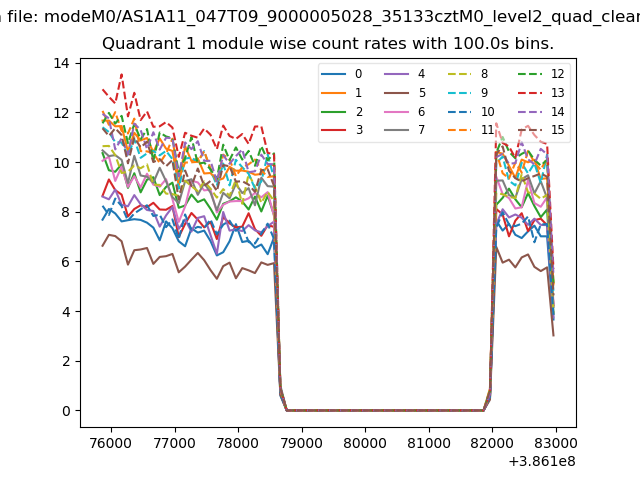
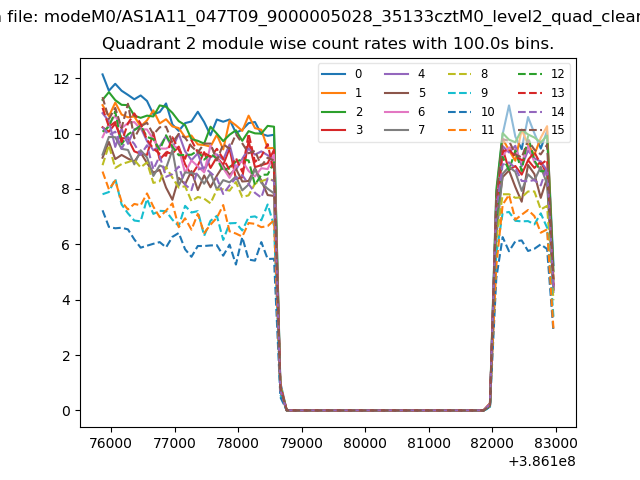
| Quadrant-wise count rates Data is divided into 100 sec bins |
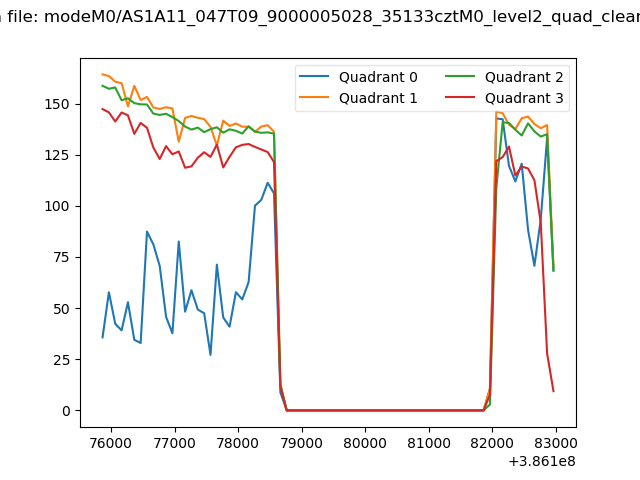 |
|
| Module-wise count rates for Quadrant A Data is divided into 100 sec bins |
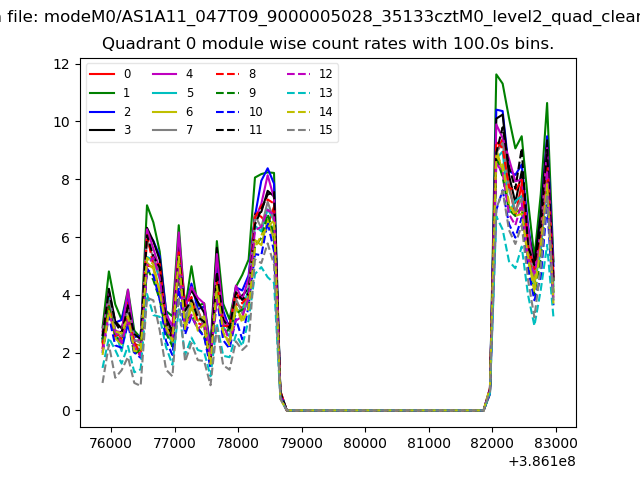 |
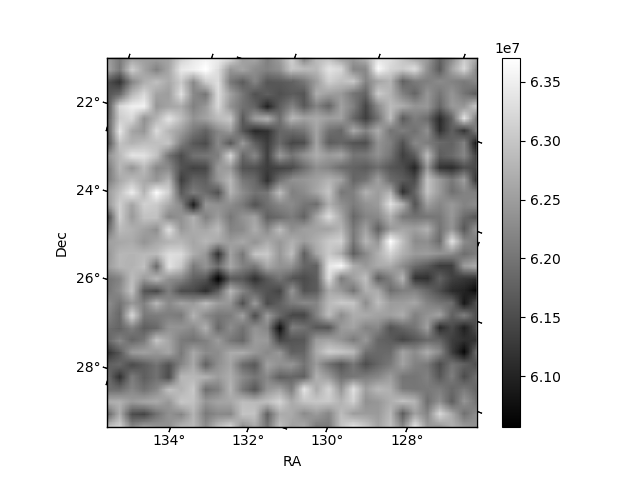 |
| Module-wise count rates for Quadrant B Data is divided into 100 sec bins |
 |
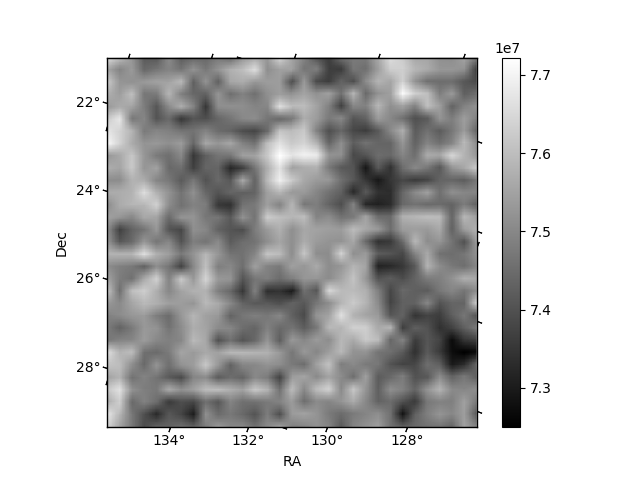 |
| Module-wise count rates for Quadrant C Data is divided into 100 sec bins |
 |
 |
| Module-wise count rates for Quadrant D Data is divided into 100 sec bins |
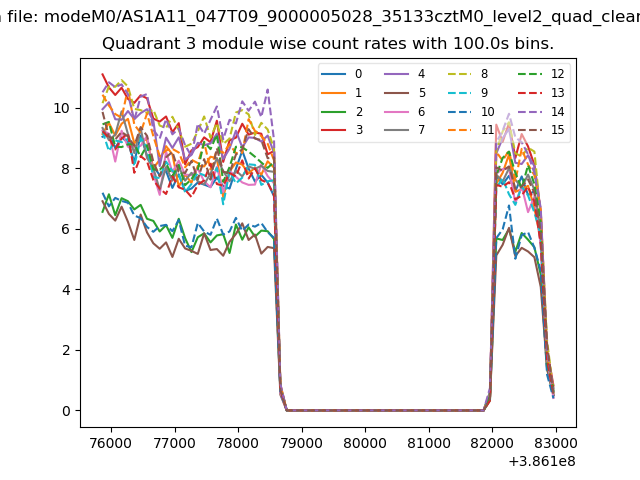 |
 |
| Parameter | Plot |
|---|---|
| CZT HV Monitor |  |
| D_VDD | 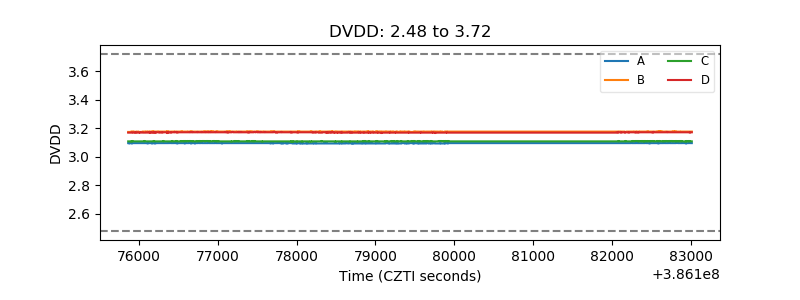 |
| Temperature 1 | 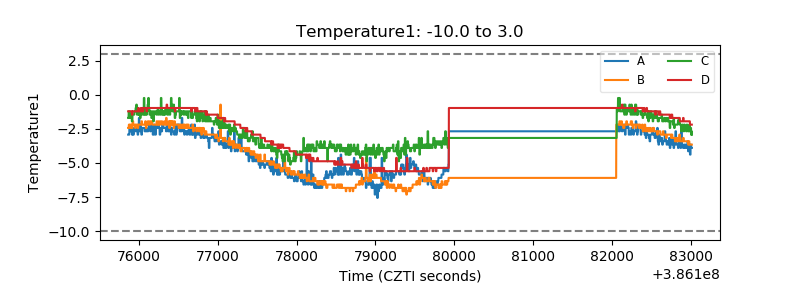 |
| Veto HV Monitor | 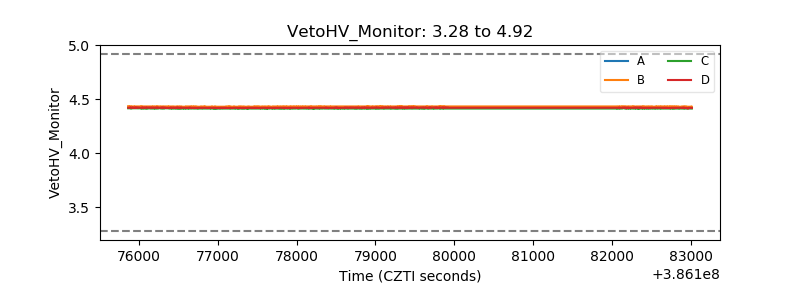 |
| Veto LLD | 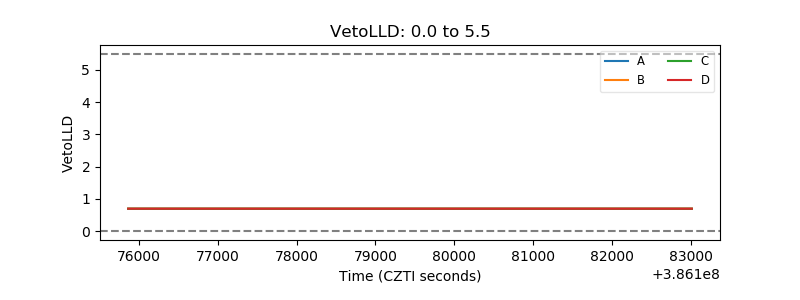 |
| Alpha Counter | 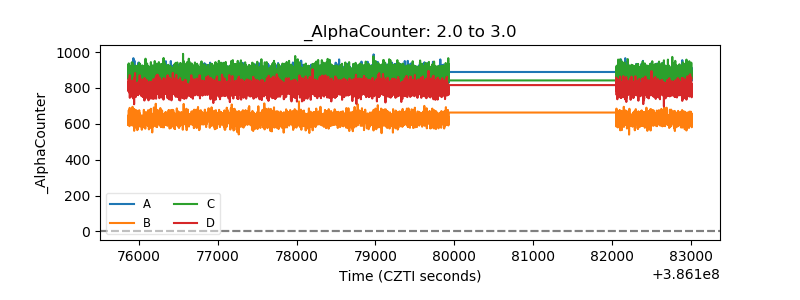 |
| _CPM_Rate | 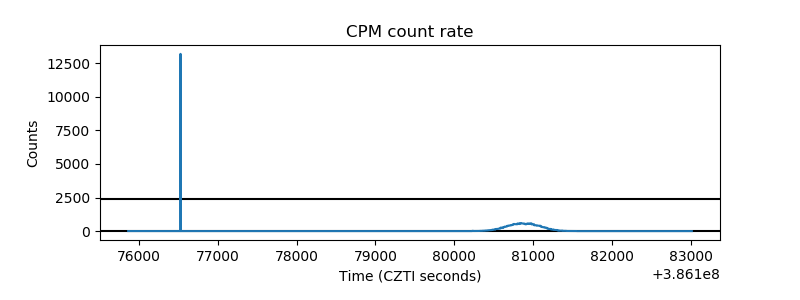 |
| CZT Counter | 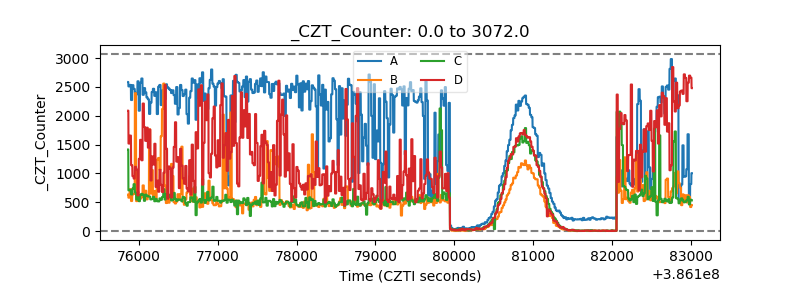 |
| +2.5 Volts monitor | 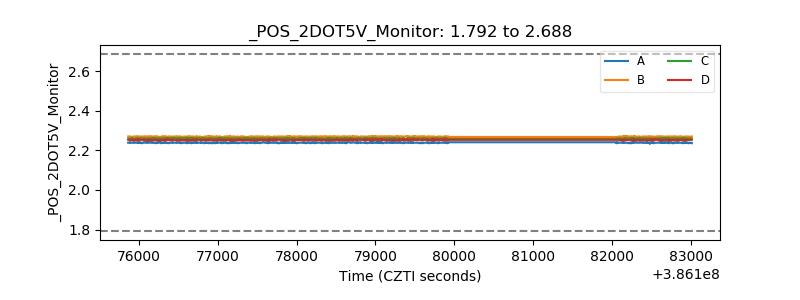 |
| +5 Volts monitor | 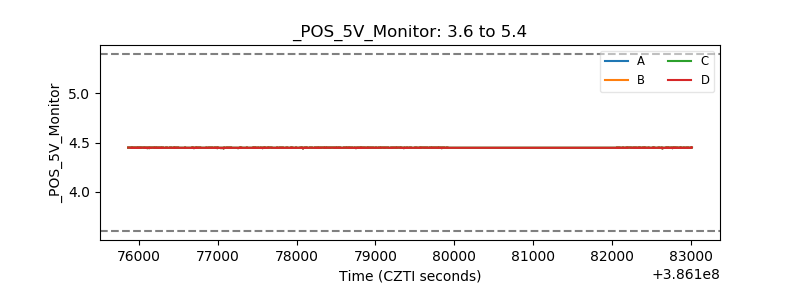 |
| _ROLL_ROT | 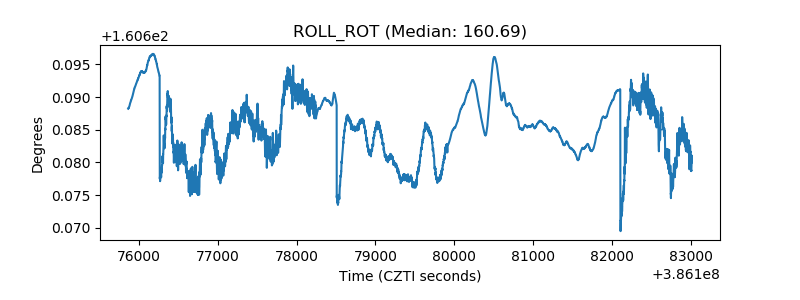 |
| _Roll_DEC | 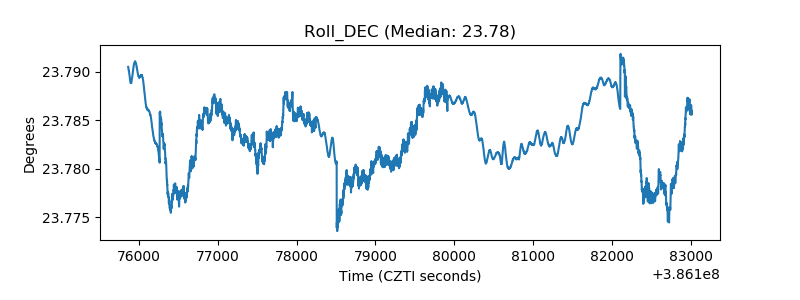 |
| _Roll_RA | 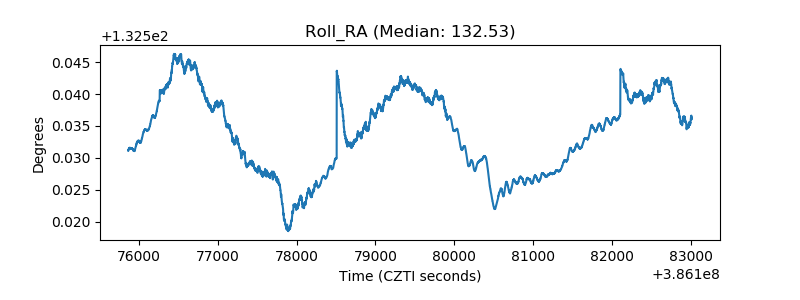 |
| Veto Counter | 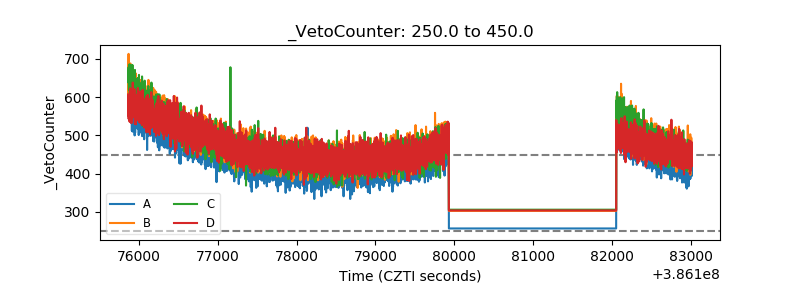 |