| Param | Original file | Final file |
|---|---|---|
| Filename | modeM0/AS1A11_047T09_9000005028_35131cztM0_level2.evt | modeM0/AS1A11_047T09_9000005028_35131cztM0_level2_quad_clean.evt |
| Size (bytes) | 689,587,200 | 102,651,840 |
| Size | 657.6 MB | 97.9 MB |
| Events in quadrant A | 7,092,326 | 635,472 |
| Events in quadrant B | 3,906,254 | 729,488 |
| Events in quadrant C | 3,321,117 | 714,201 |
| Events in quadrant D | 6,205,515 | 655,772 |
| Mode SS | |||
|---|---|---|---|
| Quadrant | BADHDUFLAG | Total packets | Discarded packets |
| A | 0 | 110 | 0 |
| B | 0 | 110 | 0 |
| C | 0 | 110 | 0 |
| D | 0 | 110 | 0 |
| Mode M9 | |||
|---|---|---|---|
| Quadrant | BADHDUFLAG | Total packets | Discarded packets |
| A | 0 | 29 | 0 |
| B | 0 | 29 | 0 |
| C | 0 | 29 | 0 |
| D | 0 | 30 | 0 |
| Mode M0 | |||
|---|---|---|---|
| Quadrant | BADHDUFLAG | Total packets | Discarded packets |
| A | 0 | 24748 | 3 |
| B | 0 | 15091 | 2 |
| C | 0 | 13148 | 2 |
| D | 0 | 22250 | 2 |
| Quadrant | Total seconds | Saturated seconds | Saturation percentage |
|---|---|---|---|
| A | 5322 | 1647 | 30.947012% |
| B | 5322 | 249 | 4.678692% |
| C | 5322 | 100 | 1.878993% |
| D | 5322 | 405 | 7.609921% |
Noise dominated data is calculated using 1-second bins in cleaned event files. If a bin has >2000 counts, and if more than 50% of those come from <1% of pixels, then it is considered to be noise-dominated and hence unusable.
| Quadrant | # 1 sec bins | Bins with >0 counts | Bins with >2000 counts | High rate bins dominated by noise | Noise dominated (total time) | Noise dominated (detector-on time) | Marked lightcurve |
|---|---|---|---|---|---|---|---|
| A | 7385 | 5323 | 1169 | 1169 | 15.83% | 21.96% | 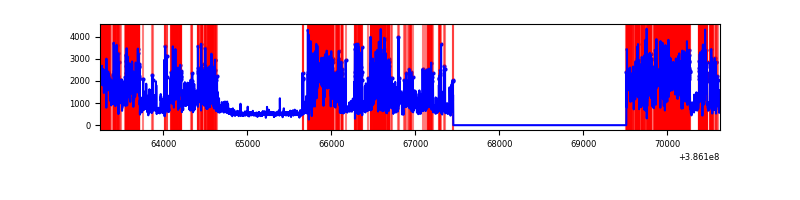 |
| B | 7385 | 5323 | 164 | 164 | 2.22% | 3.08% | 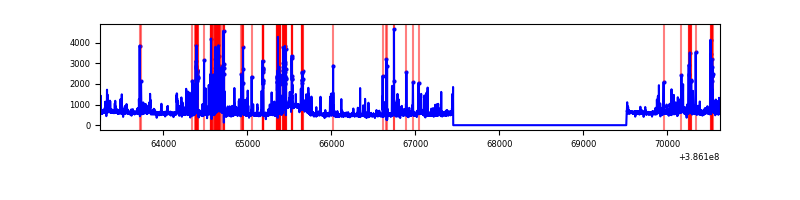 |
| C | 7385 | 5323 | 65 | 65 | 0.88% | 1.22% | 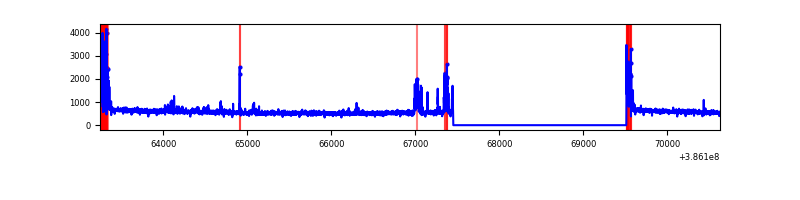 |
| D | 7385 | 5323 | 402 | 402 | 5.44% | 7.55% | 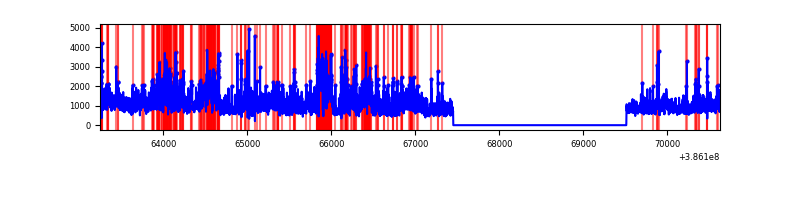 |
Top three noisy pixels from each quadrant. If the there are fewer than three noisy pixels in the level2.evt file, extra rows are filled as -1
| Pixel properties | Quadrant properties | ||||||
|---|---|---|---|---|---|---|---|
| Quadrant | DetID | PixID | Counts | Sigma | Mean | Median | Sigma |
| A | 15 | 169 | 4572287 | 36877.99 | 630 | 622 | 124.0 |
| A | 10 | 83 | 61969 | 494.86 | 630 | 622 | 124.0 |
| A | 12 | 16 | 14229 | 109.76 | 630 | 622 | 124.0 |
| B | 5 | 172 | 722765 | 5554.11 | 693 | 678 | 130.0 |
| B | 0 | 190 | 125415 | 959.45 | 693 | 678 | 130.0 |
| B | 0 | 182 | 104262 | 796.74 | 693 | 678 | 130.0 |
| C | 0 | 10 | 257783 | 1653.76 | 679 | 686 | 155.5 |
| C | 15 | 214 | 225805 | 1448.07 | 679 | 686 | 155.5 |
| C | 1 | 23 | 104821 | 669.84 | 679 | 686 | 155.5 |
| D | 8 | 195 | 2215619 | 13385.51 | 683 | 666 | 165.5 |
| D | 2 | 250 | 320021 | 1929.94 | 683 | 666 | 165.5 |
| D | 10 | 118 | 288264 | 1738.03 | 683 | 666 | 165.5 |
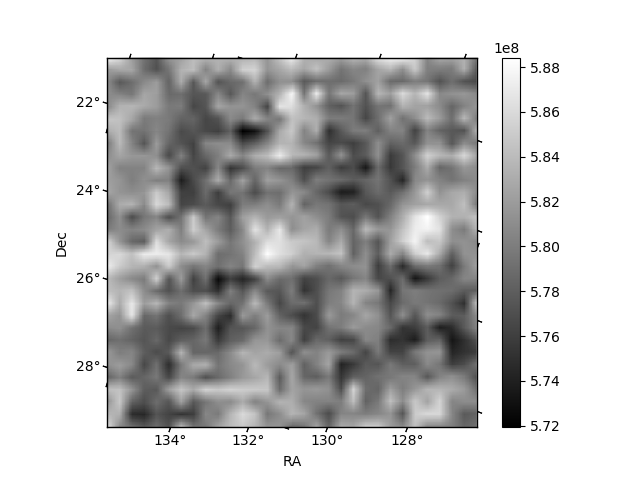
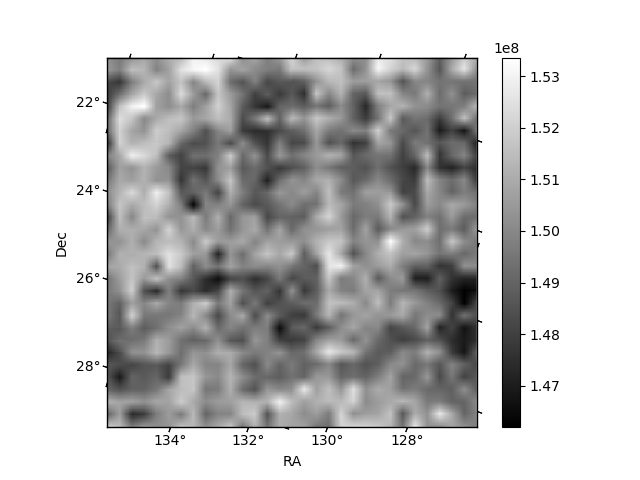
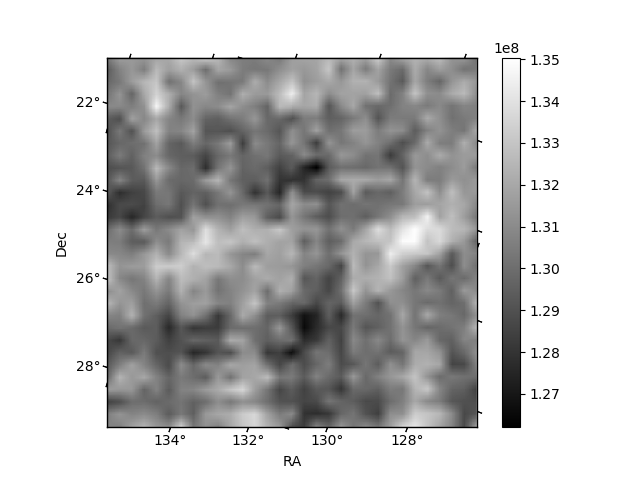
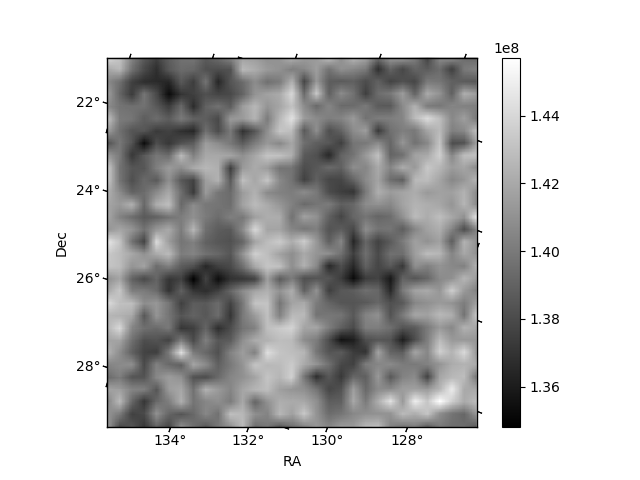
Histogram calculated using DETX and DETY for each event in the final _common_clean file
| Quadrant A | 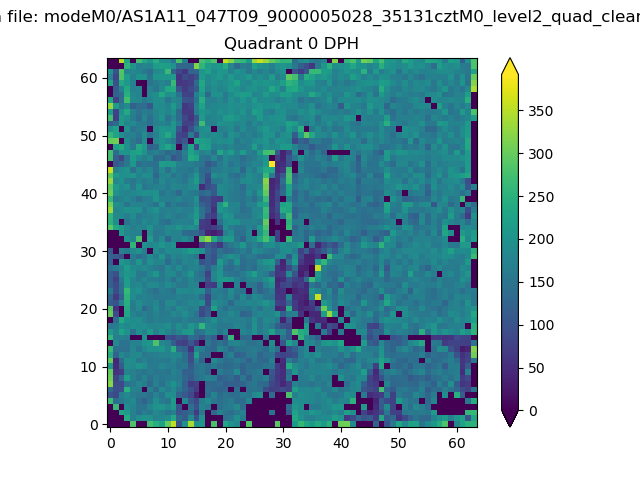 |
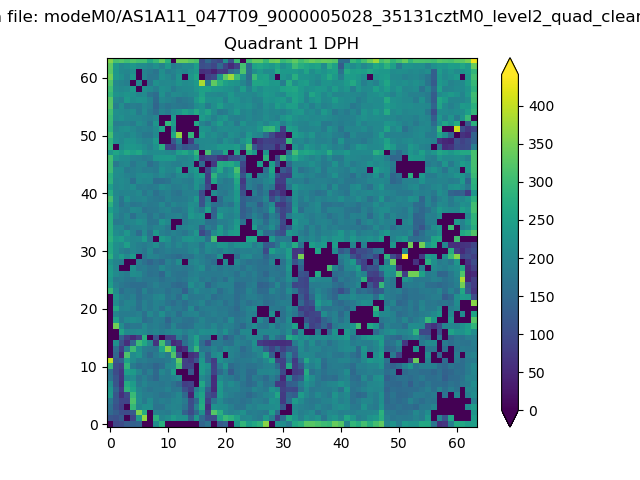 |
Quadrant B |
|---|---|---|---|
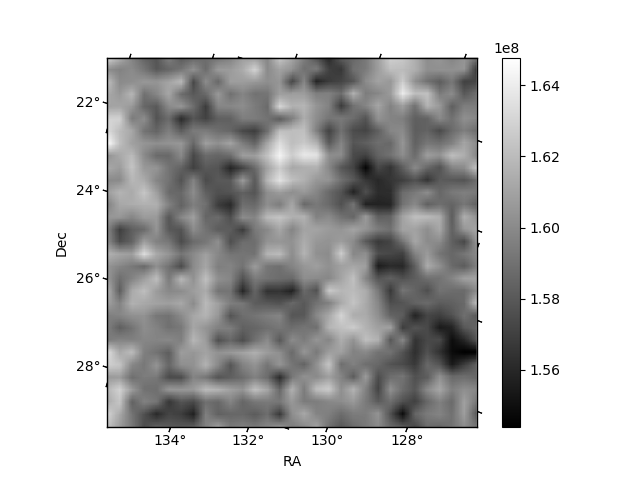
| Quadrant D | 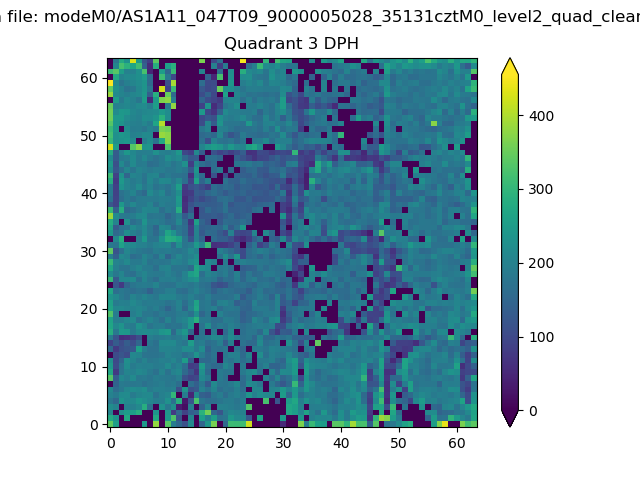 |
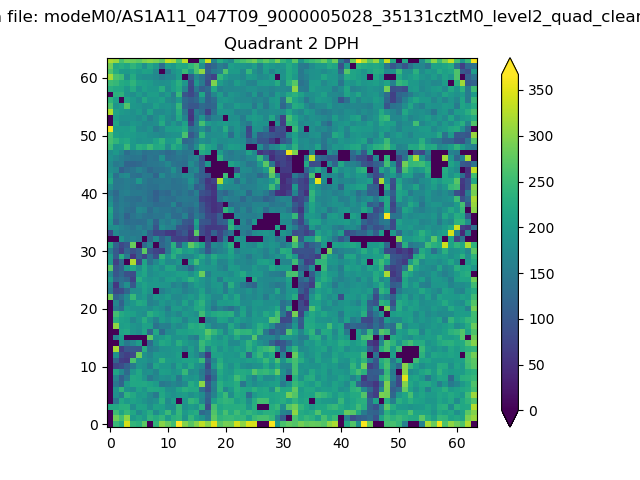 |
Quadrant C |
| Plot type | Count rate plots | Images |
|---|---|---|
| Comparison with Poisson distribution Blue bars denote a histogram of data divided into 1 sec bins. Red curve is a Poisson curve with rate = median count rate of data. |
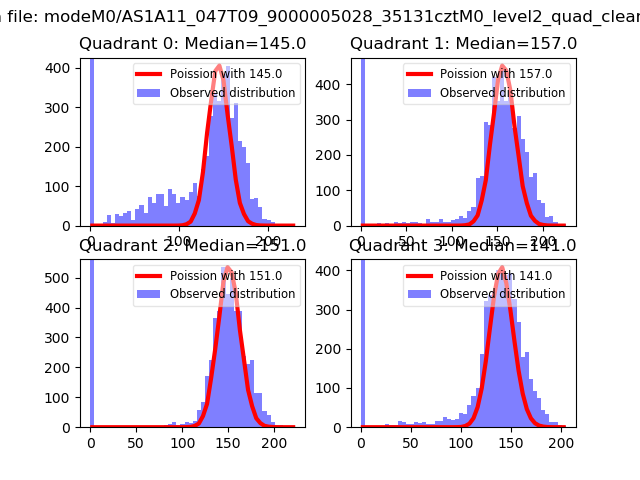 |
 |
| Quadrant-wise count rates Data is divided into 100 sec bins |
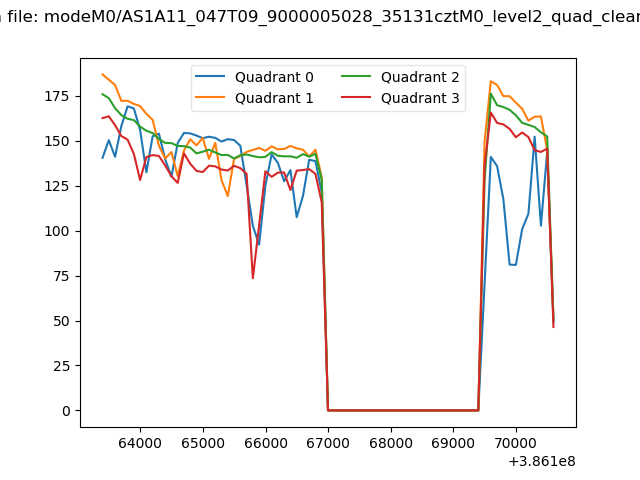 |
|
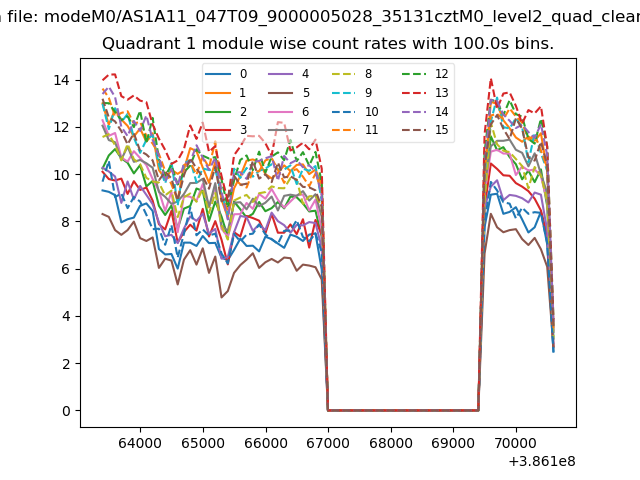
| Module-wise count rates for Quadrant A Data is divided into 100 sec bins |
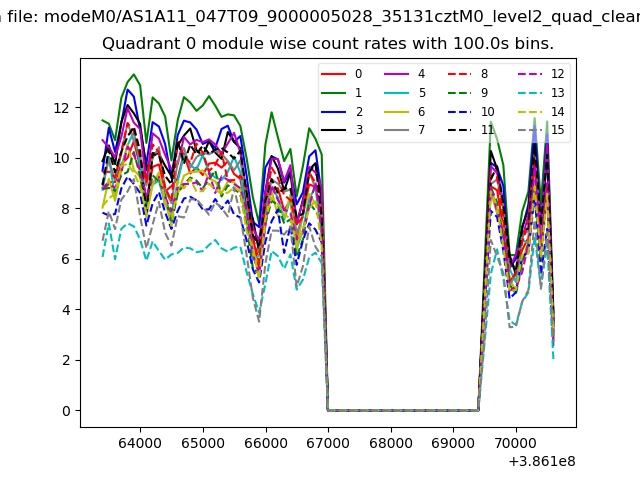 |
 |
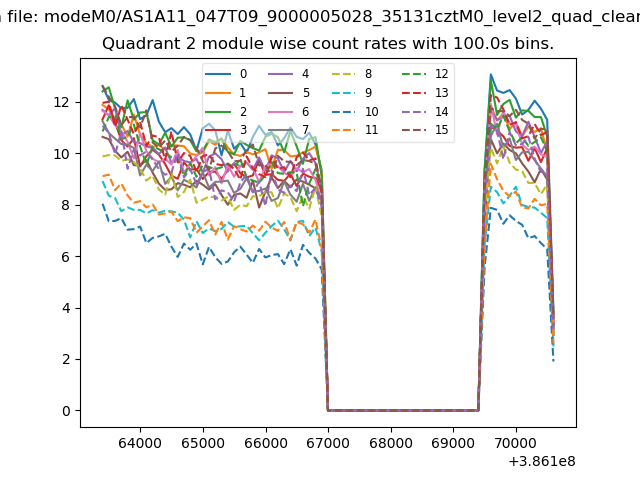
| Module-wise count rates for Quadrant B Data is divided into 100 sec bins |
 |
 |
| Module-wise count rates for Quadrant C Data is divided into 100 sec bins |
 |
 |
| Module-wise count rates for Quadrant D Data is divided into 100 sec bins |
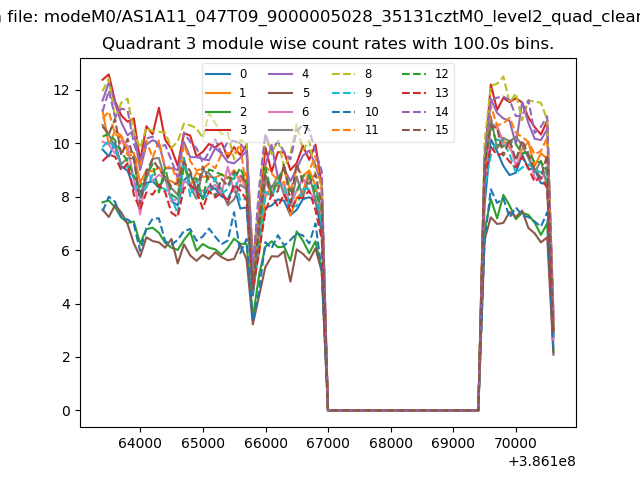 |
 |
| Parameter | Plot |
|---|---|
| CZT HV Monitor | 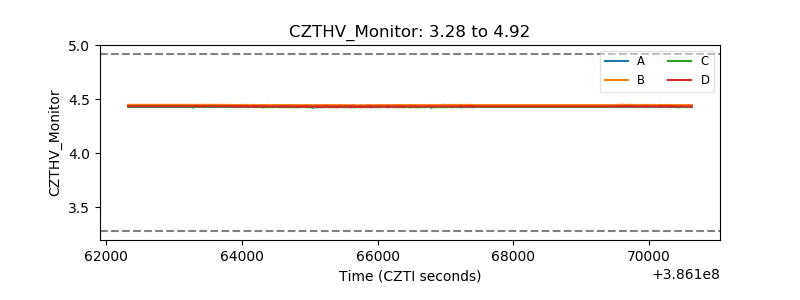 |
| D_VDD | 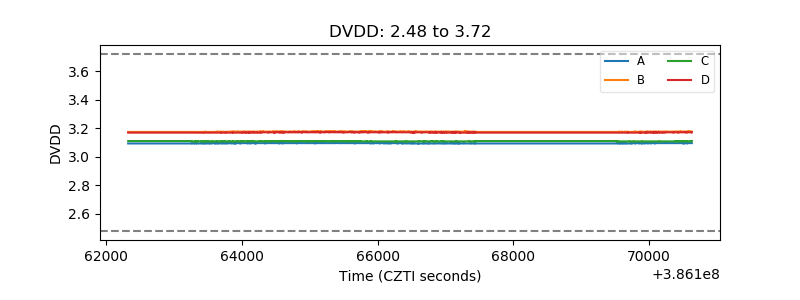 |
| Temperature 1 | 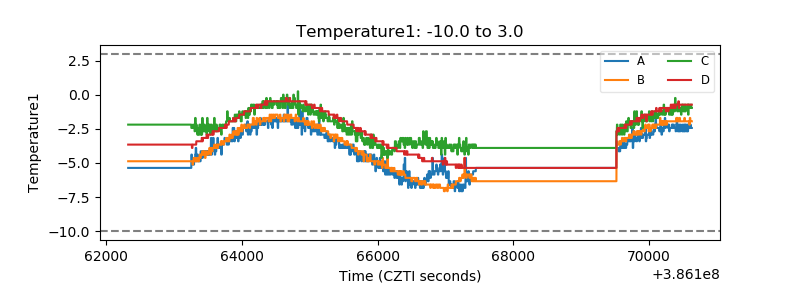 |
| Veto HV Monitor | 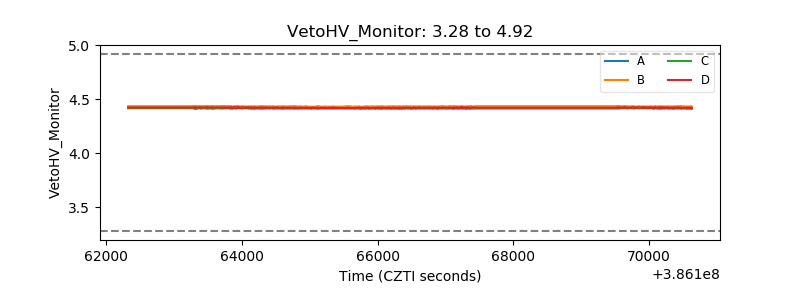 |
| Veto LLD |  |
| Alpha Counter | 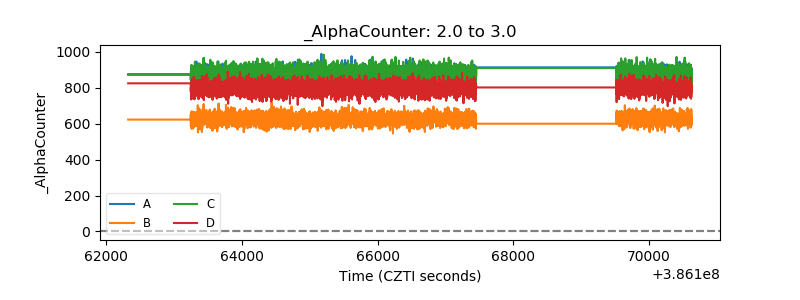 |
| _CPM_Rate | 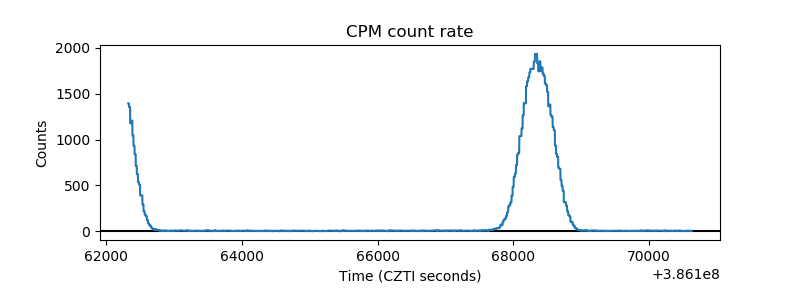 |
| CZT Counter | 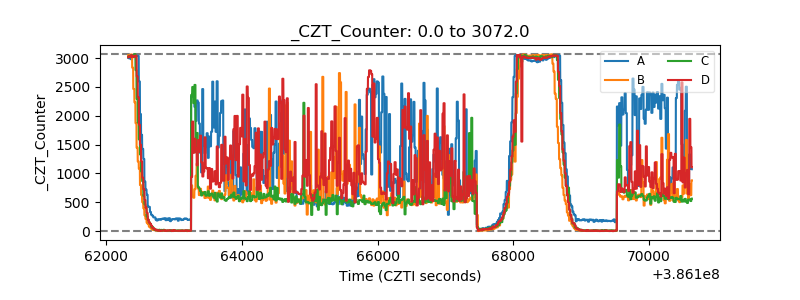 |
| +2.5 Volts monitor | 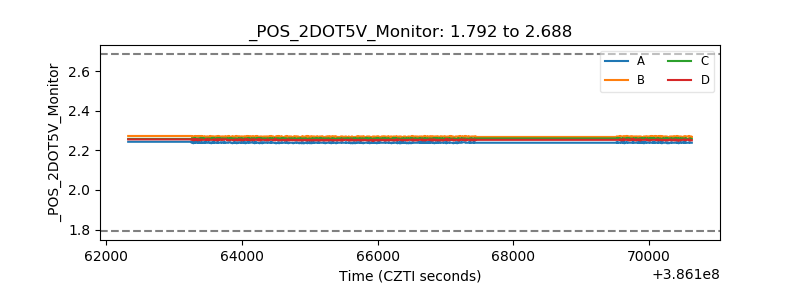 |
| +5 Volts monitor | 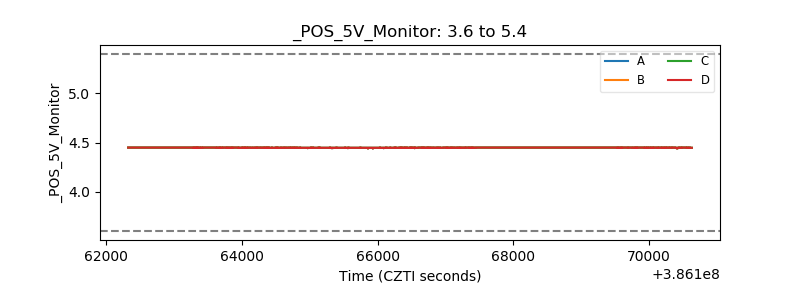 |
| _ROLL_ROT | 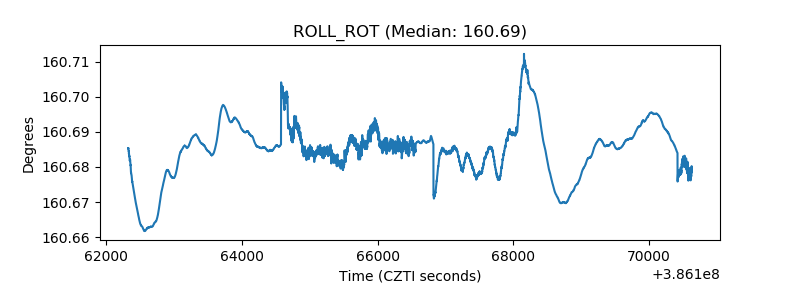 |
| _Roll_DEC | 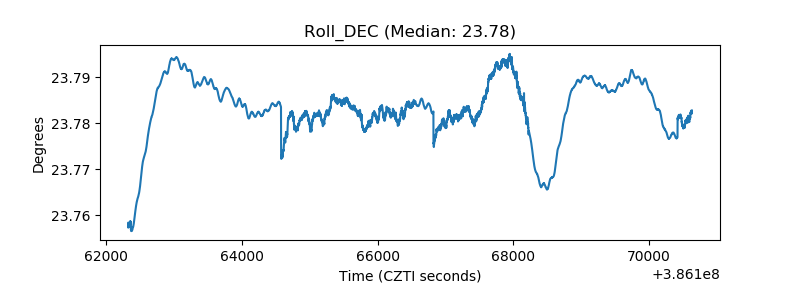 |
| _Roll_RA | 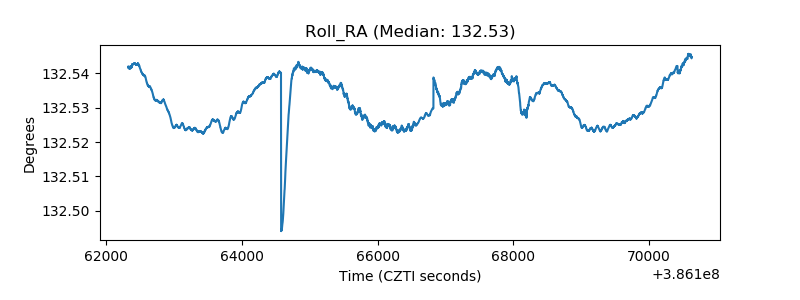 |
| Veto Counter | 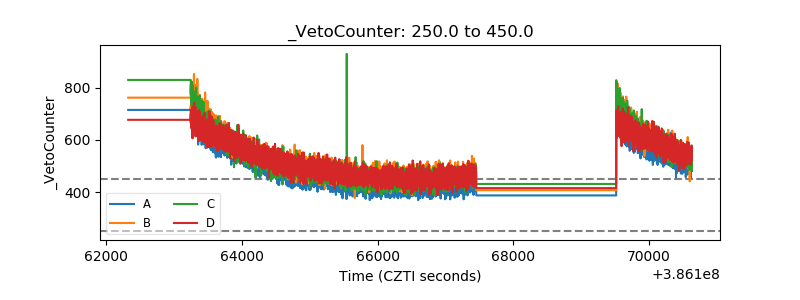 |