| Param | Original file | Final file |
|---|---|---|
| Filename | modeM0/AS1A11_047T09_9000005028_35130cztM0_level2.evt | modeM0/AS1A11_047T09_9000005028_35130cztM0_level2_quad_clean.evt |
| Size (bytes) | 560,612,160 | 92,880,000 |
| Size | 534.6 MB | 88.6 MB |
| Events in quadrant A | 3,782,141 | 628,358 |
| Events in quadrant B | 3,581,915 | 637,577 |
| Events in quadrant C | 3,096,764 | 619,277 |
| Events in quadrant D | 6,168,349 | 565,376 |
| Mode SS | |||
|---|---|---|---|
| Quadrant | BADHDUFLAG | Total packets | Discarded packets |
| A | 0 | 104 | 0 |
| B | 0 | 104 | 0 |
| C | 0 | 104 | 0 |
| D | 0 | 104 | 0 |
| Mode M9 | |||
|---|---|---|---|
| Quadrant | BADHDUFLAG | Total packets | Discarded packets |
| A | 0 | 33 | 0 |
| B | 0 | 33 | 0 |
| C | 0 | 33 | 0 |
| D | 0 | 34 | 0 |
| Mode M0 | |||
|---|---|---|---|
| Quadrant | BADHDUFLAG | Total packets | Discarded packets |
| A | 0 | 14404 | 3 |
| B | 0 | 14096 | 2 |
| C | 0 | 12297 | 2 |
| D | 0 | 22048 | 2 |
| Quadrant | Total seconds | Saturated seconds | Saturation percentage |
|---|---|---|---|
| A | 5173 | 331 | 6.398608% |
| B | 5173 | 156 | 3.015658% |
| C | 5173 | 113 | 2.184419% |
| D | 5173 | 364 | 7.036536% |
Noise dominated data is calculated using 1-second bins in cleaned event files. If a bin has >2000 counts, and if more than 50% of those come from <1% of pixels, then it is considered to be noise-dominated and hence unusable.
| Quadrant | # 1 sec bins | Bins with >0 counts | Bins with >2000 counts | High rate bins dominated by noise | Noise dominated (total time) | Noise dominated (detector-on time) | Marked lightcurve |
|---|---|---|---|---|---|---|---|
| A | 7116 | 5174 | 207 | 207 | 2.91% | 4.00% |  |
| B | 7116 | 5174 | 89 | 89 | 1.25% | 1.72% | 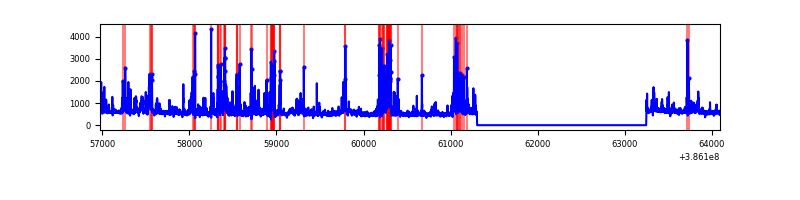 |
| C | 7116 | 5174 | 64 | 64 | 0.90% | 1.24% |  |
| D | 7116 | 5174 | 383 | 383 | 5.38% | 7.40% | 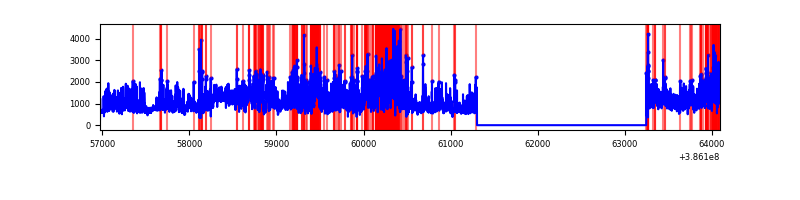 |
Top three noisy pixels from each quadrant. If the there are fewer than three noisy pixels in the level2.evt file, extra rows are filled as -1
| Pixel properties | Quadrant properties | ||||||
|---|---|---|---|---|---|---|---|
| Quadrant | DetID | PixID | Counts | Sigma | Mean | Median | Sigma |
| A | 15 | 169 | 1063004 | 7994.9 | 670 | 661 | 132.9 |
| A | 10 | 83 | 76778 | 572.84 | 670 | 661 | 132.9 |
| A | 12 | 16 | 34962 | 258.14 | 670 | 661 | 132.9 |
| B | 5 | 172 | 546363 | 4270.21 | 672 | 657 | 127.8 |
| B | 0 | 190 | 128216 | 998.16 | 672 | 657 | 127.8 |
| B | 0 | 189 | 104899 | 815.71 | 672 | 657 | 127.8 |
| C | 0 | 10 | 277424 | 1855.25 | 650 | 656 | 149.2 |
| C | 15 | 214 | 219584 | 1467.53 | 650 | 656 | 149.2 |
| C | 0 | 207 | 39319 | 259.17 | 650 | 656 | 149.2 |
| D | 8 | 195 | 2451477 | 15350.48 | 655 | 638 | 159.7 |
| D | 7 | 223 | 332857 | 2080.81 | 655 | 638 | 159.7 |
| D | 13 | 249 | 288752 | 1804.56 | 655 | 638 | 159.7 |
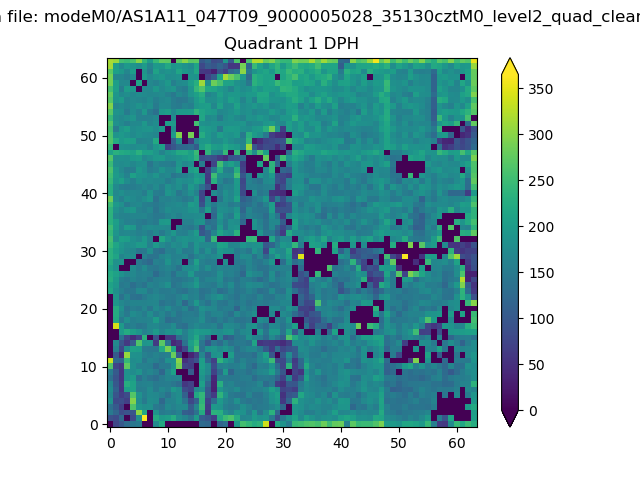
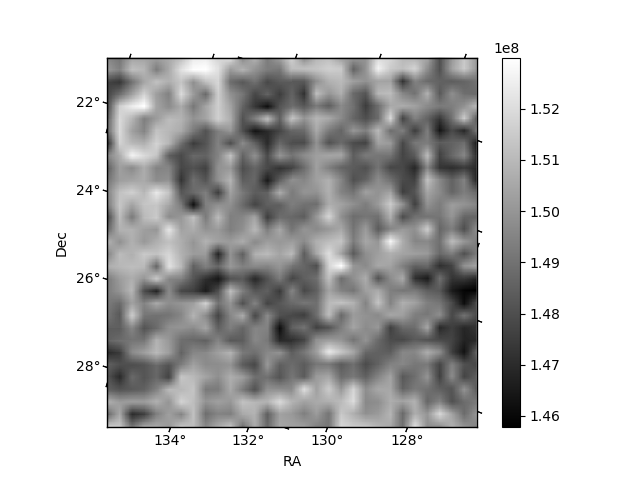
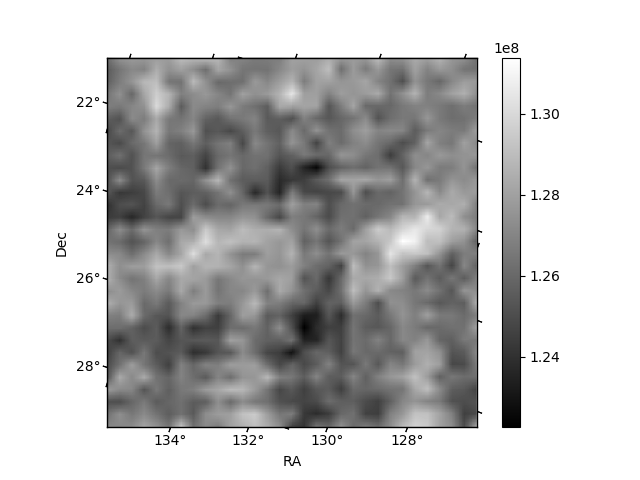
Histogram calculated using DETX and DETY for each event in the final _common_clean file
| Quadrant A |  |
 |
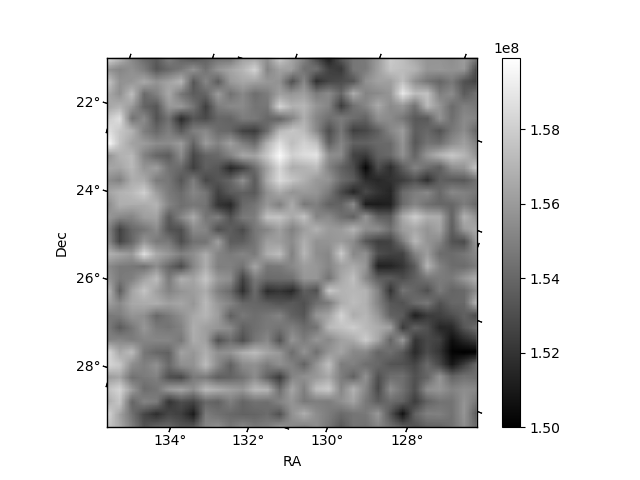
Quadrant B |
|---|---|---|---|
| Quadrant D | 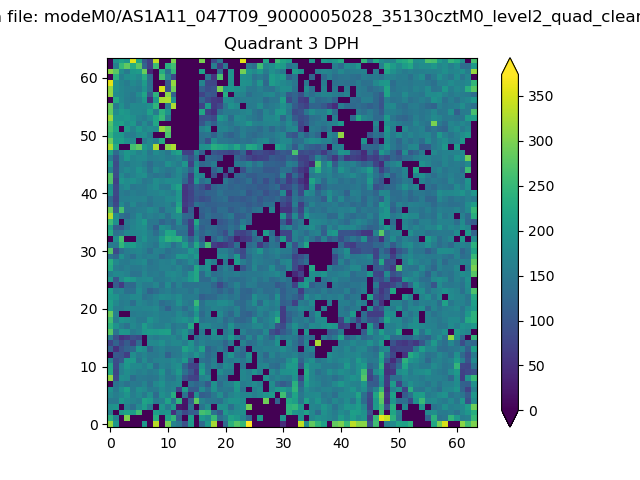 |
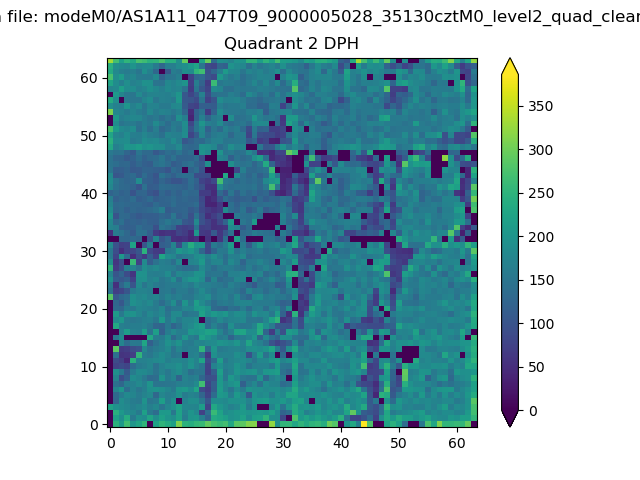 |
Quadrant C |
| Plot type | Count rate plots | Images |
|---|---|---|
| Comparison with Poisson distribution Blue bars denote a histogram of data divided into 1 sec bins. Red curve is a Poisson curve with rate = median count rate of data. |
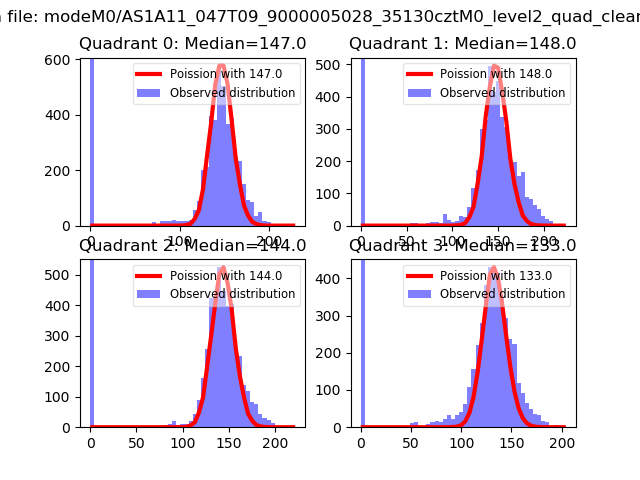 |
 |
| Quadrant-wise count rates Data is divided into 100 sec bins |
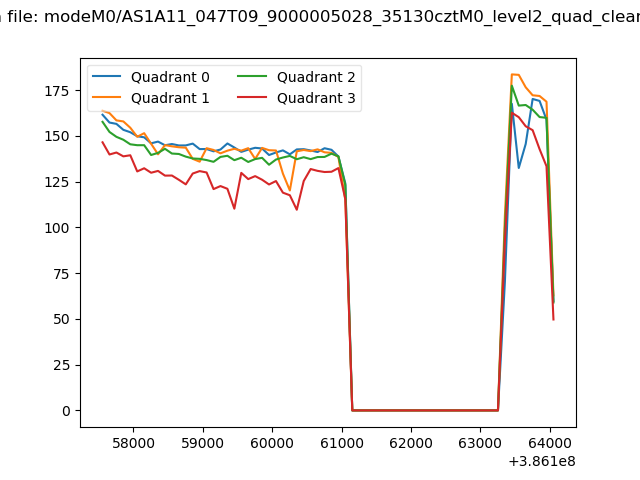 |
|
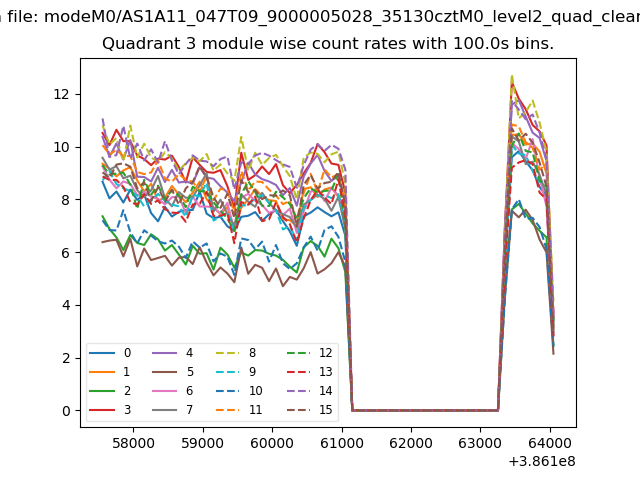
| Module-wise count rates for Quadrant A Data is divided into 100 sec bins |
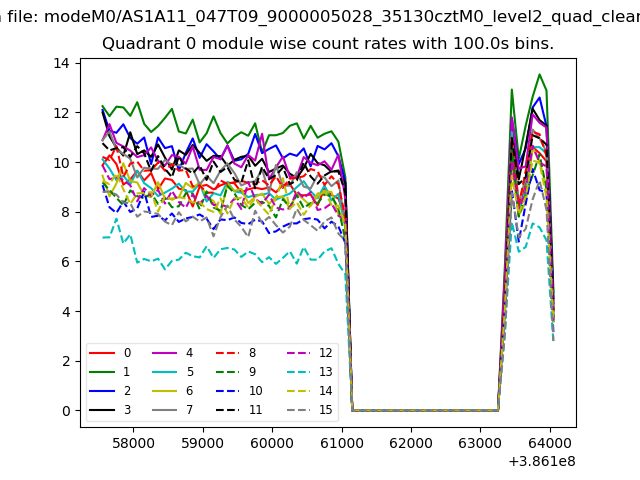 |
 |
| Module-wise count rates for Quadrant B Data is divided into 100 sec bins |
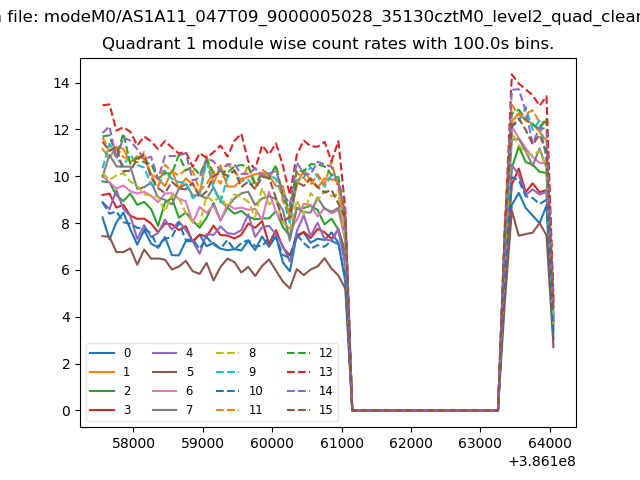 |
 |
| Module-wise count rates for Quadrant C Data is divided into 100 sec bins |
 |
 |
| Module-wise count rates for Quadrant D Data is divided into 100 sec bins |
 |
 |
| Parameter | Plot |
|---|---|
| CZT HV Monitor | 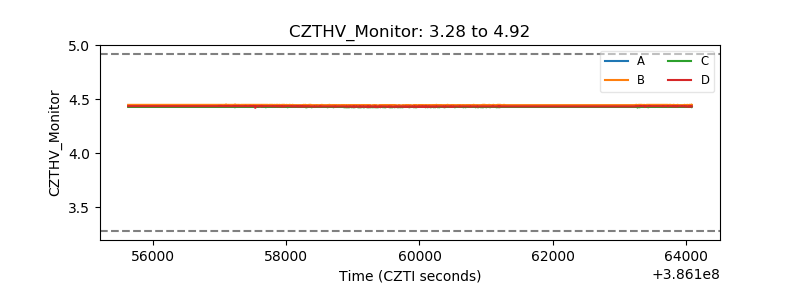 |
| D_VDD | 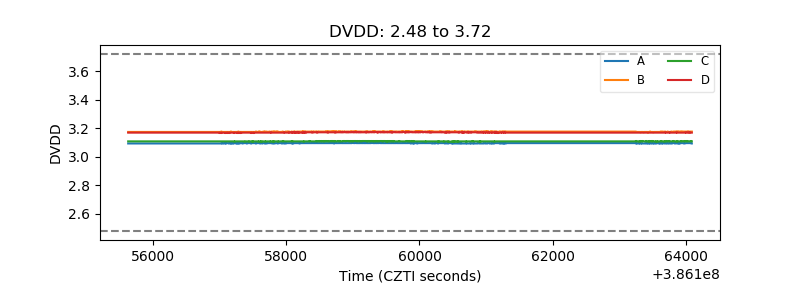 |
| Temperature 1 | 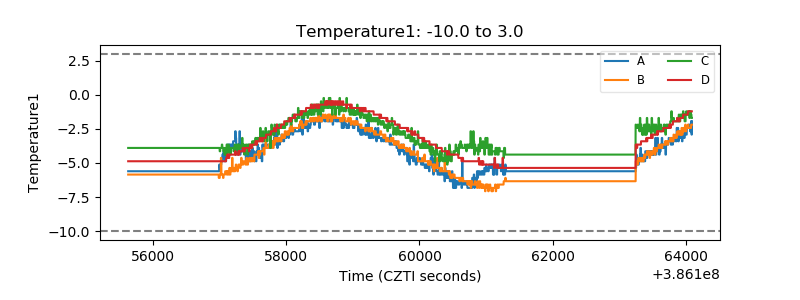 |
| Veto HV Monitor | 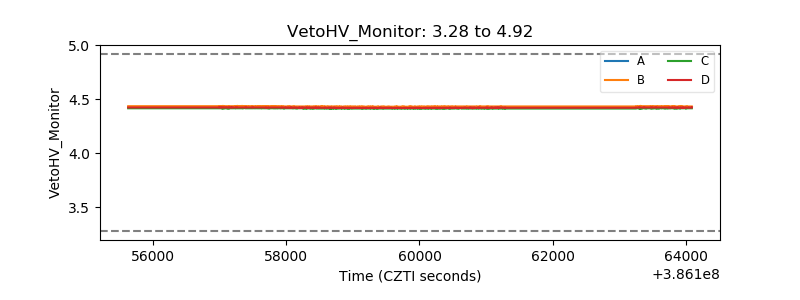 |
| Veto LLD | 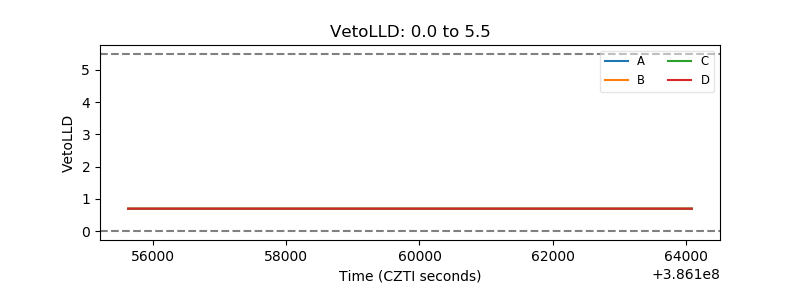 |
| Alpha Counter | 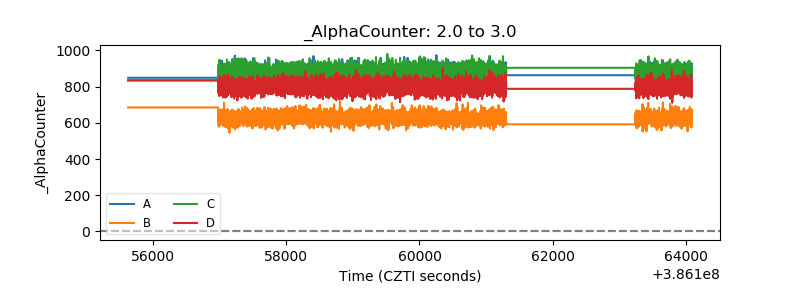 |
| _CPM_Rate | 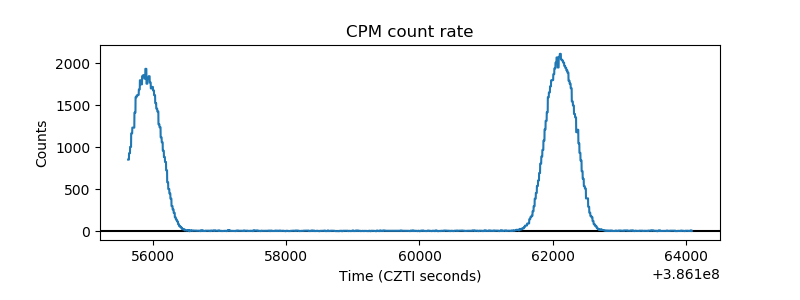 |
| CZT Counter | 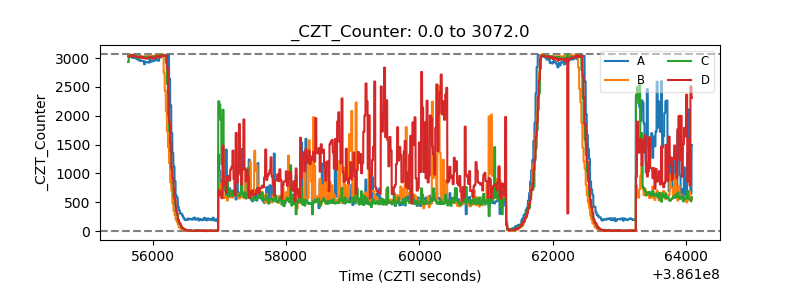 |
| +2.5 Volts monitor | 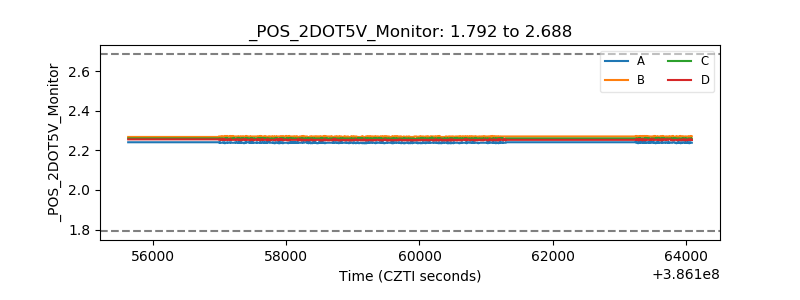 |
| +5 Volts monitor | 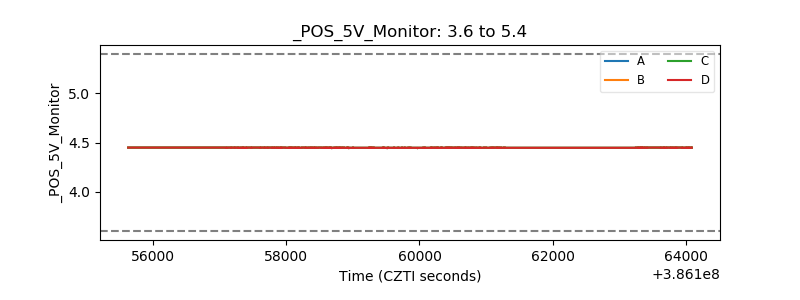 |
| _ROLL_ROT | 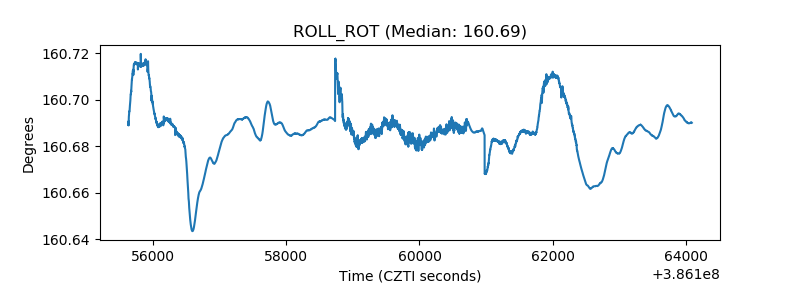 |
| _Roll_DEC | 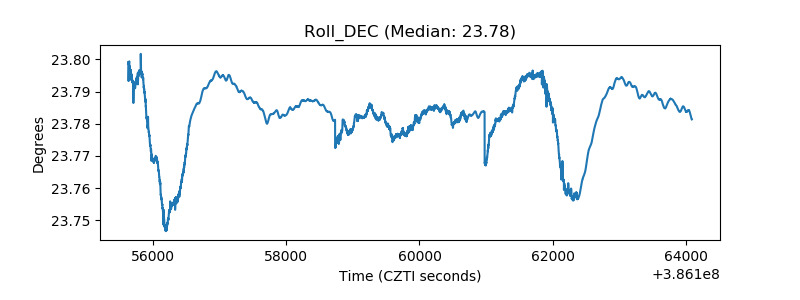 |
| _Roll_RA | 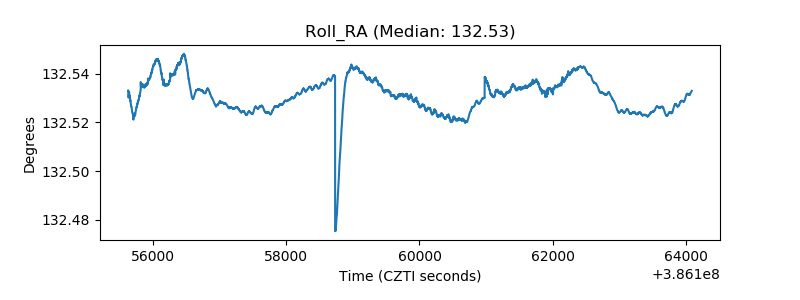 |
| Veto Counter | 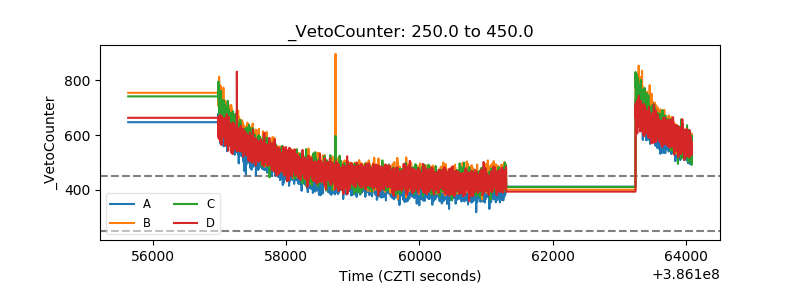 |