| Param | Original file | Final file |
|---|---|---|
| Filename | modeM0/AS1A11_047T09_9000005028_35126cztM0_level2.evt | modeM0/AS1A11_047T09_9000005028_35126cztM0_level2_quad_clean.evt |
| Size (bytes) | 901,586,880 | 58,962,240 |
| Size | 859.8 MB | 56.2 MB |
| Events in quadrant A | 12,801,336 | 165,047 |
| Events in quadrant B | 3,607,542 | 422,783 |
| Events in quadrant C | 3,307,837 | 418,736 |
| Events in quadrant D | 7,169,294 | 343,127 |
| Mode SS | |||
|---|---|---|---|
| Quadrant | BADHDUFLAG | Total packets | Discarded packets |
| A | 0 | 128 | 0 |
| B | 0 | 128 | 0 |
| C | 0 | 128 | 0 |
| D | 0 | 128 | 0 |
| Mode M9 | |||
|---|---|---|---|
| Quadrant | BADHDUFLAG | Total packets | Discarded packets |
| A | 0 | 30 | 0 |
| B | 0 | 30 | 0 |
| C | 0 | 30 | 0 |
| D | 0 | 30 | 0 |
| Mode M0 | |||
|---|---|---|---|
| Quadrant | BADHDUFLAG | Total packets | Discarded packets |
| A | 0 | 42198 | 3 |
| B | 0 | 14558 | 2 |
| C | 0 | 13261 | 2 |
| D | 0 | 25597 | 2 |
| Quadrant | Total seconds | Saturated seconds | Saturation percentage |
|---|---|---|---|
| A | 6210 | 4694 | 75.587762% |
| B | 6210 | 89 | 1.433172% |
| C | 6210 | 26 | 0.418680% |
| D | 6210 | 965 | 15.539452% |
Noise dominated data is calculated using 1-second bins in cleaned event files. If a bin has >2000 counts, and if more than 50% of those come from <1% of pixels, then it is considered to be noise-dominated and hence unusable.
| Quadrant | # 1 sec bins | Bins with >0 counts | Bins with >2000 counts | High rate bins dominated by noise | Noise dominated (total time) | Noise dominated (detector-on time) | Marked lightcurve |
|---|---|---|---|---|---|---|---|
| A | 9195 | 6212 | 3934 | 3934 | 42.78% | 63.33% | 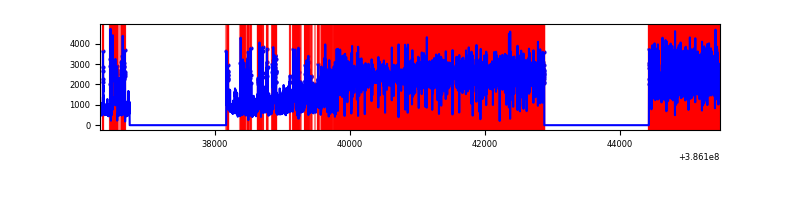 |
| B | 9195 | 6212 | 45 | 45 | 0.49% | 0.72% | 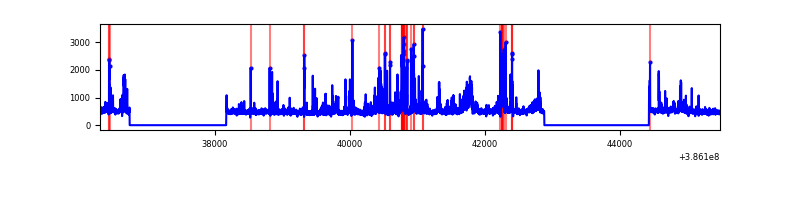 |
| C | 9195 | 6212 | 15 | 15 | 0.16% | 0.24% | 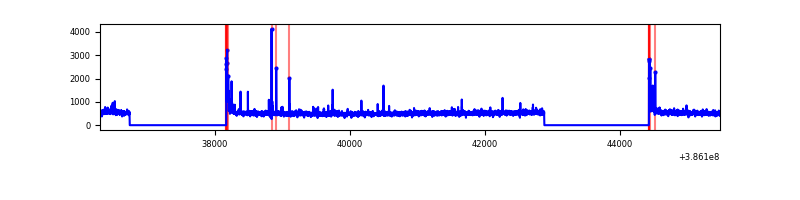 |
| D | 9195 | 6212 | 852 | 852 | 9.27% | 13.72% | 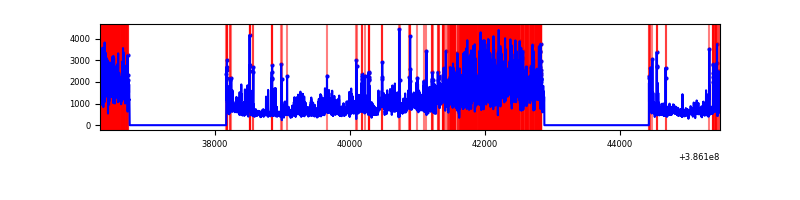 |
Top three noisy pixels from each quadrant. If the there are fewer than three noisy pixels in the level2.evt file, extra rows are filled as -1
| Pixel properties | Quadrant properties | ||||||
|---|---|---|---|---|---|---|---|
| Quadrant | DetID | PixID | Counts | Sigma | Mean | Median | Sigma |
| A | 15 | 169 | 11033927 | 130086.63 | 420 | 411 | 84.8 |
| A | 10 | 83 | 63642 | 745.5 | 420 | 411 | 84.8 |
| A | 9 | 143 | 42546 | 496.78 | 420 | 411 | 84.8 |
| B | 5 | 172 | 531231 | 3731.87 | 735 | 715 | 142.2 |
| B | 0 | 190 | 113114 | 790.66 | 735 | 715 | 142.2 |
| B | 0 | 189 | 24523 | 167.48 | 735 | 715 | 142.2 |
| C | 15 | 214 | 264853 | 1567.12 | 720 | 727 | 168.5 |
| C | 0 | 10 | 127472 | 752.01 | 720 | 727 | 168.5 |
| C | 14 | 67 | 58695 | 343.94 | 720 | 727 | 168.5 |
| D | 8 | 195 | 2154100 | 12944.82 | 679 | 658 | 166.4 |
| D | 2 | 250 | 969368 | 5823.13 | 679 | 658 | 166.4 |
| D | 10 | 118 | 463700 | 2783.45 | 679 | 658 | 166.4 |
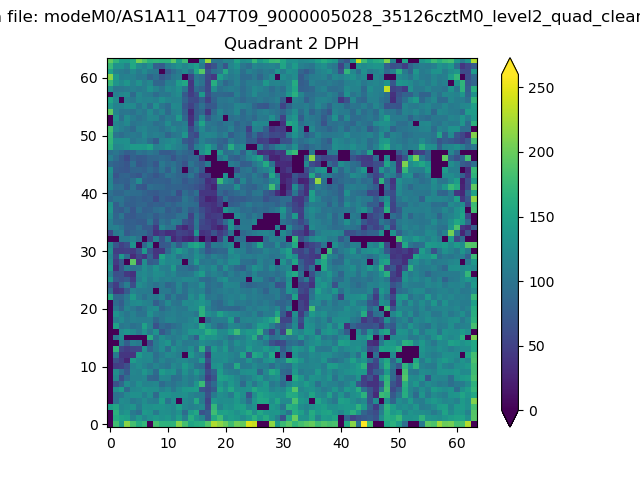
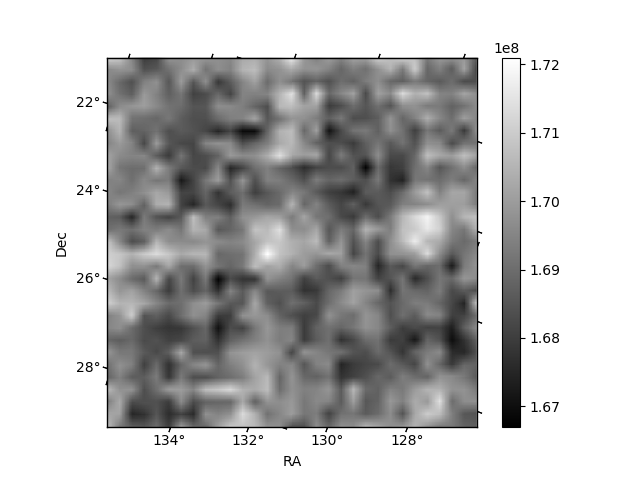
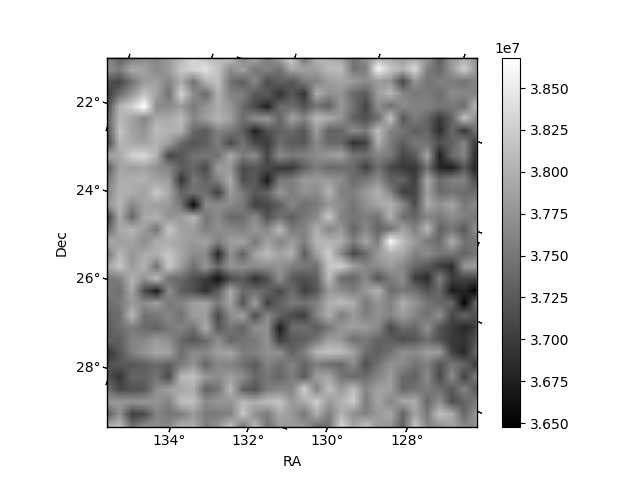
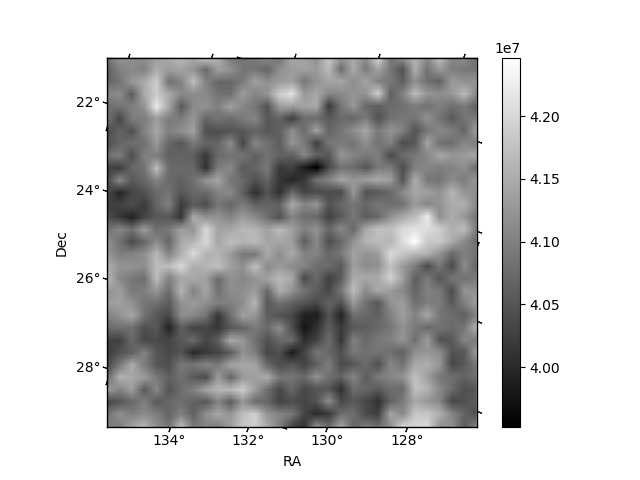
Histogram calculated using DETX and DETY for each event in the final _common_clean file
| Quadrant A | 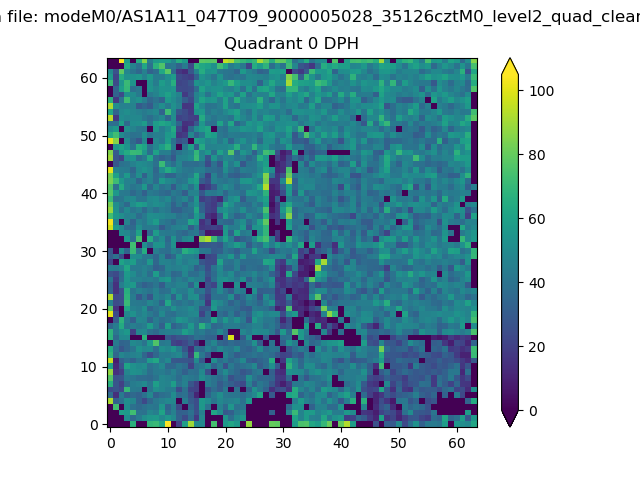 |
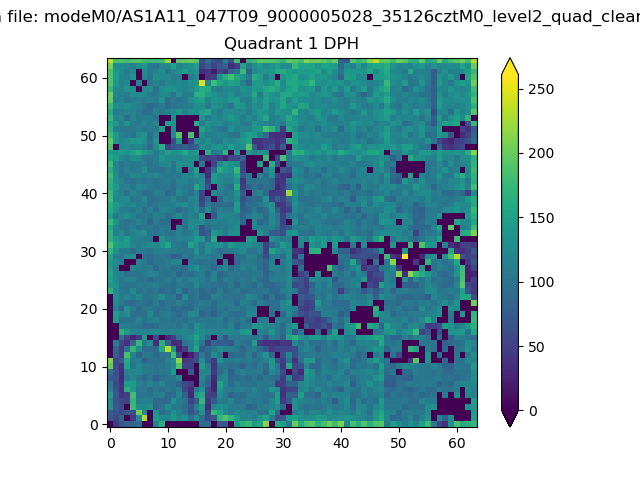 |
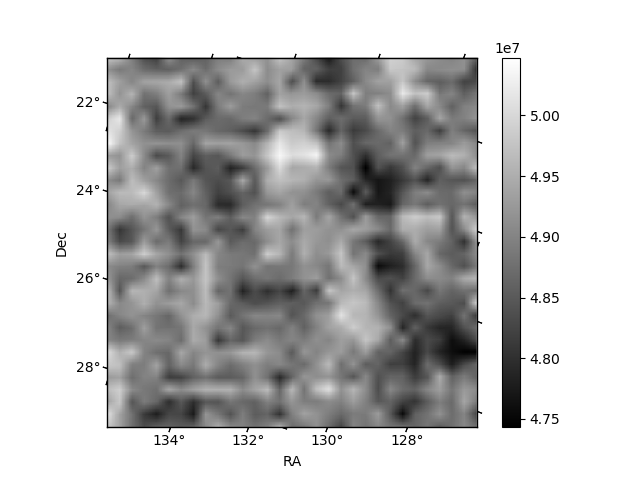
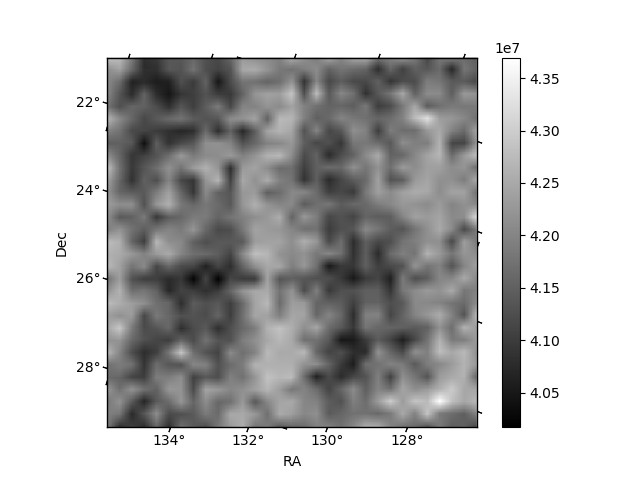
Quadrant B |
|---|---|---|---|
| Quadrant D | 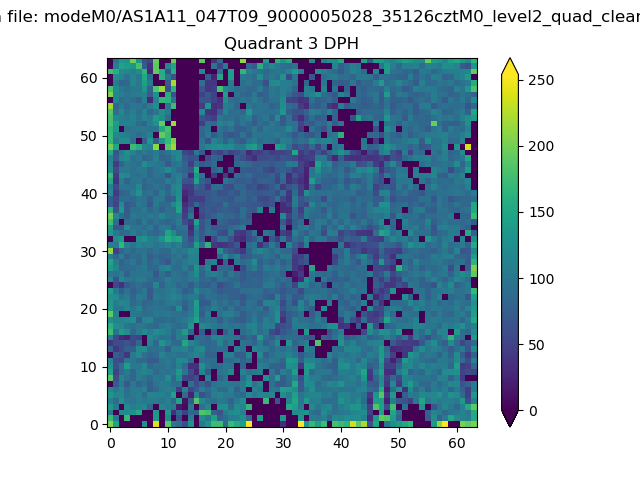 |
 |
Quadrant C |
| Plot type | Count rate plots | Images |
|---|---|---|
| Comparison with Poisson distribution Blue bars denote a histogram of data divided into 1 sec bins. Red curve is a Poisson curve with rate = median count rate of data. |
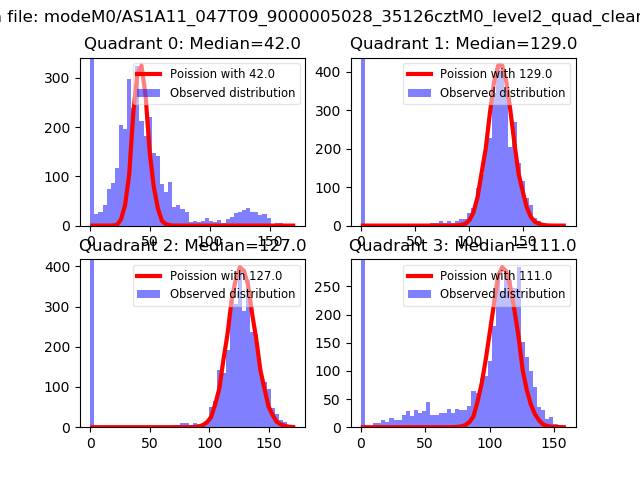 |
 |
| Quadrant-wise count rates Data is divided into 100 sec bins |
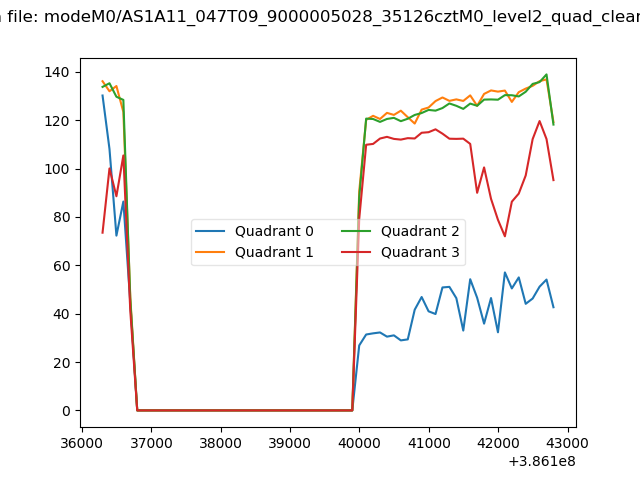 |
|
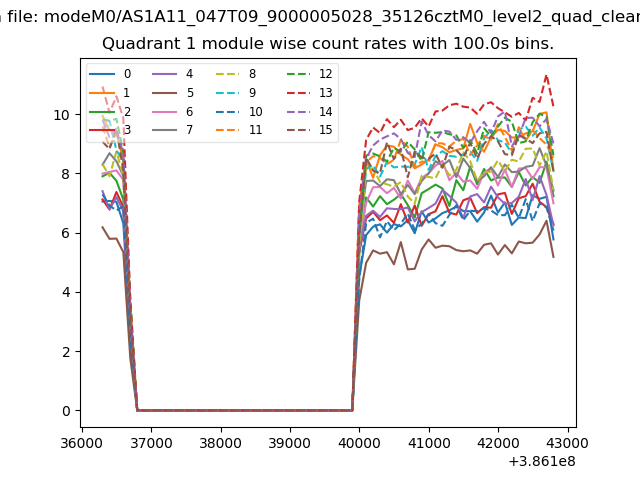
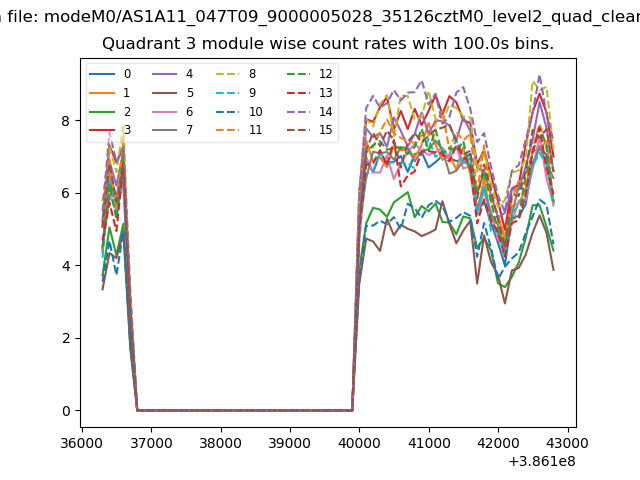
| Module-wise count rates for Quadrant A Data is divided into 100 sec bins |
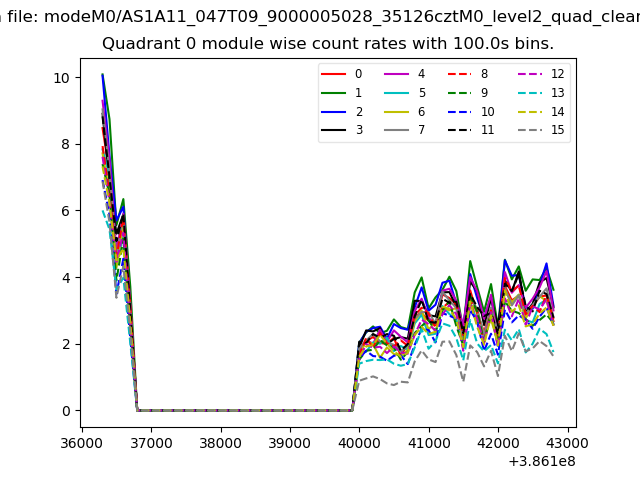 |
 |
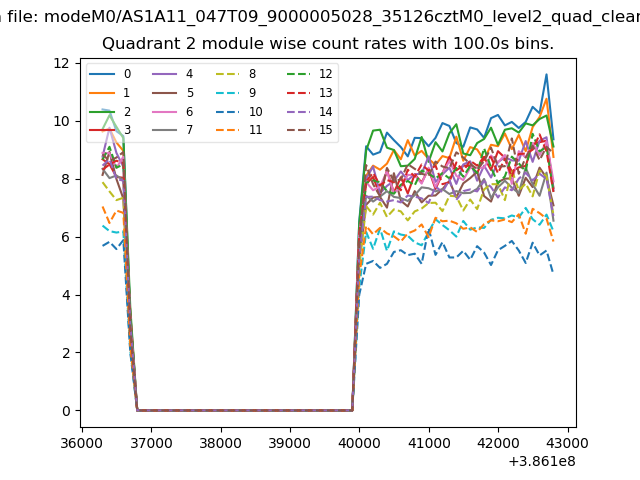
| Module-wise count rates for Quadrant B Data is divided into 100 sec bins |
 |
 |
| Module-wise count rates for Quadrant C Data is divided into 100 sec bins |
 |
 |
| Module-wise count rates for Quadrant D Data is divided into 100 sec bins |
 |
 |
| Parameter | Plot |
|---|---|
| CZT HV Monitor | 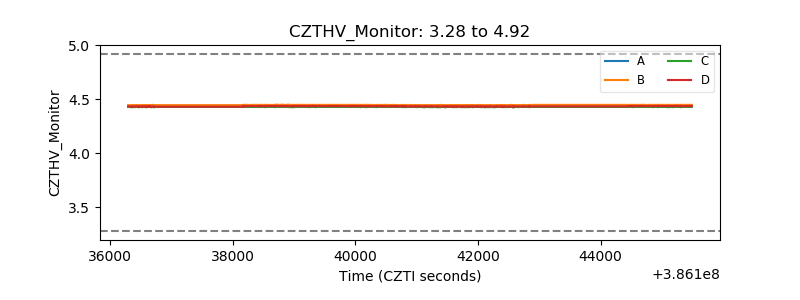 |
| D_VDD | 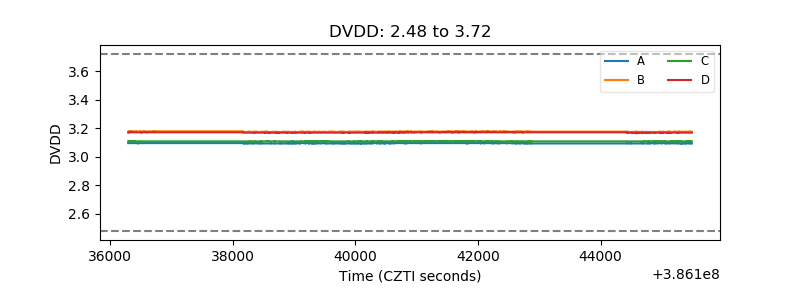 |
| Temperature 1 | 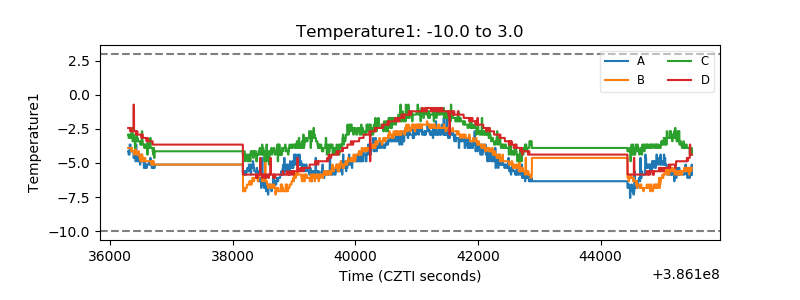 |
| Veto HV Monitor | 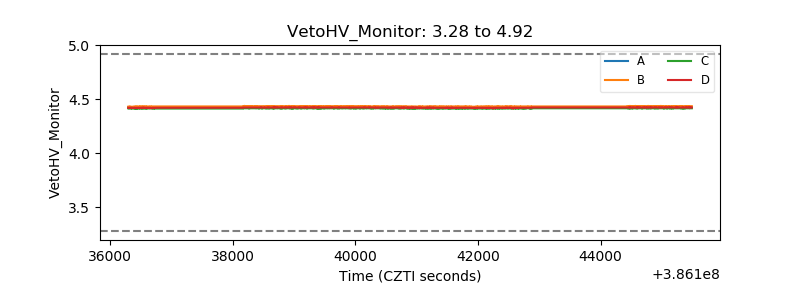 |
| Veto LLD | 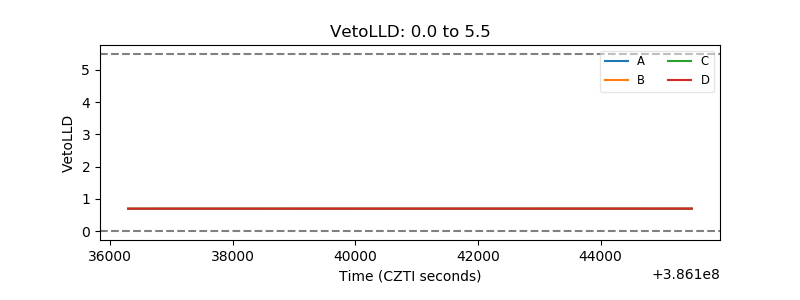 |
| Alpha Counter | 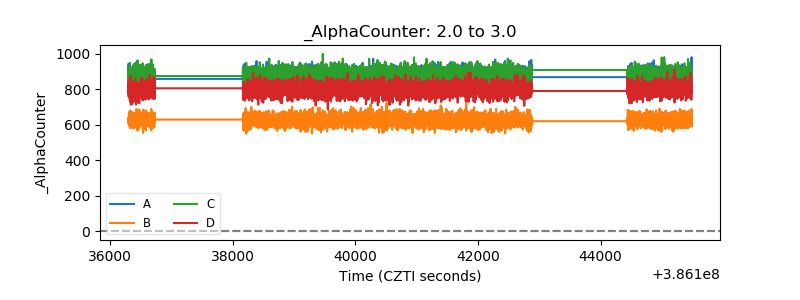 |
| _CPM_Rate | 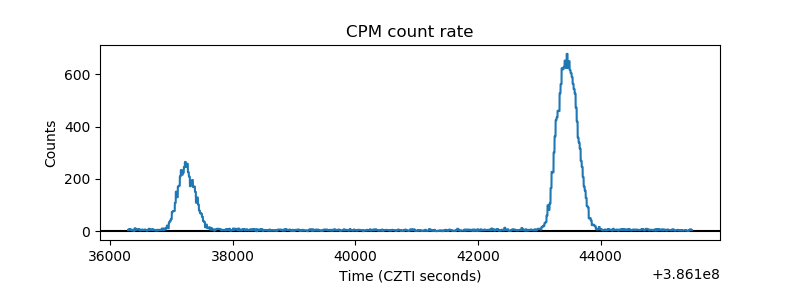 |
| CZT Counter | 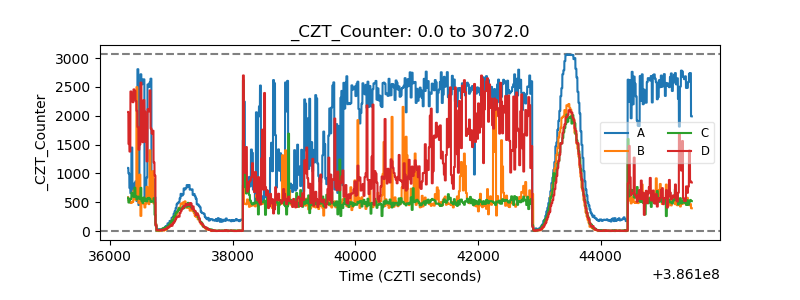 |
| +2.5 Volts monitor | 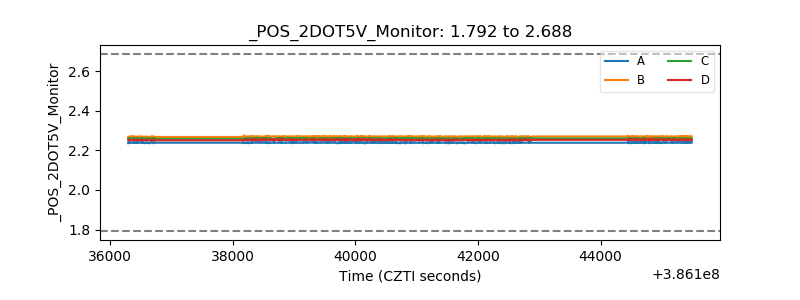 |
| +5 Volts monitor | 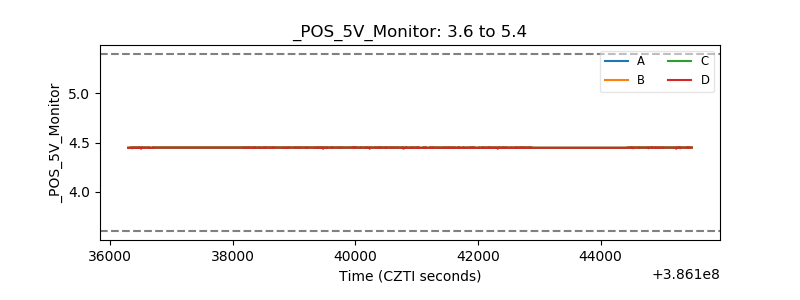 |
| _ROLL_ROT | 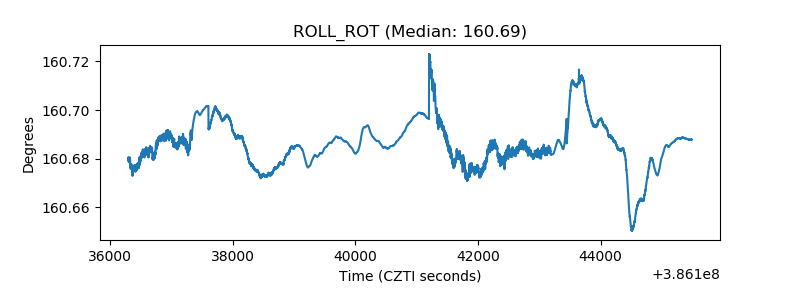 |
| _Roll_DEC | 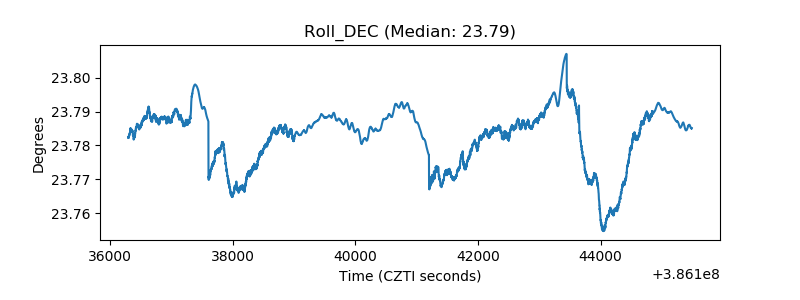 |
| _Roll_RA | 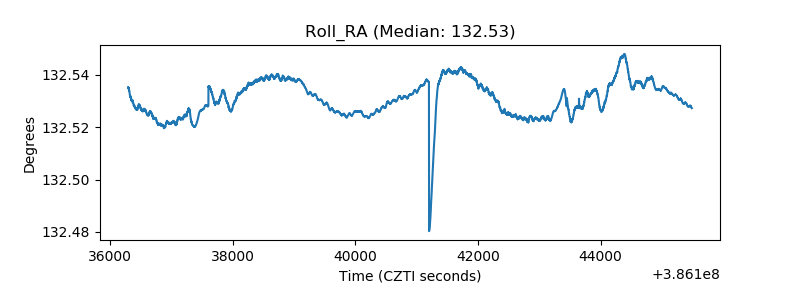 |
| Veto Counter | 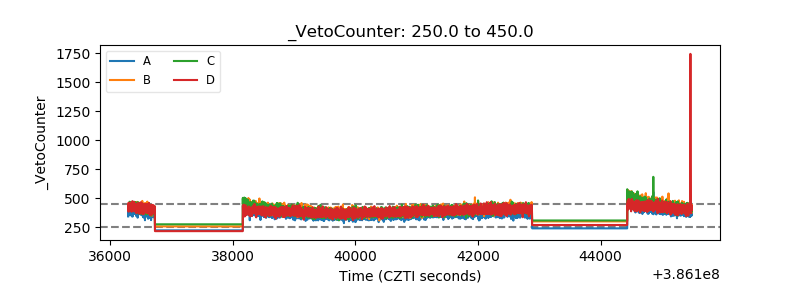 |