| Param | Original file | Final file |
|---|---|---|
| Filename | modeM0/AS1A11_047T09_9000005028_35125cztM0_level2.evt | modeM0/AS1A11_047T09_9000005028_35125cztM0_level2_quad_clean.evt |
| Size (bytes) | 1,197,063,360 | 110,710,080 |
| Size | 1.1 GB | 105.6 MB |
| Events in quadrant A | 10,356,215 | 627,759 |
| Events in quadrant B | 6,282,041 | 693,120 |
| Events in quadrant C | 5,892,663 | 691,447 |
| Events in quadrant D | 12,990,401 | 585,989 |
| Mode SS | |||
|---|---|---|---|
| Quadrant | BADHDUFLAG | Total packets | Discarded packets |
| A | 0 | 224 | 0 |
| B | 0 | 224 | 0 |
| C | 0 | 224 | 0 |
| D | 0 | 224 | 0 |
| Mode M9 | |||
|---|---|---|---|
| Quadrant | BADHDUFLAG | Total packets | Discarded packets |
| A | 0 | 40 | 0 |
| B | 0 | 40 | 0 |
| C | 0 | 40 | 0 |
| D | 0 | 40 | 0 |
| Mode M0 | |||
|---|---|---|---|
| Quadrant | BADHDUFLAG | Total packets | Discarded packets |
| A | 0 | 38057 | 4 |
| B | 0 | 25466 | 3 |
| C | 0 | 23695 | 3 |
| D | 0 | 46173 | 3 |
| Quadrant | Total seconds | Saturated seconds | Saturation percentage |
|---|---|---|---|
| A | 10876 | 1741 | 16.007723% |
| B | 10876 | 280 | 2.574476% |
| C | 10876 | 51 | 0.468922% |
| D | 10876 | 1596 | 14.674513% |
Noise dominated data is calculated using 1-second bins in cleaned event files. If a bin has >2000 counts, and if more than 50% of those come from <1% of pixels, then it is considered to be noise-dominated and hence unusable.
| Quadrant | # 1 sec bins | Bins with >0 counts | Bins with >2000 counts | High rate bins dominated by noise | Noise dominated (total time) | Noise dominated (detector-on time) | Marked lightcurve |
|---|---|---|---|---|---|---|---|
| A | 14934 | 10879 | 1271 | 1271 | 8.51% | 11.68% | 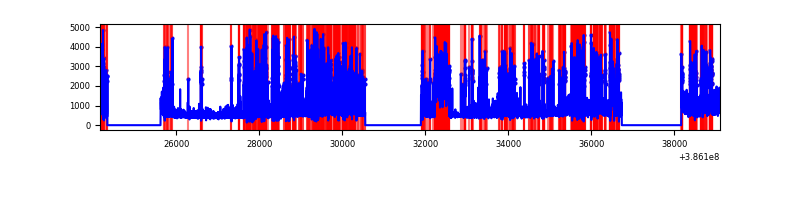 |
| B | 14934 | 10879 | 179 | 179 | 1.20% | 1.65% | 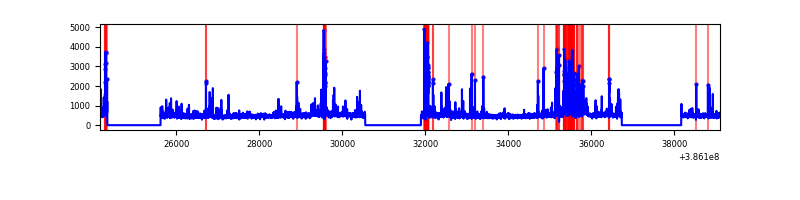 |
| C | 14934 | 10879 | 33 | 33 | 0.22% | 0.30% | 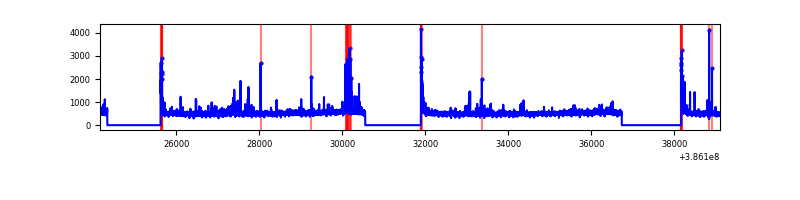 |
| D | 14934 | 10879 | 1286 | 1286 | 8.61% | 11.82% | 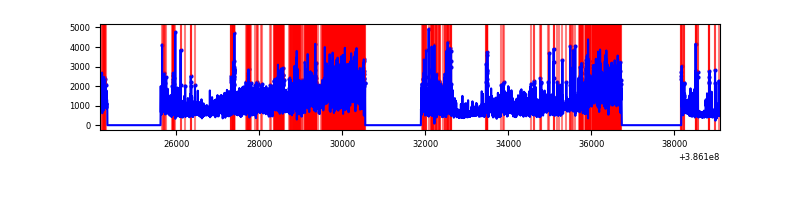 |
Top three noisy pixels from each quadrant. If the there are fewer than three noisy pixels in the level2.evt file, extra rows are filled as -1
| Pixel properties | Quadrant properties | ||||||
|---|---|---|---|---|---|---|---|
| Quadrant | DetID | PixID | Counts | Sigma | Mean | Median | Sigma |
| A | 15 | 169 | 5527417 | 23119.62 | 1188 | 1162 | 239.0 |
| A | 10 | 83 | 141025 | 585.13 | 1188 | 1162 | 239.0 |
| A | 9 | 143 | 74612 | 307.29 | 1188 | 1162 | 239.0 |
| B | 5 | 172 | 482426 | 1977.46 | 1261 | 1228 | 243.3 |
| B | 0 | 190 | 469478 | 1924.25 | 1261 | 1228 | 243.3 |
| B | 3 | 112 | 160372 | 653.99 | 1261 | 1228 | 243.3 |
| C | 15 | 214 | 456618 | 1576.51 | 1247 | 1254 | 288.8 |
| C | 0 | 10 | 249544 | 859.6 | 1247 | 1254 | 288.8 |
| C | 14 | 67 | 115884 | 396.86 | 1247 | 1254 | 288.8 |
| D | 8 | 195 | 5727460 | 19639.09 | 1190 | 1156 | 291.6 |
| D | 2 | 250 | 965879 | 3308.64 | 1190 | 1156 | 291.6 |
| D | 12 | 233 | 446405 | 1527.04 | 1190 | 1156 | 291.6 |
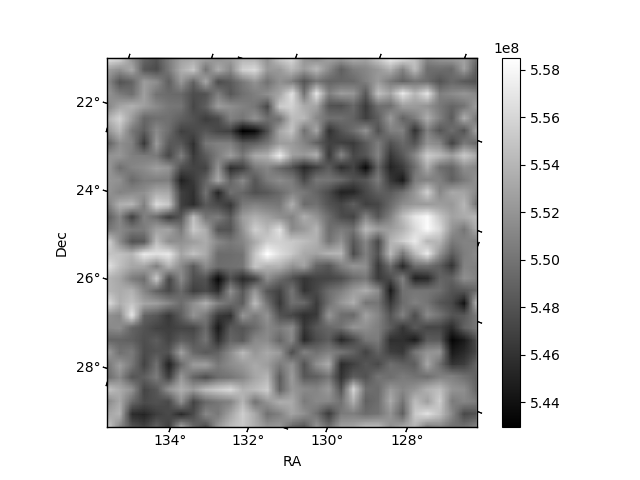
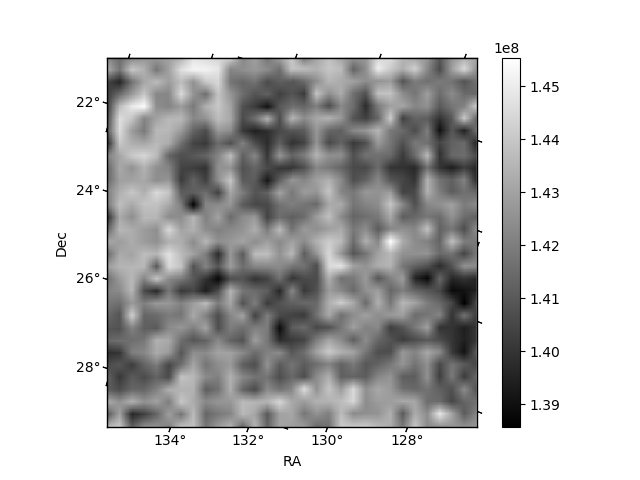
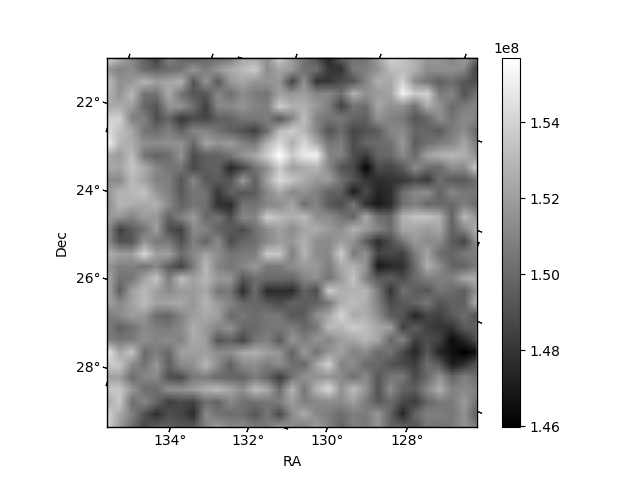
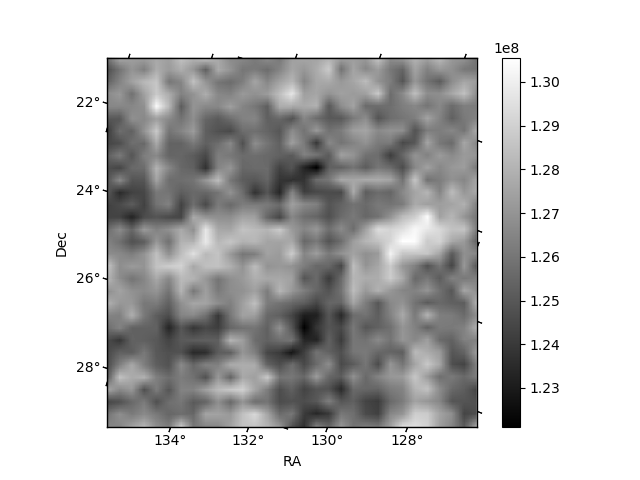
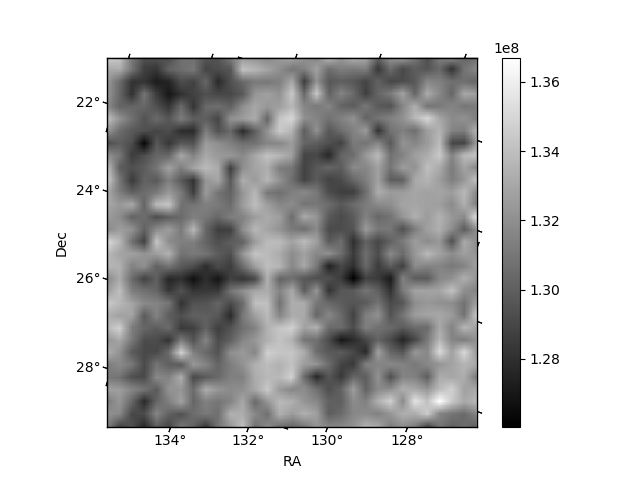
Histogram calculated using DETX and DETY for each event in the final _common_clean file
| Quadrant A | 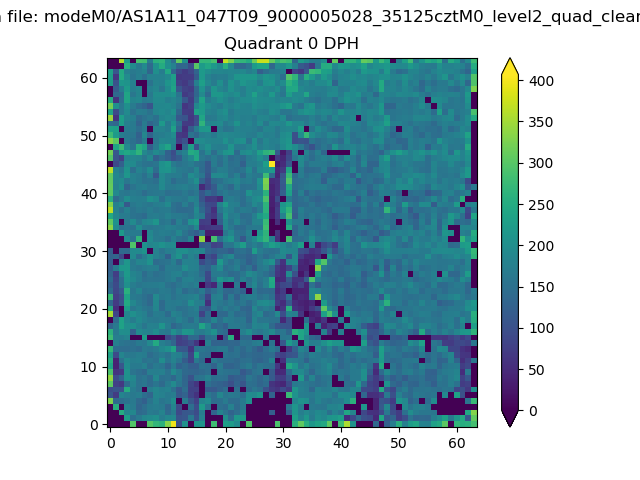 |
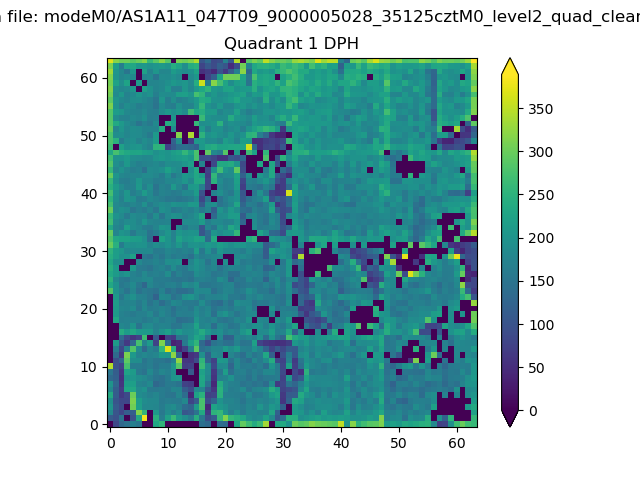 |
Quadrant B |
|---|---|---|---|
| Quadrant D | 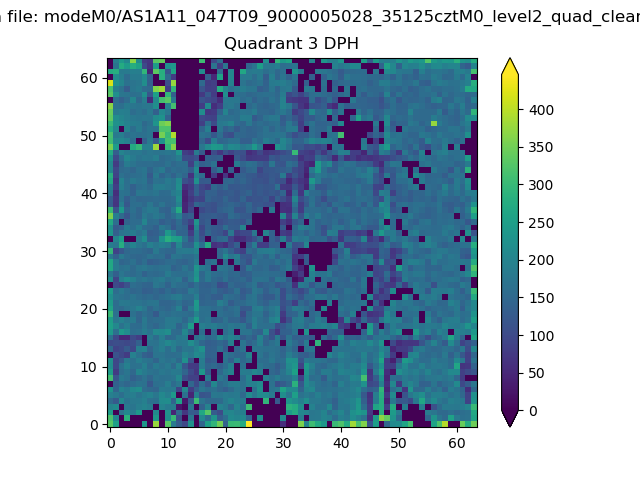 |
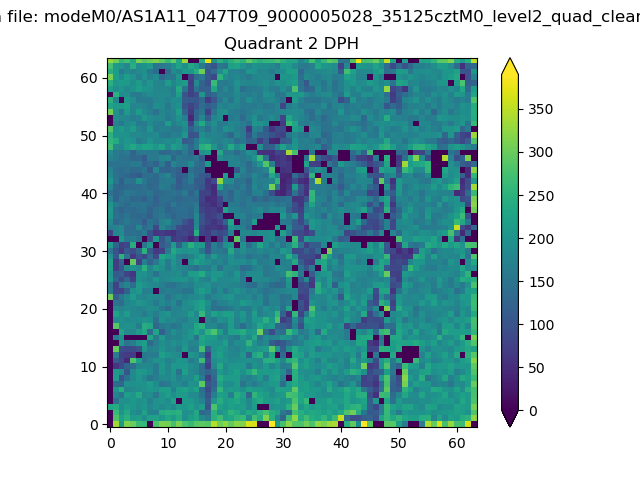 |
Quadrant C |
| Plot type | Count rate plots | Images |
|---|---|---|
| Comparison with Poisson distribution Blue bars denote a histogram of data divided into 1 sec bins. Red curve is a Poisson curve with rate = median count rate of data. |
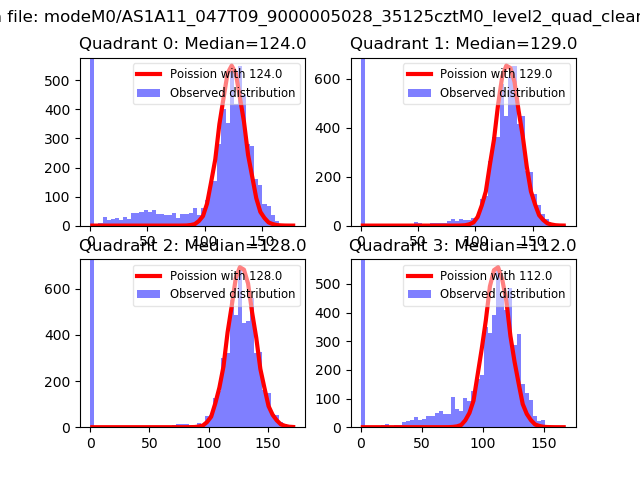 |
 |
| Quadrant-wise count rates Data is divided into 100 sec bins |
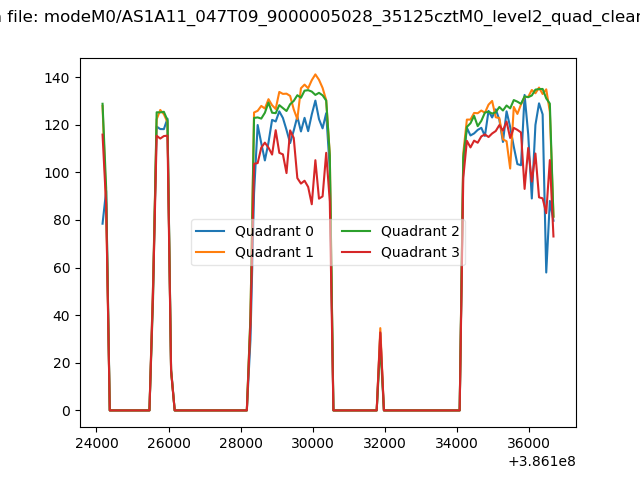 |
|
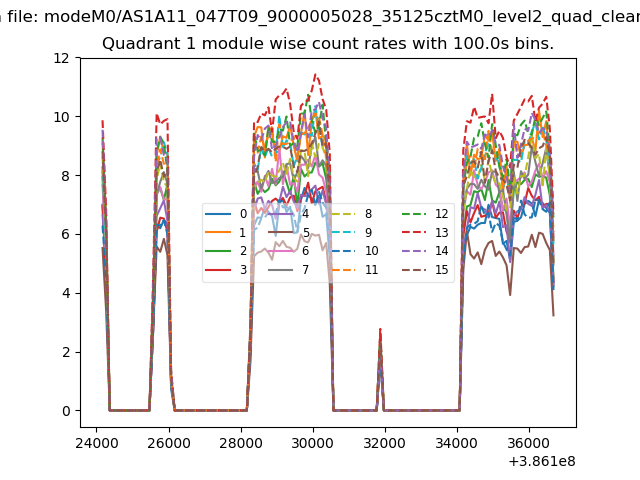
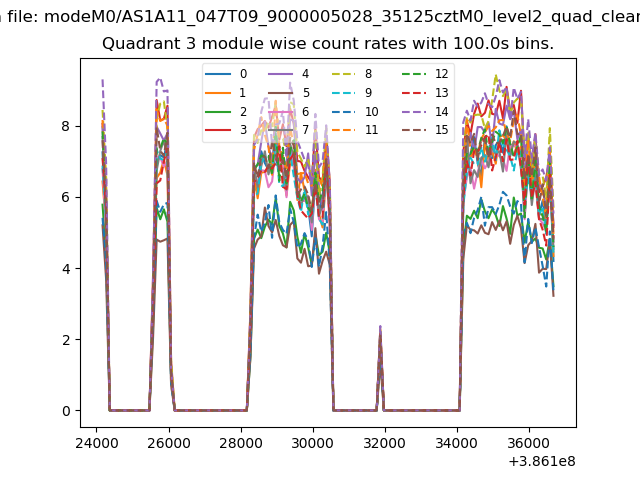
| Module-wise count rates for Quadrant A Data is divided into 100 sec bins |
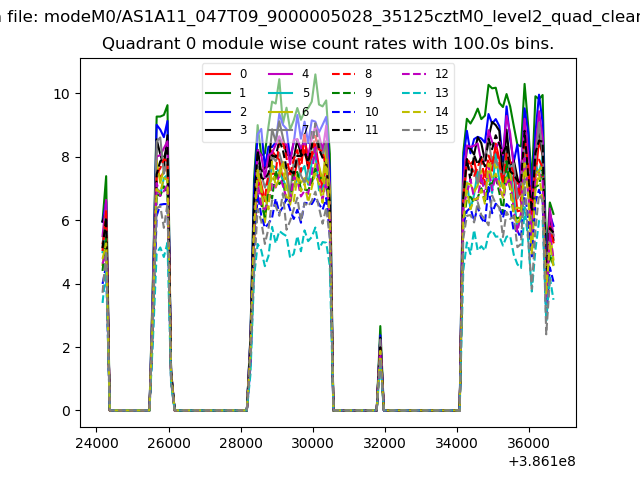 |
 |
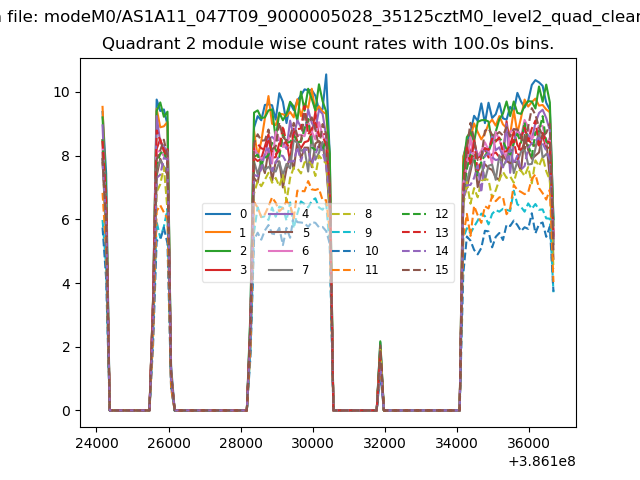
| Module-wise count rates for Quadrant B Data is divided into 100 sec bins |
 |
 |
| Module-wise count rates for Quadrant C Data is divided into 100 sec bins |
 |
 |
| Module-wise count rates for Quadrant D Data is divided into 100 sec bins |
 |
 |
| Parameter | Plot |
|---|---|
| CZT HV Monitor | 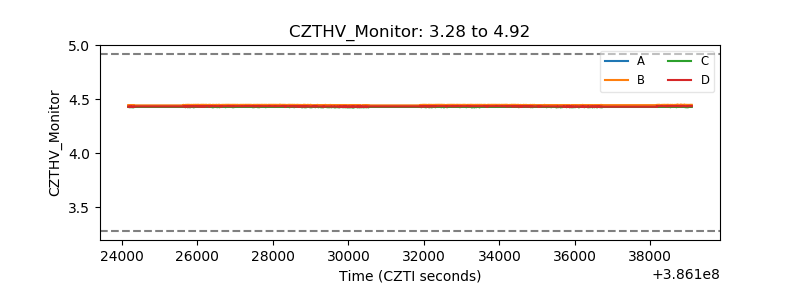 |
| D_VDD | 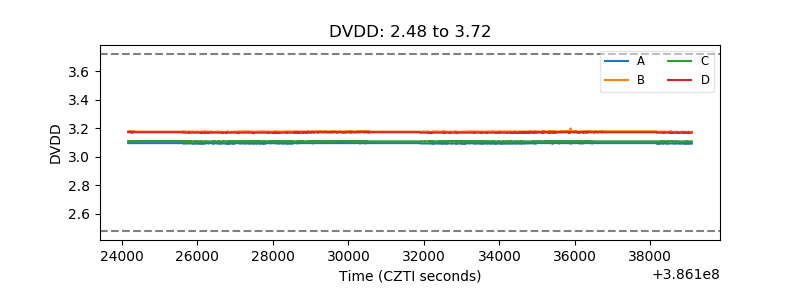 |
| Temperature 1 | 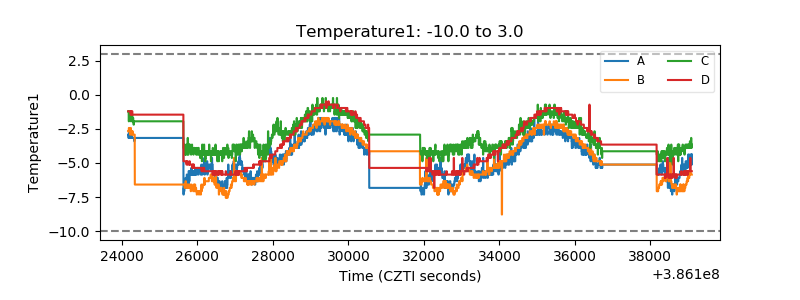 |
| Veto HV Monitor | 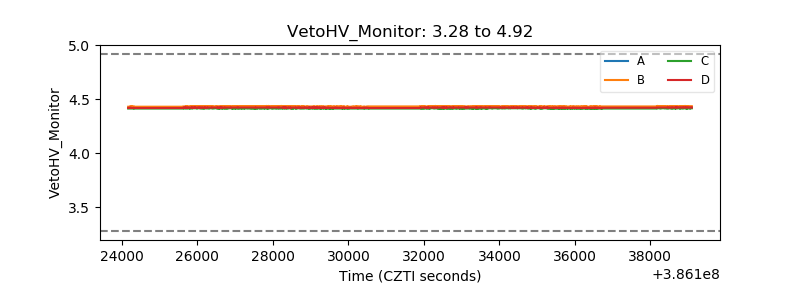 |
| Veto LLD | 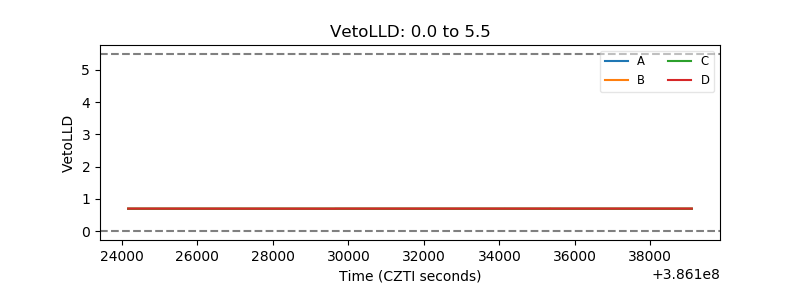 |
| Alpha Counter | 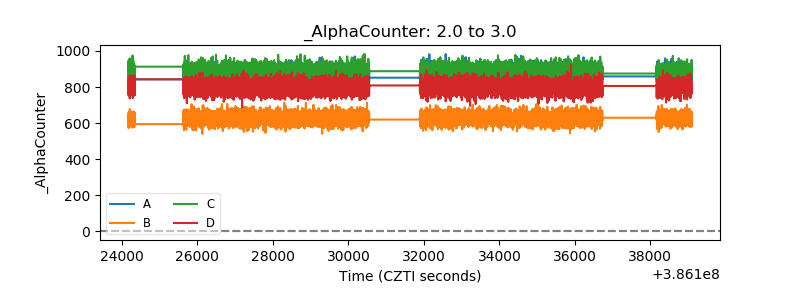 |
| _CPM_Rate | 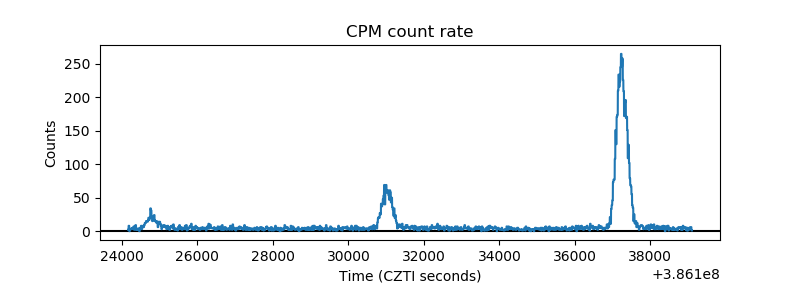 |
| CZT Counter | 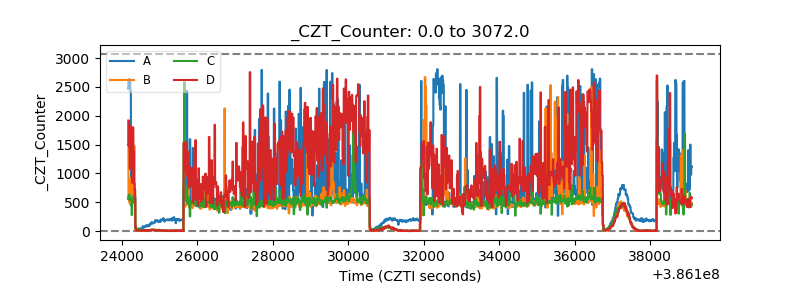 |
| +2.5 Volts monitor | 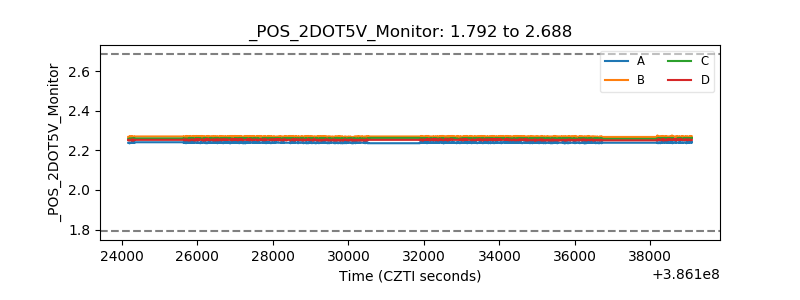 |
| +5 Volts monitor | 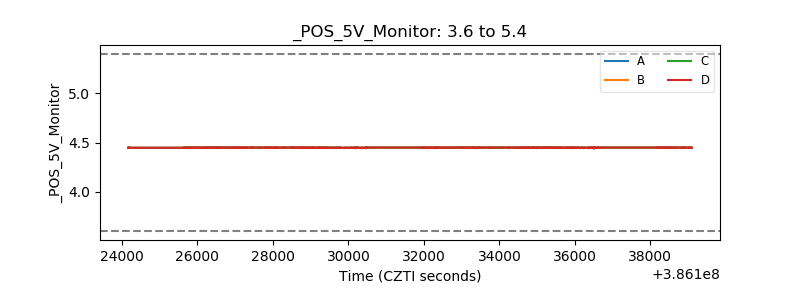 |
| _ROLL_ROT | 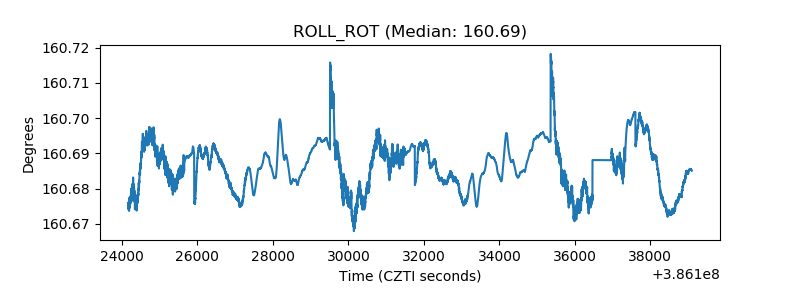 |
| _Roll_DEC | 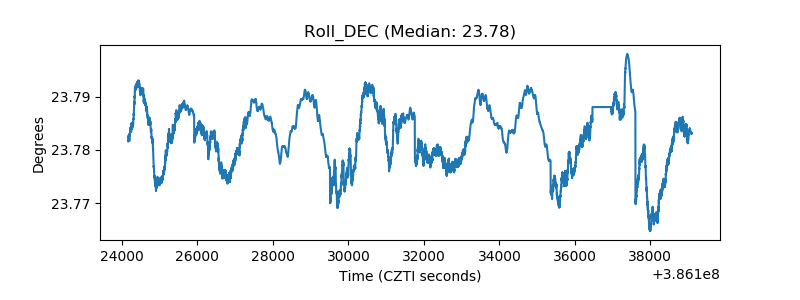 |
| _Roll_RA | 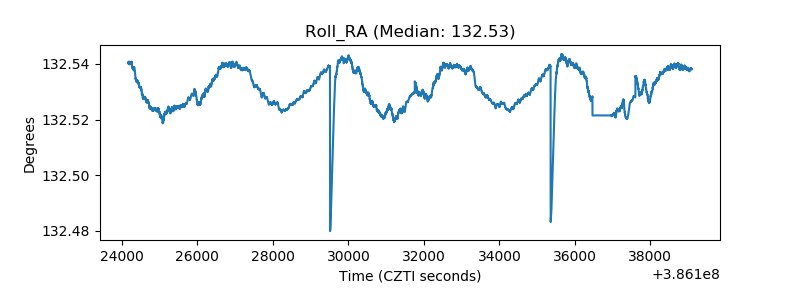 |
| Veto Counter | 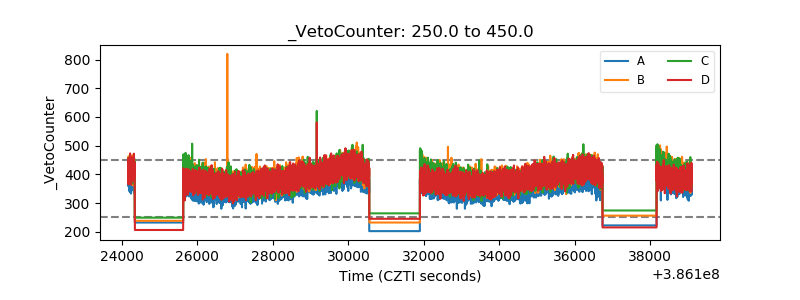 |