| Param | Original file | Final file |
|---|---|---|
| Filename | modeM0/AS1A11_047T09_9000005028_35122cztM0_level2.evt | modeM0/AS1A11_047T09_9000005028_35122cztM0_level2_quad_clean.evt |
| Size (bytes) | 728,533,440 | 76,320,000 |
| Size | 694.8 MB | 72.8 MB |
| Events in quadrant A | 9,121,785 | 406,872 |
| Events in quadrant B | 3,305,636 | 507,995 |
| Events in quadrant C | 3,363,195 | 500,167 |
| Events in quadrant D | 5,857,731 | 465,694 |
| Mode SS | |||
|---|---|---|---|
| Quadrant | BADHDUFLAG | Total packets | Discarded packets |
| A | 0 | 128 | 0 |
| B | 0 | 128 | 0 |
| C | 0 | 128 | 0 |
| D | 0 | 128 | 0 |
| Mode M9 | |||
|---|---|---|---|
| Quadrant | BADHDUFLAG | Total packets | Discarded packets |
| A | 0 | 28 | 0 |
| B | 0 | 28 | 0 |
| C | 0 | 28 | 0 |
| D | 0 | 28 | 0 |
| Mode M0 | |||
|---|---|---|---|
| Quadrant | BADHDUFLAG | Total packets | Discarded packets |
| A | 0 | 31189 | 3 |
| B | 0 | 13776 | 2 |
| C | 0 | 13715 | 2 |
| D | 0 | 21724 | 2 |
| Quadrant | Total seconds | Saturated seconds | Saturation percentage |
|---|---|---|---|
| A | 6149 | 2550 | 41.470158% |
| B | 6149 | 75 | 1.219711% |
| C | 6149 | 54 | 0.878192% |
| D | 6149 | 197 | 3.203773% |
Noise dominated data is calculated using 1-second bins in cleaned event files. If a bin has >2000 counts, and if more than 50% of those come from <1% of pixels, then it is considered to be noise-dominated and hence unusable.
| Quadrant | # 1 sec bins | Bins with >0 counts | Bins with >2000 counts | High rate bins dominated by noise | Noise dominated (total time) | Noise dominated (detector-on time) | Marked lightcurve |
|---|---|---|---|---|---|---|---|
| A | 8986 | 6151 | 2062 | 2062 | 22.95% | 33.52% | 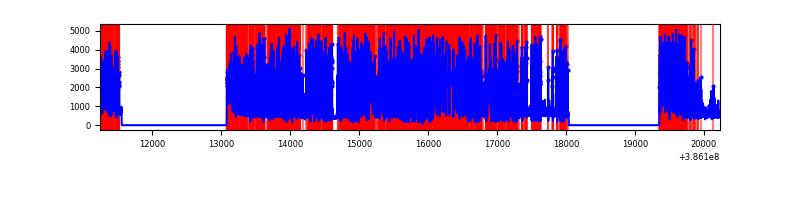 |
| B | 8986 | 6151 | 45 | 45 | 0.50% | 0.73% | 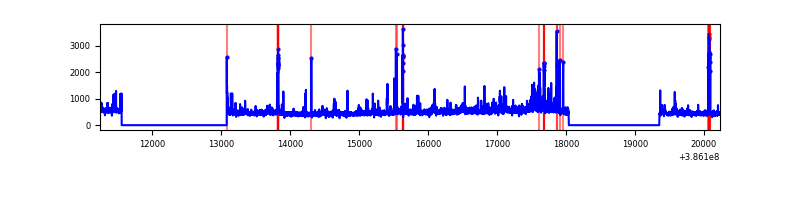 |
| C | 8986 | 6151 | 34 | 34 | 0.38% | 0.55% | 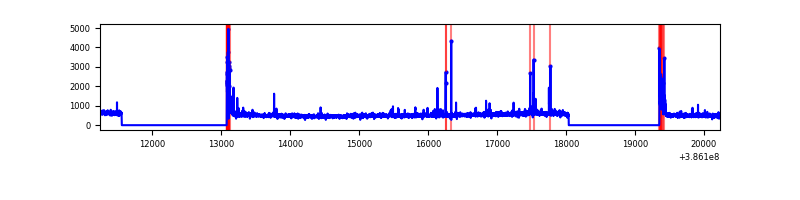 |
| D | 8986 | 6151 | 157 | 157 | 1.75% | 2.55% | 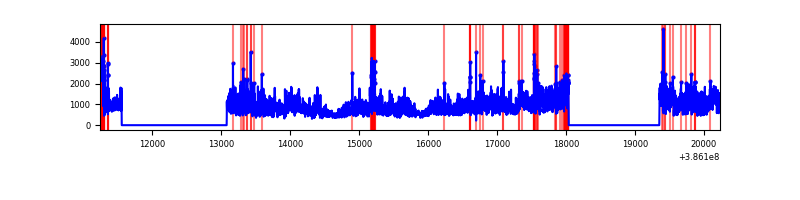 |
Top three noisy pixels from each quadrant. If the there are fewer than three noisy pixels in the level2.evt file, extra rows are filled as -1
| Pixel properties | Quadrant properties | ||||||
|---|---|---|---|---|---|---|---|
| Quadrant | DetID | PixID | Counts | Sigma | Mean | Median | Sigma |
| A | 15 | 169 | 6879937 | 60650.56 | 556 | 545 | 113.4 |
| A | 10 | 83 | 73046 | 639.19 | 556 | 545 | 113.4 |
| A | 13 | 6 | 14322 | 121.46 | 556 | 545 | 113.4 |
| B | 5 | 172 | 226472 | 1613.75 | 719 | 698 | 139.9 |
| B | 5 | 255 | 81249 | 575.75 | 719 | 698 | 139.9 |
| B | 0 | 155 | 46816 | 329.64 | 719 | 698 | 139.9 |
| C | 15 | 214 | 259675 | 1571.96 | 707 | 714 | 164.7 |
| C | 0 | 10 | 188803 | 1141.75 | 707 | 714 | 164.7 |
| C | 14 | 67 | 80674 | 485.38 | 707 | 714 | 164.7 |
| D | 8 | 195 | 2596616 | 14991.27 | 701 | 681 | 173.2 |
| D | 2 | 250 | 139716 | 802.91 | 701 | 681 | 173.2 |
| D | 7 | 80 | 134234 | 771.25 | 701 | 681 | 173.2 |
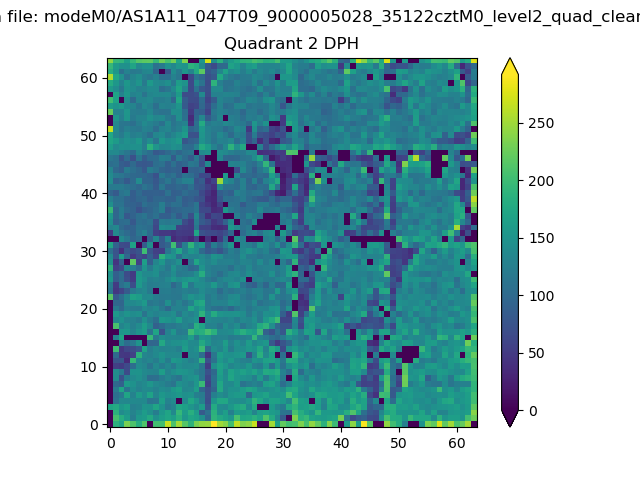
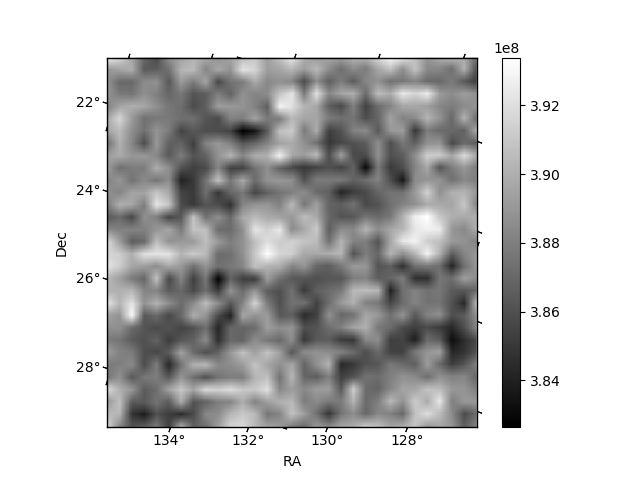
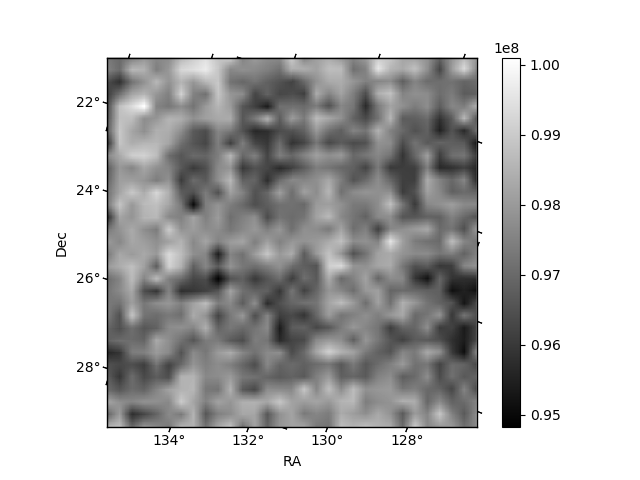
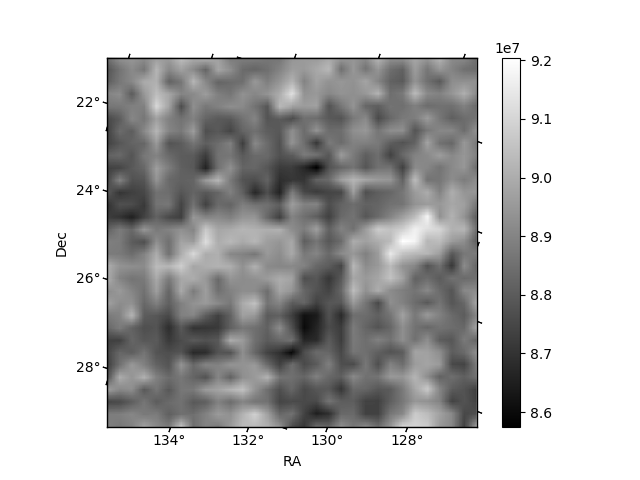
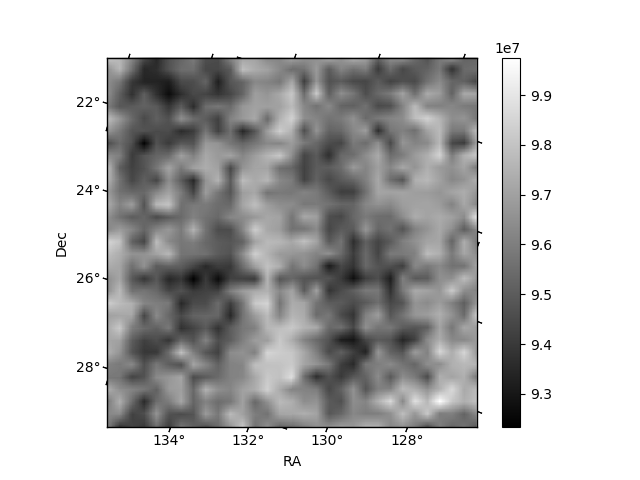
Histogram calculated using DETX and DETY for each event in the final _common_clean file
| Quadrant A | 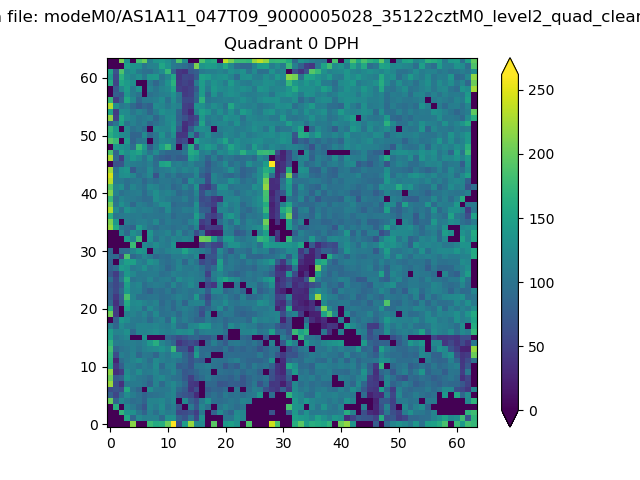 |
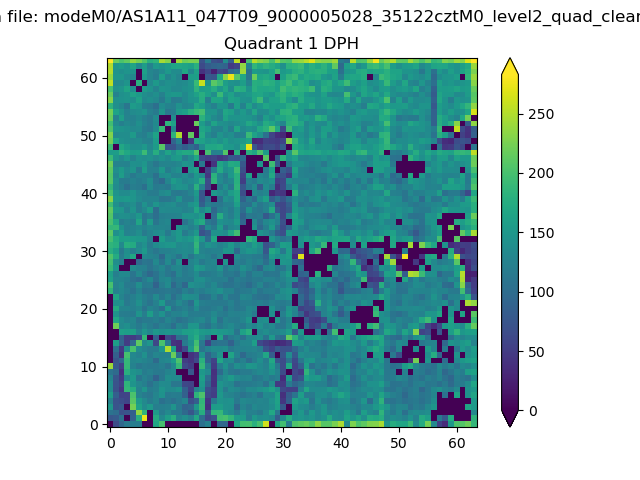 |
Quadrant B |
|---|---|---|---|
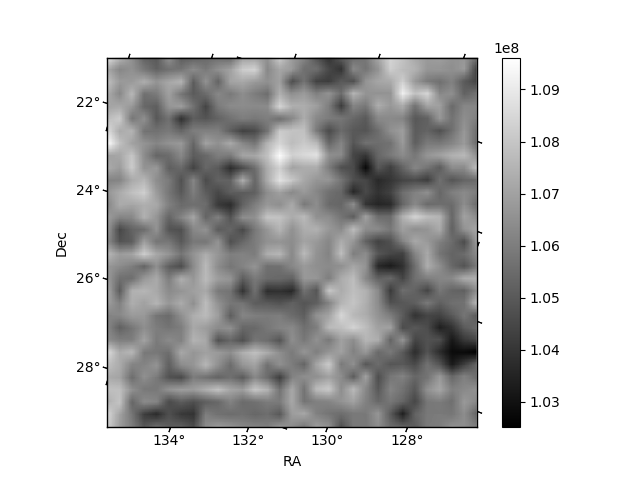
| Quadrant D | 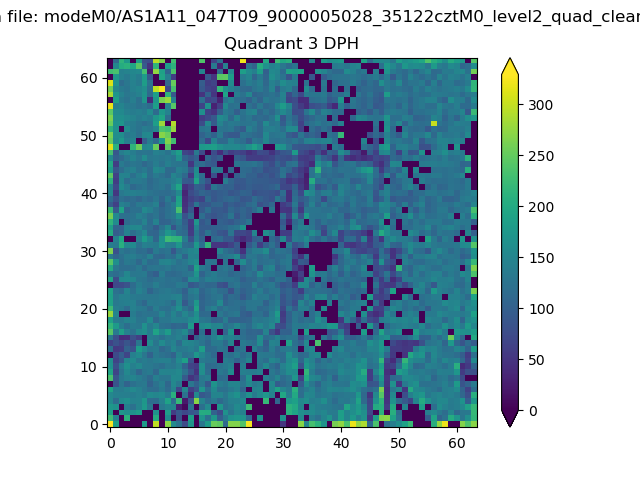 |
 |
Quadrant C |
| Plot type | Count rate plots | Images |
|---|---|---|
| Comparison with Poisson distribution Blue bars denote a histogram of data divided into 1 sec bins. Red curve is a Poisson curve with rate = median count rate of data. |
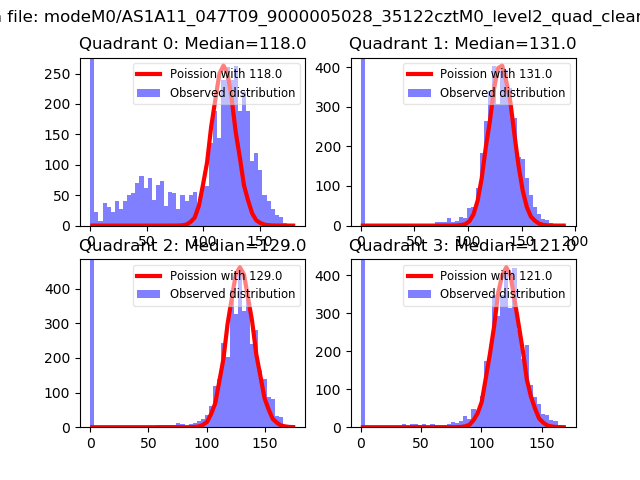 |
 |
| Quadrant-wise count rates Data is divided into 100 sec bins |
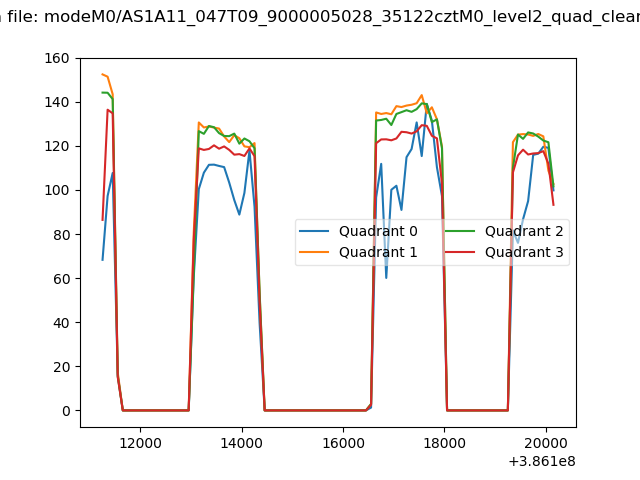 |
|
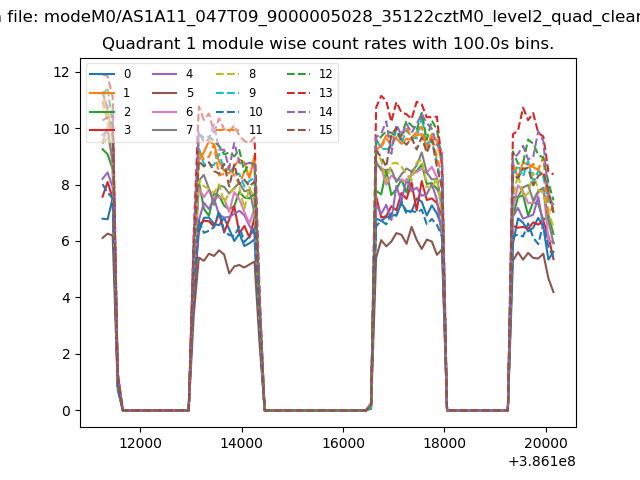
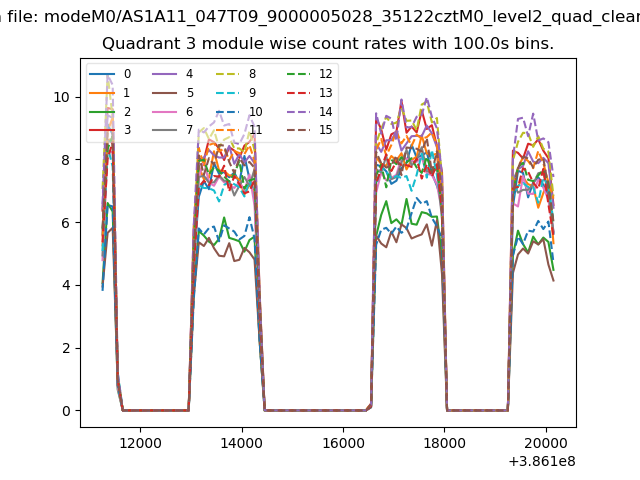
| Module-wise count rates for Quadrant A Data is divided into 100 sec bins |
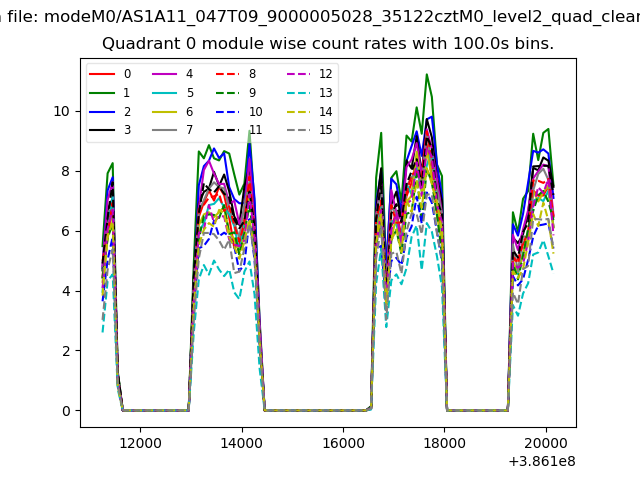 |
 |
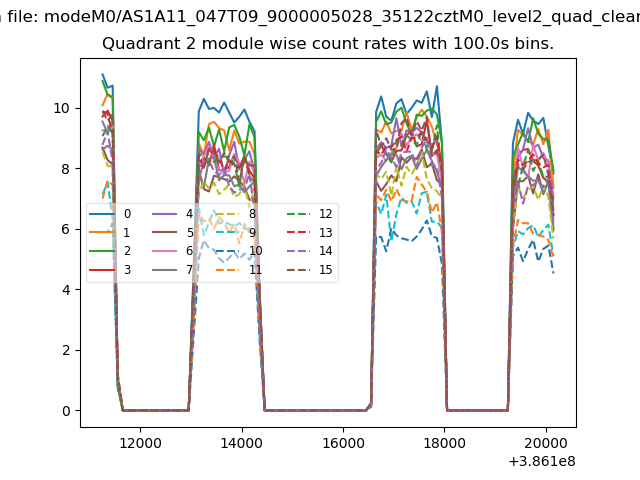
| Module-wise count rates for Quadrant B Data is divided into 100 sec bins |
 |
 |
| Module-wise count rates for Quadrant C Data is divided into 100 sec bins |
 |
 |
| Module-wise count rates for Quadrant D Data is divided into 100 sec bins |
 |
 |
| Parameter | Plot |
|---|---|
| CZT HV Monitor | 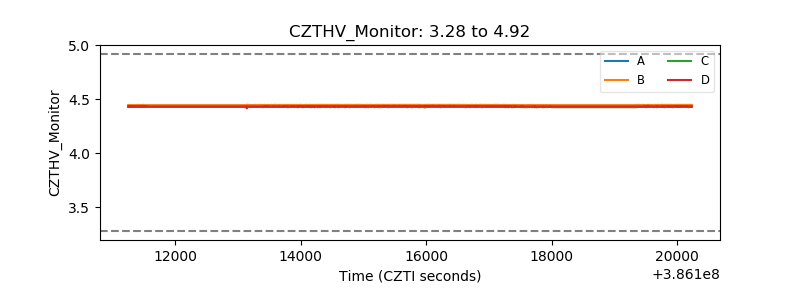 |
| D_VDD | 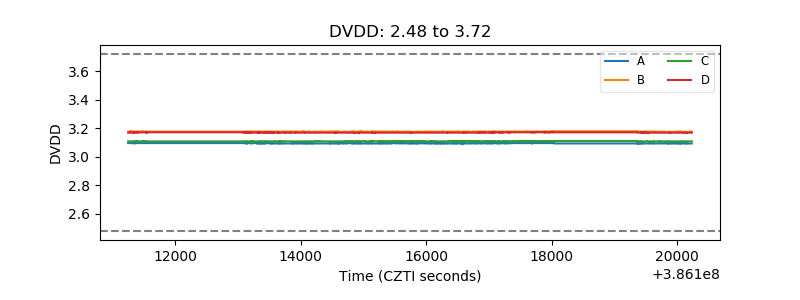 |
| Temperature 1 | 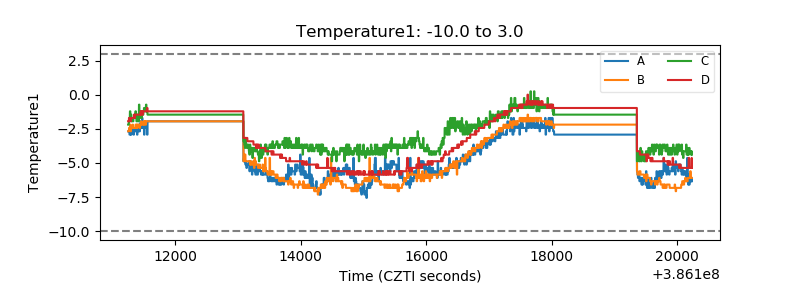 |
| Veto HV Monitor | 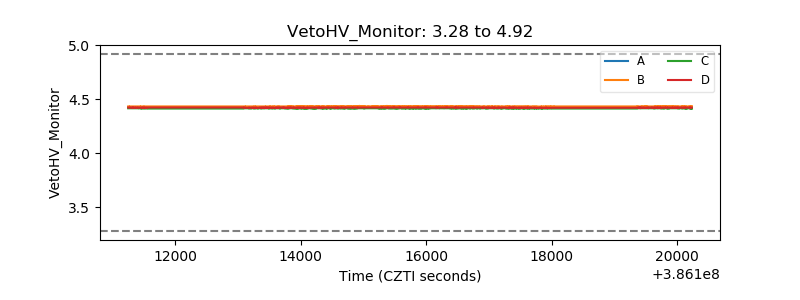 |
| Veto LLD | 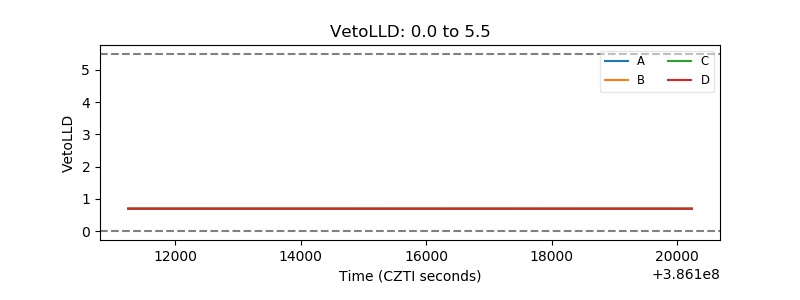 |
| Alpha Counter | 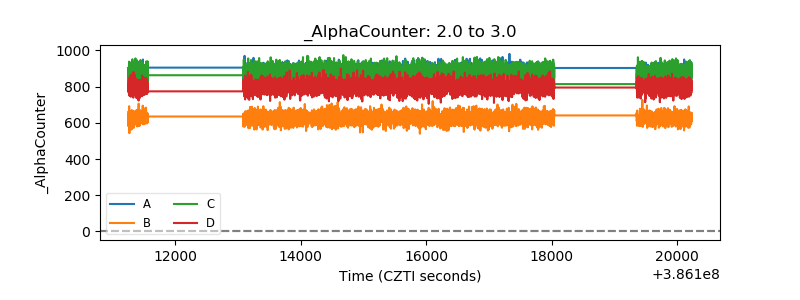 |
| _CPM_Rate | 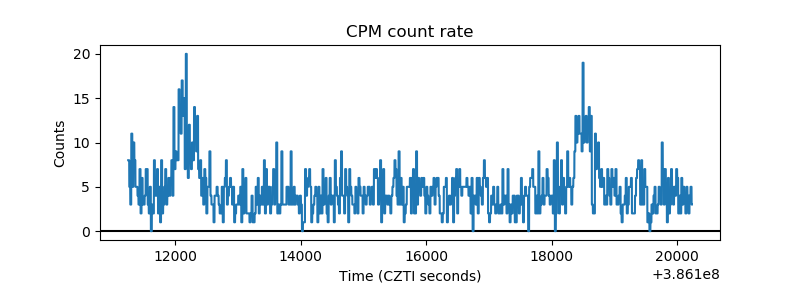 |
| CZT Counter | 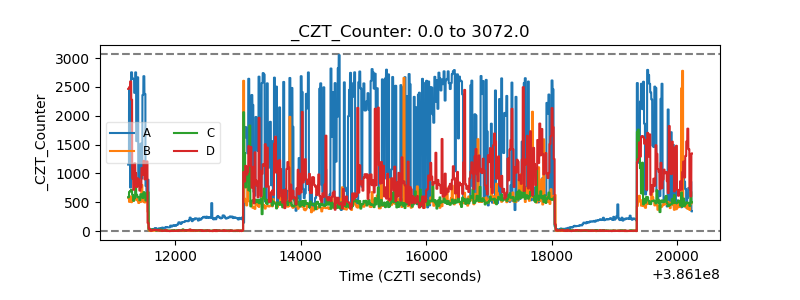 |
| +2.5 Volts monitor | 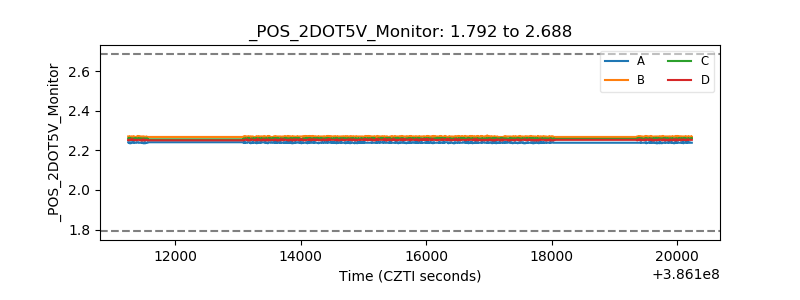 |
| +5 Volts monitor | 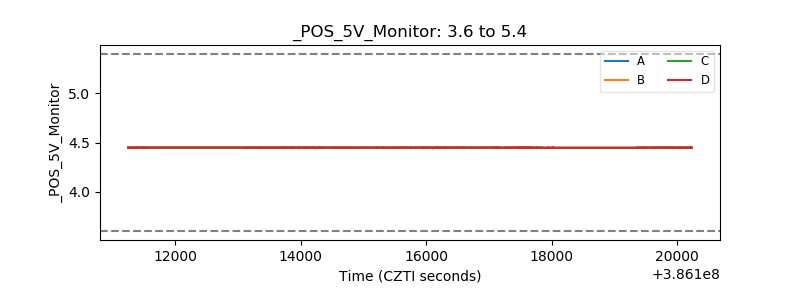 |
| _ROLL_ROT | 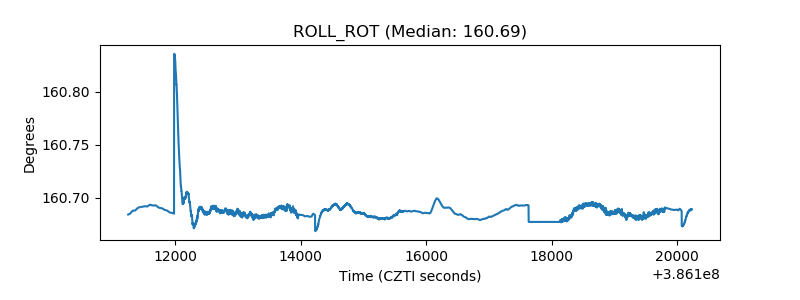 |
| _Roll_DEC | 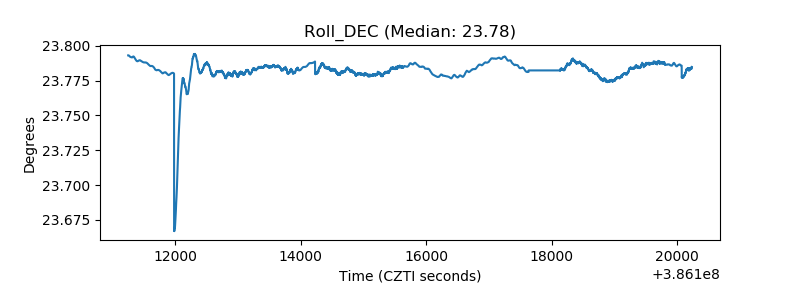 |
| _Roll_RA | 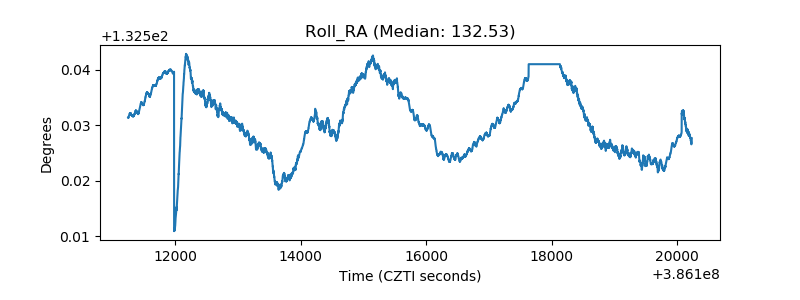 |
| Veto Counter | 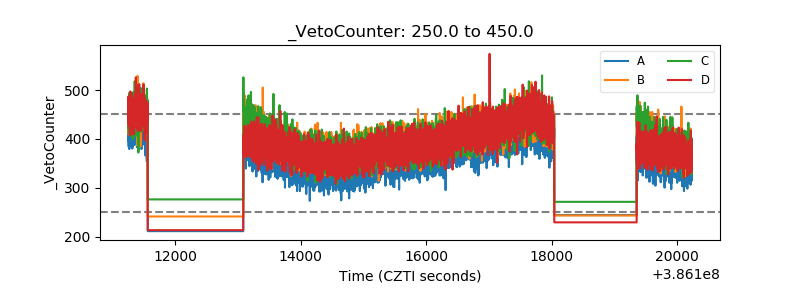 |