| Param | Original file | Final file |
|---|---|---|
| Filename | modeM0/AS1T05_015T01_9000005026_35119cztM0_level2.evt | modeM0/AS1T05_015T01_9000005026_35119cztM0_level2_quad_clean.evt |
| Size (bytes) | 701,184,960 | 78,356,160 |
| Size | 668.7 MB | 74.7 MB |
| Events in quadrant A | 9,366,052 | 459,938 |
| Events in quadrant B | 2,745,149 | 539,569 |
| Events in quadrant C | 2,814,320 | 541,047 |
| Events in quadrant D | 5,977,993 | 485,456 |
| Mode SS | |||
|---|---|---|---|
| Quadrant | BADHDUFLAG | Total packets | Discarded packets |
| A | 0 | 100 | 0 |
| B | 0 | 100 | 0 |
| C | 0 | 100 | 0 |
| D | 0 | 100 | 0 |
| Mode M9 | |||
|---|---|---|---|
| Quadrant | BADHDUFLAG | Total packets | Discarded packets |
| A | 0 | 28 | 0 |
| B | 0 | 28 | 0 |
| C | 0 | 28 | 0 |
| D | 0 | 29 | 0 |
| Mode M0 | |||
|---|---|---|---|
| Quadrant | BADHDUFLAG | Total packets | Discarded packets |
| A | 0 | 31235 | 3 |
| B | 0 | 11155 | 2 |
| C | 0 | 11214 | 2 |
| D | 0 | 21224 | 2 |
| Quadrant | Total seconds | Saturated seconds | Saturation percentage |
|---|---|---|---|
| A | 4936 | 2058 | 41.693679% |
| B | 4936 | 62 | 1.256078% |
| C | 4936 | 60 | 1.215559% |
| D | 4936 | 411 | 8.326580% |
Noise dominated data is calculated using 1-second bins in cleaned event files. If a bin has >2000 counts, and if more than 50% of those come from <1% of pixels, then it is considered to be noise-dominated and hence unusable.
| Quadrant | # 1 sec bins | Bins with >0 counts | Bins with >2000 counts | High rate bins dominated by noise | Noise dominated (total time) | Noise dominated (detector-on time) | Marked lightcurve |
|---|---|---|---|---|---|---|---|
| A | 6999 | 4937 | 1935 | 1935 | 27.65% | 39.19% | 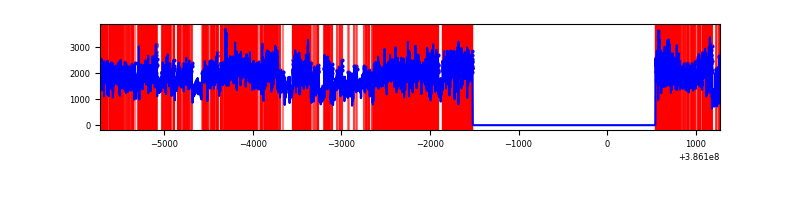 |
| B | 6999 | 4937 | 36 | 36 | 0.51% | 0.73% | 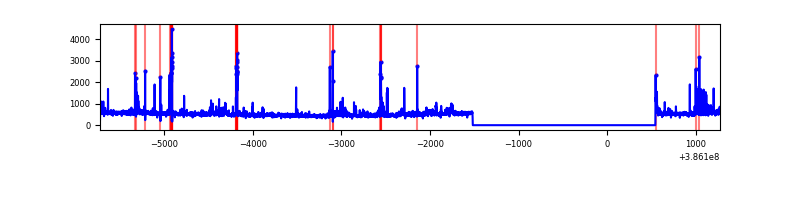 |
| C | 6999 | 4937 | 24 | 24 | 0.34% | 0.49% | 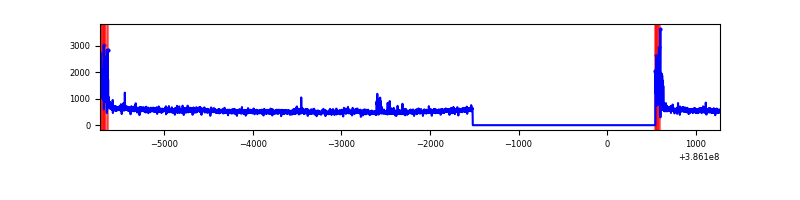 |
| D | 6999 | 4937 | 384 | 384 | 5.49% | 7.78% | 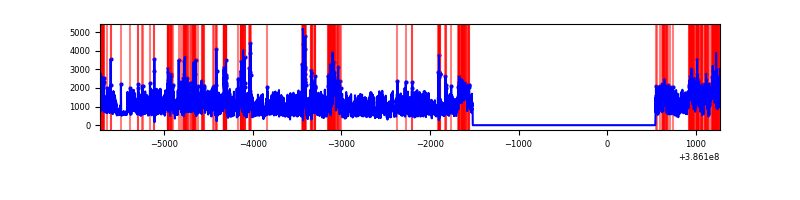 |
Top three noisy pixels from each quadrant. If the there are fewer than three noisy pixels in the level2.evt file, extra rows are filled as -1
| Pixel properties | Quadrant properties | ||||||
|---|---|---|---|---|---|---|---|
| Quadrant | DetID | PixID | Counts | Sigma | Mean | Median | Sigma |
| A | 15 | 169 | 7142092 | 63785.82 | 555 | 545 | 112.0 |
| A | 10 | 83 | 72520 | 642.86 | 555 | 545 | 112.0 |
| A | 13 | 6 | 8153 | 67.95 | 555 | 545 | 112.0 |
| B | 3 | 112 | 89018 | 767.44 | 608 | 594 | 115.2 |
| B | 0 | 190 | 79970 | 688.91 | 608 | 594 | 115.2 |
| B | 5 | 172 | 64620 | 555.69 | 608 | 594 | 115.2 |
| C | 15 | 214 | 210827 | 1520.12 | 603 | 609 | 138.3 |
| C | 0 | 10 | 186777 | 1346.21 | 603 | 609 | 138.3 |
| C | 14 | 67 | 42094 | 299.99 | 603 | 609 | 138.3 |
| D | 8 | 195 | 2896037 | 20274.45 | 586 | 572 | 142.8 |
| D | 13 | 249 | 316655 | 2213.26 | 586 | 572 | 142.8 |
| D | 7 | 80 | 236923 | 1654.96 | 586 | 572 | 142.8 |
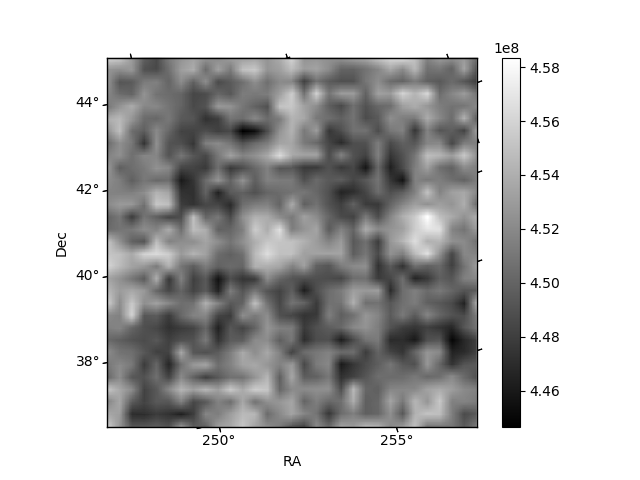
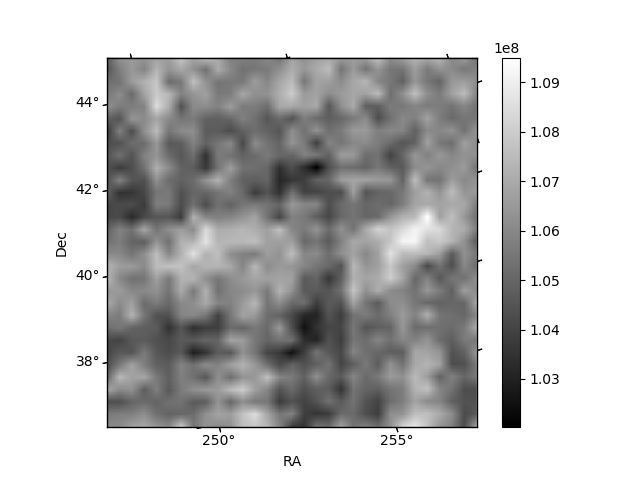
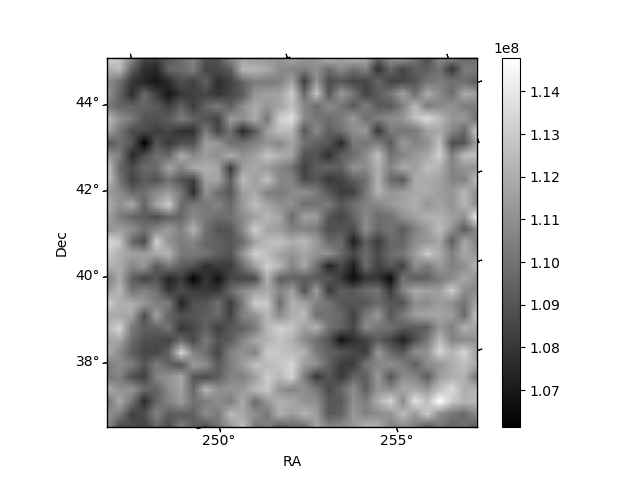
Histogram calculated using DETX and DETY for each event in the final _common_clean file
| Quadrant A | 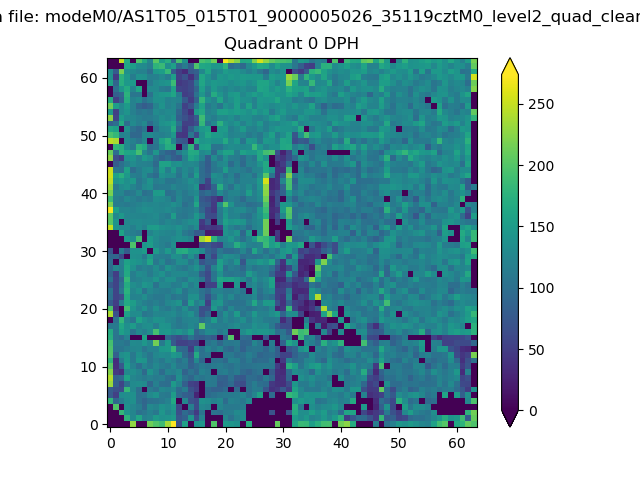 |
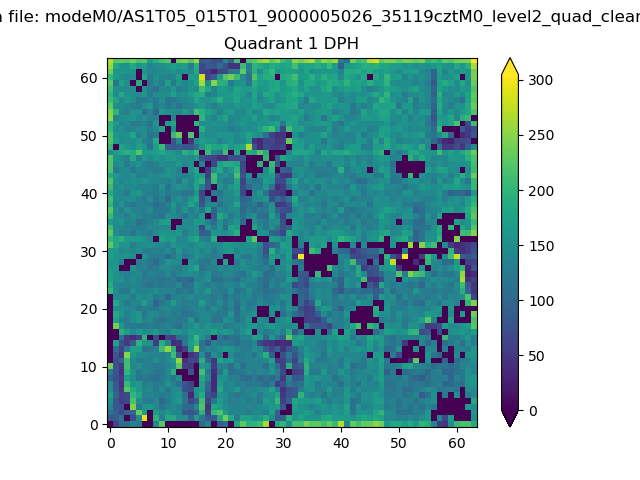 |
Quadrant B |
|---|---|---|---|
| Quadrant D | 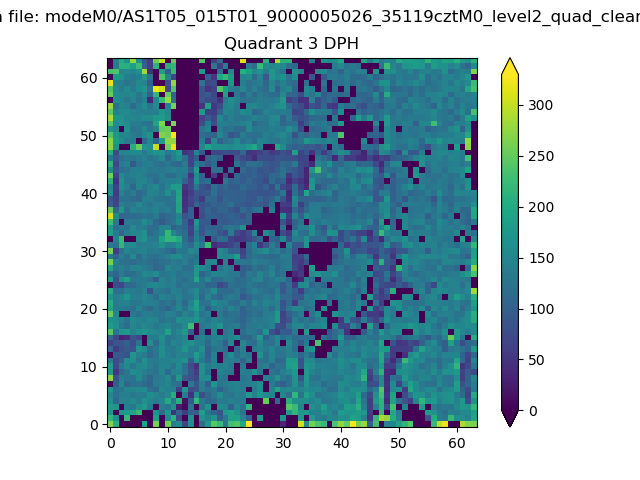 |
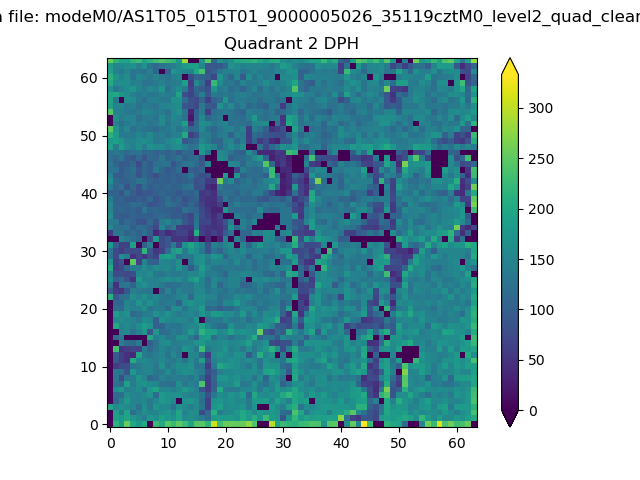 |
Quadrant C |
| Plot type | Count rate plots | Images |
|---|---|---|
| Comparison with Poisson distribution Blue bars denote a histogram of data divided into 1 sec bins. Red curve is a Poisson curve with rate = median count rate of data. |
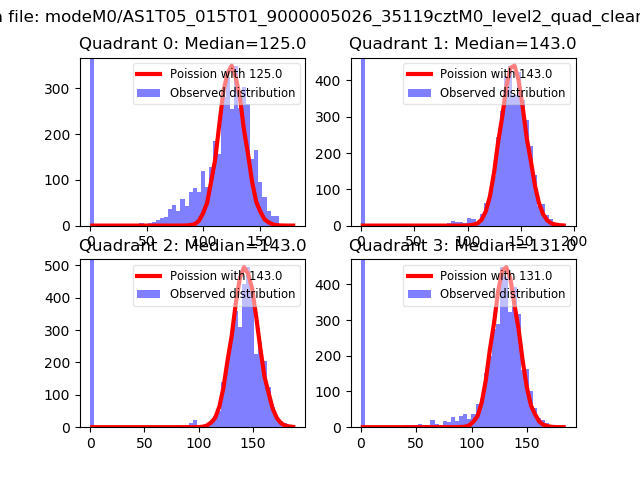 |
 |
| Quadrant-wise count rates Data is divided into 100 sec bins |
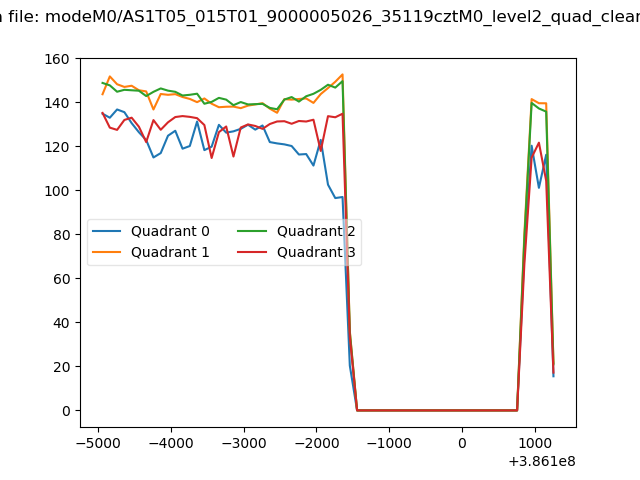 |
|
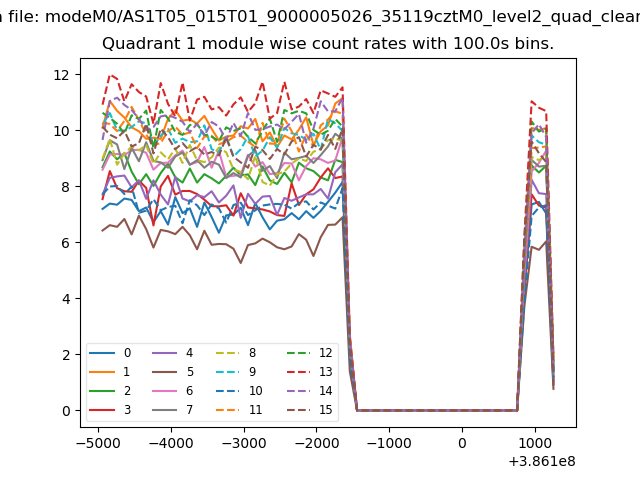
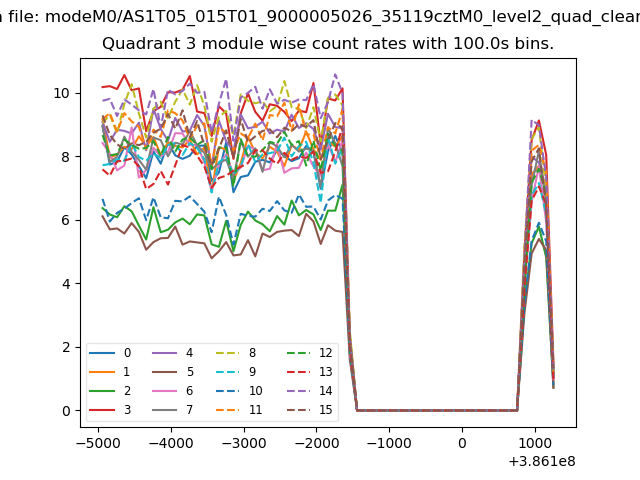
| Module-wise count rates for Quadrant A Data is divided into 100 sec bins |
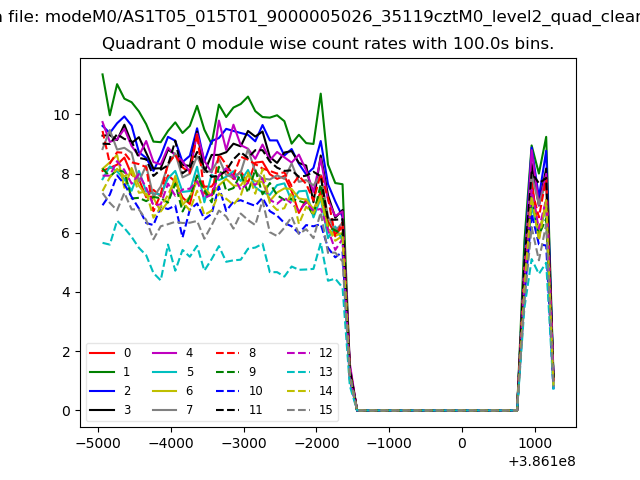 |
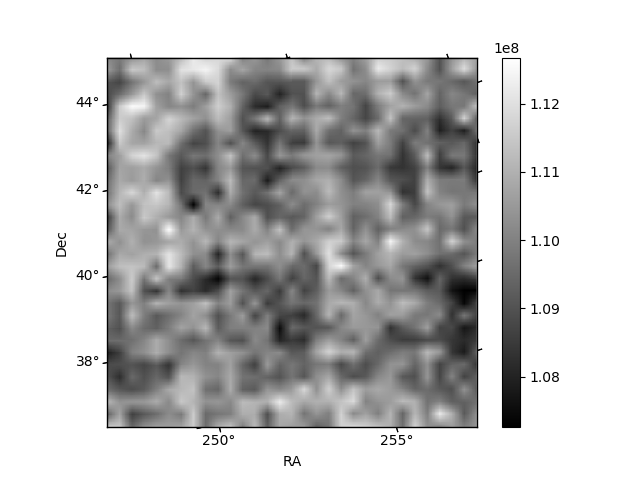 |
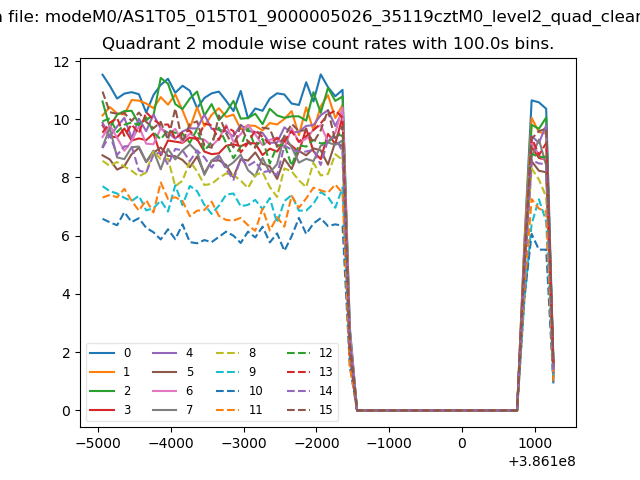
| Module-wise count rates for Quadrant B Data is divided into 100 sec bins |
 |
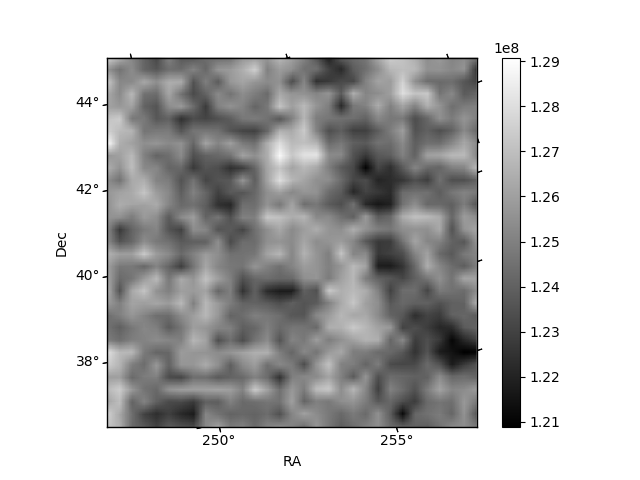 |
| Module-wise count rates for Quadrant C Data is divided into 100 sec bins |
 |
 |
| Module-wise count rates for Quadrant D Data is divided into 100 sec bins |
 |
 |
| Parameter | Plot |
|---|---|
| CZT HV Monitor | 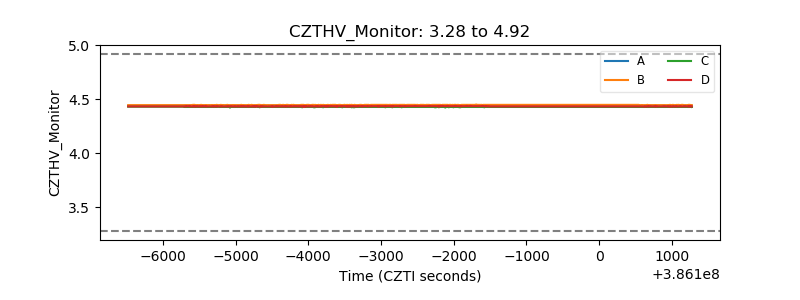 |
| D_VDD | 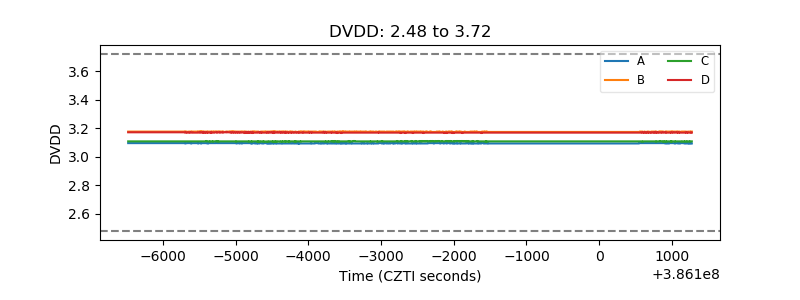 |
| Temperature 1 | 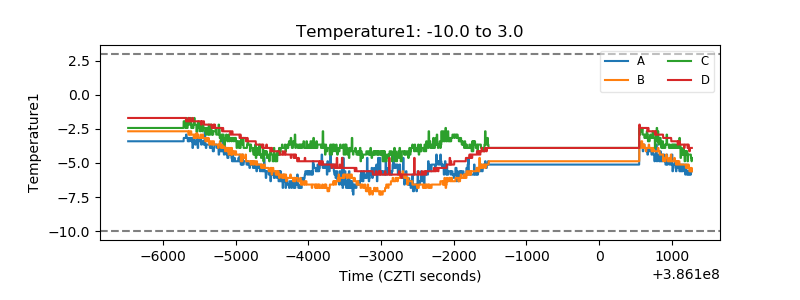 |
| Veto HV Monitor | 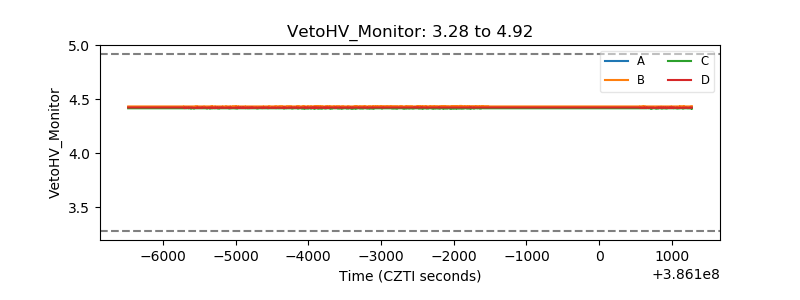 |
| Veto LLD | 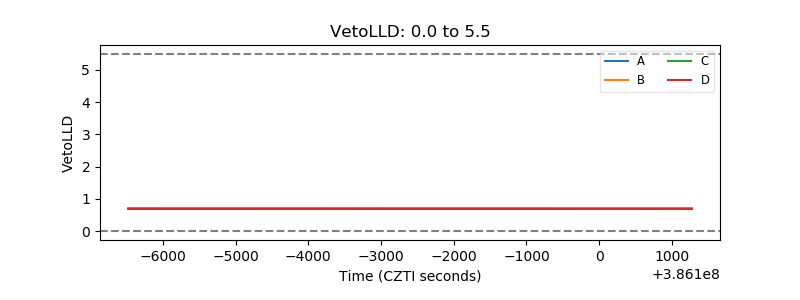 |
| Alpha Counter | 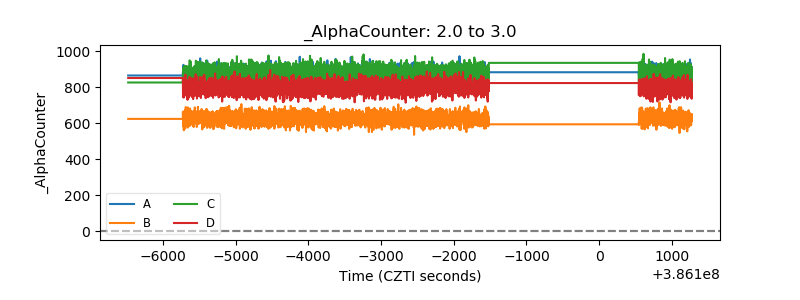 |
| _CPM_Rate | 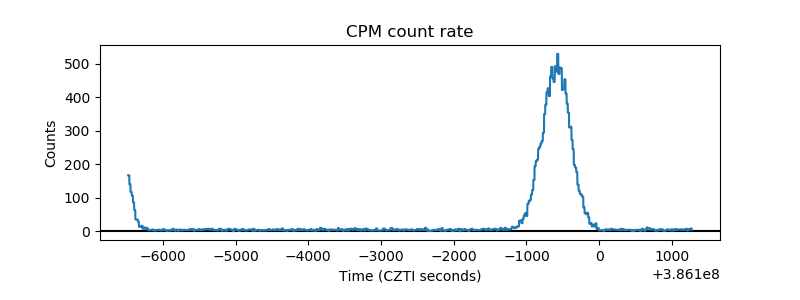 |
| CZT Counter | 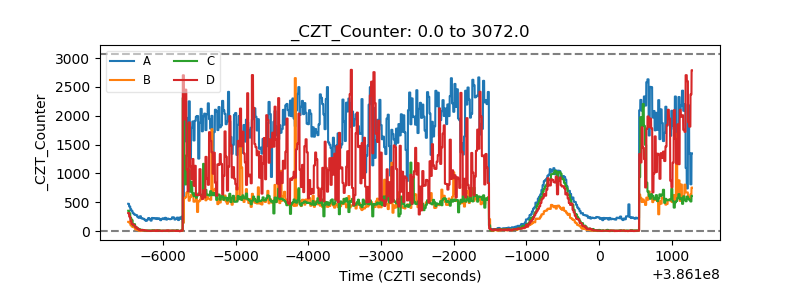 |
| +2.5 Volts monitor | 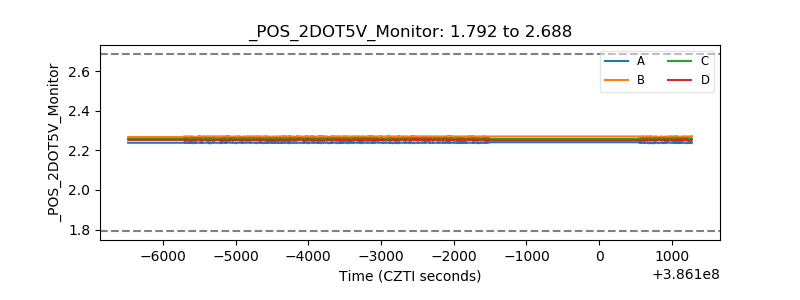 |
| +5 Volts monitor | 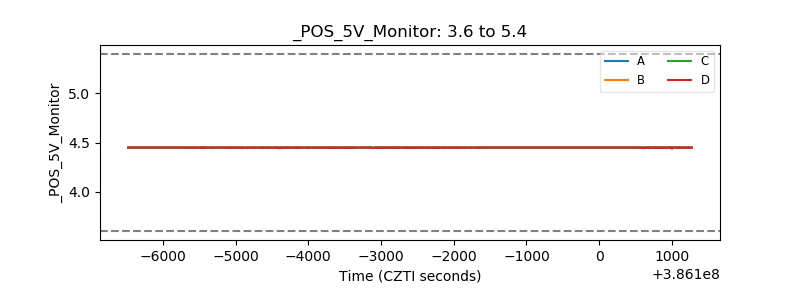 |
| _ROLL_ROT | 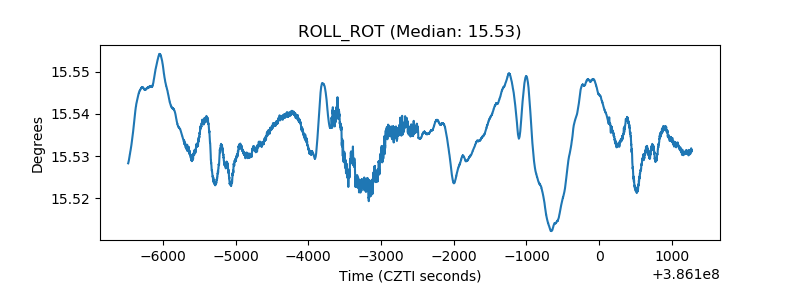 |
| _Roll_DEC | 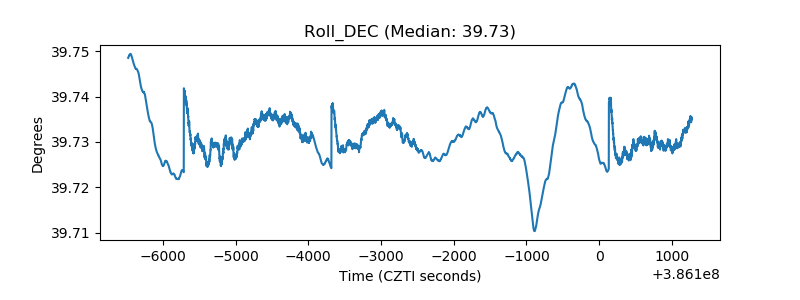 |
| _Roll_RA | 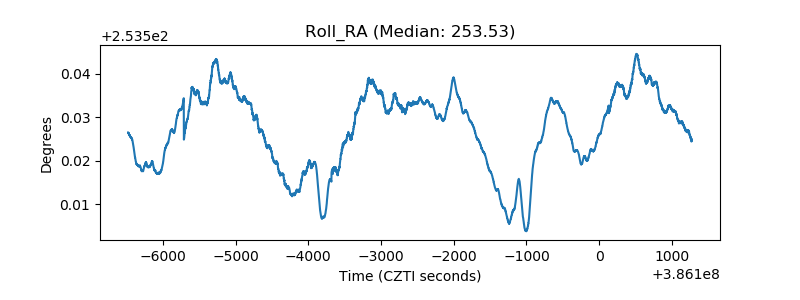 |
| Veto Counter | 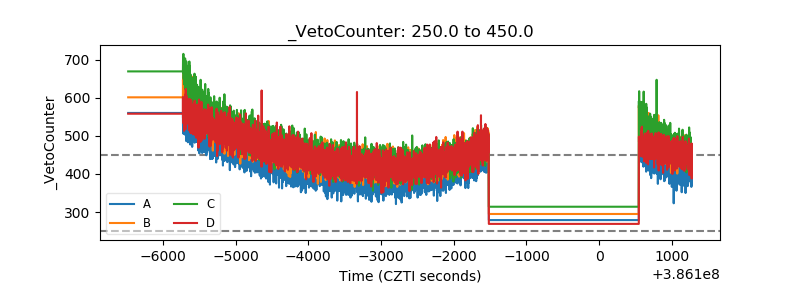 |